The Oilers are posting some excellent results as of late, coming at a critical time where they’re trying to recover from their poor results early on in the season and now holding on to a playoff spot. After 50 games, the Oilers rank fourth in the Pacific division with 60 points (third with a 0.600 points percentage), and holding on to the first wild card spot in the western conference.
It’s really been at even-strength (5v5) where they’ve turned things around, as they’ve gone from a 47% goals for percentage at the Christmas break (a -8 goal differential, after 35 games) to the 52% goal share they have now (a +8 goal differential, after 50 games). Digging through the underlying performance numbers (i.e. shot-share numbers) which help drive results, it’s become evident that the Oilers have gradually been improving for a while now, well before their loss to the Los Angeles on January 9th (game 42) at home, after which the Oilers won seven of their next eight.
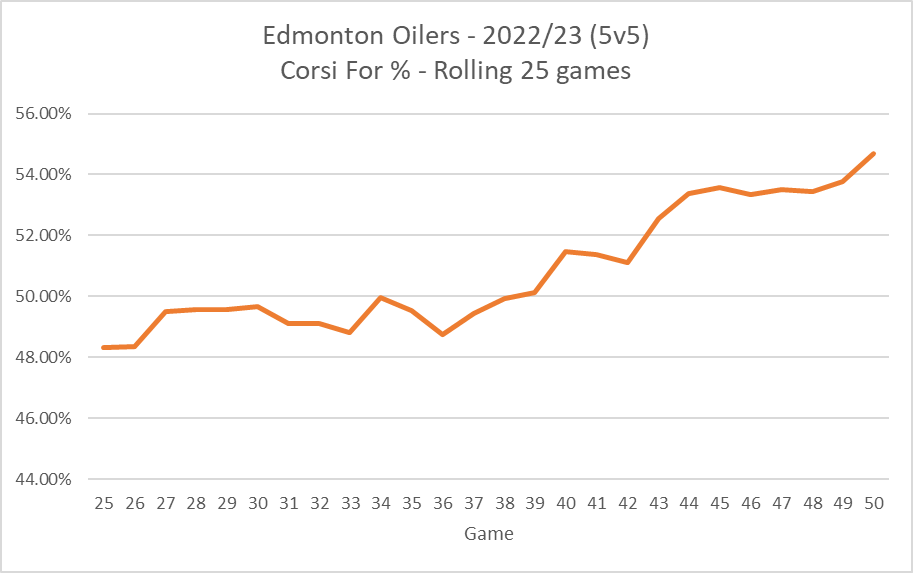
To get a sense of their performance numbers this season, below is the team’s Corsi For percentage over 25-game rolling segments. Early on in the season, the Oilers were having issues controlling the flow of play, spending more time without the puck and posting a Corsi For percentage of 49.2% at the Christmas break (first 35 games of the season), which ranked 19th in the league. And it was part of the reason why at that point they only posted a 47% goal-share (a -8 goal differential) and were struggling to hold on to a wild card spot in the west.
The club’s performance gradually improved with the team posting a 54.68% Corsi For percentage in their last 25 games, which ranks 4th highest in the league and closer to what the Oilers posted under Woodcroft last season. There’s likely been some tactical changes, but it’s also been driven by some key players performing much, much better – especially on the defensive side of things.
It’s hard to pin down exactly when the Oilers decided to change their overall approach. But if I had to guess, it was after their 5-2 loss in New Jersey on November 21st, the 19th game of the season. The Devils dominated the Oilers, controlling 60% of the shot attempts and scoring chances, outscoring the Oilers 4-1 at even-strength – a pretty embarrassing beat down. Perhaps it was seeing first-hand how one of the top teams in the league finds success. Or maybe the fact that after the game, the Oilers were 18th in the league in terms of points percentage that gave them a wake-up call. At that point, they had allowed the sixth highest rate of shots against at even-strength in the league, the third highest rate of scoring chances and the seventh highest rate of goals against. After that game and up until the Christmas break (between games 20 and 35), the Oilers posted a 53% Corsi For percentage, but only a +2 goal differential at even-strength.
Now for simplicity and to see how the Oilers improved over the course of the season, I’ve split the season into two segments – games 1-25 and games 26-50. In the table below, I’ve listed out their various performance metrics (i.e., shot-attempts, expected goals) to get a sense of how well the Oilers controlled the flow of play and scoring chances. I’ve also included the actual results – record, points percentage and goal-share.
| Oilers (5v5) |
First 25 |
Second 25 |
Percent Change |
| Record |
14-11-0 |
14-7-4 |
|
| Point % |
0.560 |
0.640 |
14.3% |
| CF/60 |
54.43 |
61.36 |
12.7% |
| CA/60 |
58.24 |
50.85 |
-12.7% |
| CF% |
48.31 |
54.68 |
13.2% |
| SF/60 |
29.03 |
34.33 |
18.3% |
| SA/60 |
32.42 |
27.78 |
-14.3% |
| SF% |
47.24 |
55.27 |
17.0% |
| xGF/60 |
2.65 |
3.11 |
17.4% |
| xGA/60 |
2.85 |
2.38 |
-16.5% |
| xGF% |
48.24 |
56.59 |
17.3% |
| GF/60 |
2.35 |
3.12 |
32.8% |
| GA/60 |
2.81 |
2.28 |
-18.9% |
| GF% |
45.54 |
57.80 |
26.9% |
| SH% |
8.05 |
9.23 |
|
| SV% |
91.30 |
91.87 |
|
| PDO |
0.994 |
1.011 |
|
The Oilers have made a significant recovery from earlier in the season, at one point posting a 43% goal-share in late November, and have moved up in the standings. The big reason for their success is the improved defensive play as the team has allowed 12.7% fewer shot attempts per hour and 16.5% fewer expected goals per hour compared to the first twenty five games. The rate of shots against in the last 25 games (27.78 per hour) is the eighth lowest in the league – a major improvement from when they were allowing the sixth highest rate in the league after the first 25 games of the season. The team’s performance over the last twenty-five games does indicate that the actual results are sustainable, as long as the roster can maintain league average shooting and save percentages. Barring any injuries to key players, it’s safe to assume that the player-driven metrics will be around the same range they’ve been at for the rest of the season.
Couple other things to note.
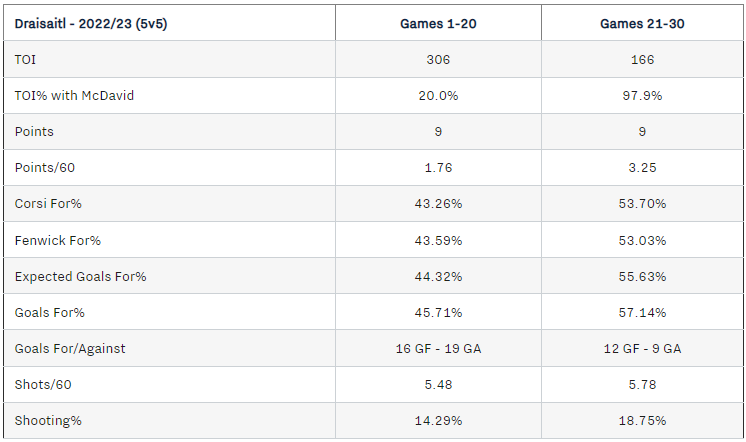
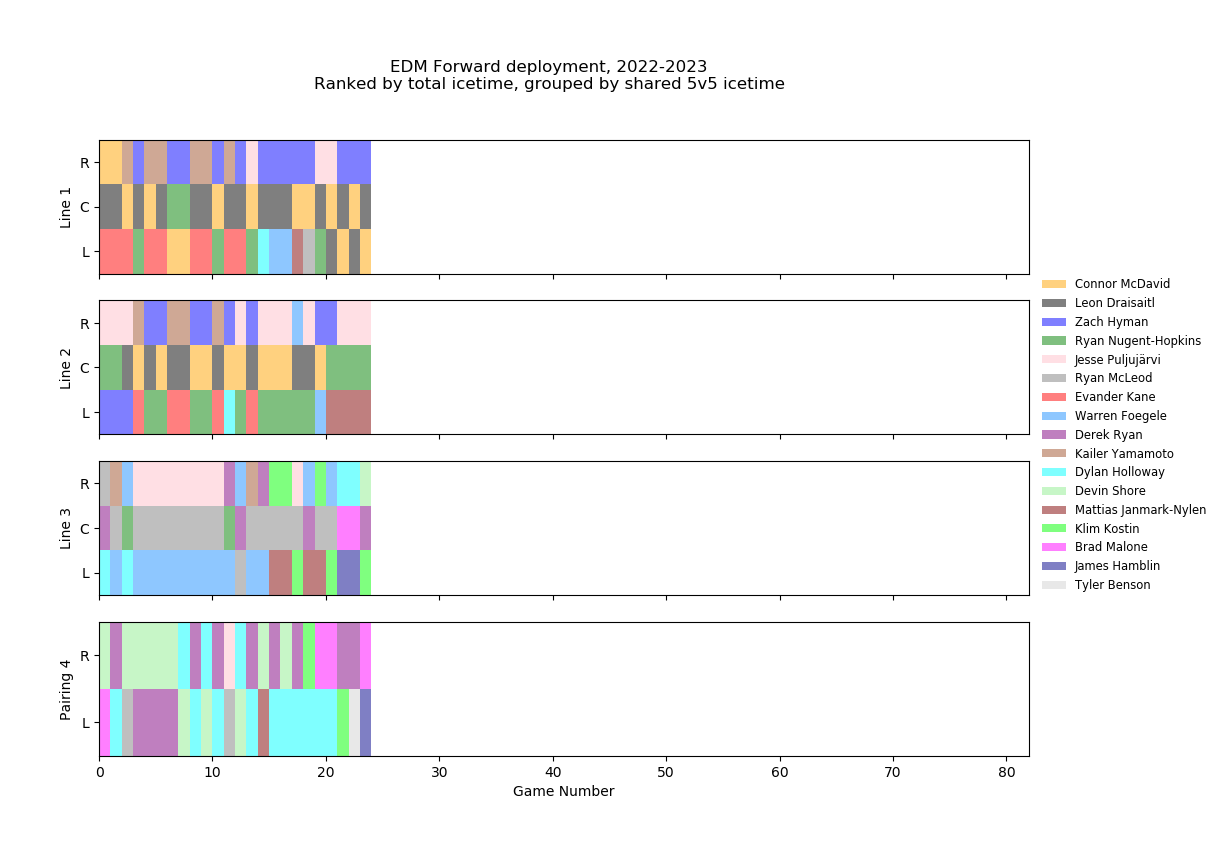
The Oilers are currently performing really well without their two star players, who the coaching staff is playing together a lot more now compared to the first half of the season (and significantly more than last season after Woodcroft took over). In the first 25 games, the duo played 142 minutes together, or approximately 12% of the team’s total even-strength time. In the last 25 games, that’s moved up to 18% (199 minutes) of the team’s total even-strength time. Without the duo, the Oilers have performed well over the year, controlling 52.09% of the shot attempts, and out-scoring opponents 42-36 (a 53.85% goal share). Suspect a big reason why the coaching staff has played their two stars together more often is because of Draisaitl’s struggles at even-strength this season, especially on the defensive side of things. His on-ice shot-share numbers were one of the worst on the team early on in the year, but that’s significantly improved in the last 25 games. Instead of allowing over 35 shots against per hour with Draisaitl on the ice, the Oilers are now allowing just under 30, and much closer to league average levels. It’s unfortunate that Draisaitl can’t be deployed regularly on another line to help spread the offence, but the Oilers are doing fine without the two stars, probably giving the coaching staff some comfort.
I’d be curious to know from the coaching staff about the tactical and deployment changes and what they think the key drivers have been. As mentioned above, the team did start to turn things around much earlier than the Christmas break as they were posting solid shot share numbers between late November and late December, so I’m not convinced that the Christmas break is when changes were implemented. And as great as the success has been, you have to question why it took so long for the team to figure things out. Better late than never, but the Oilers have had to go on quite the run just to hang on to a wildcard spot in the west – something that could have been avoided had the team, and some key players, not played so poorly defensively. Fortunately with the Pacific division being as weak as it is, the Oilers are in a better spot now compared to a month ago.
Data: Natural Stat Trick


:no_upscale()/cdn.vox-cdn.com/uploads/chorus_asset/file/24336434/PacDepth2.jpg)