Pacific depth

With the Oilers currently ranking fifth in the Pacific division and trying to gain some ground in the standings, I wanted to get a sense of the competition in the Pacific and how each team’s depth is performing at even-strength (5v5). None of the teams in the Pacific have been overly intimidating, with each having their own issues either at even-strength or on special teams, and enduring inconsistent play throughout the season. So the race is really going to come down to what edge a club could have over their competition and how aggressively their management moves to address their own deficiencies.

To get a snapshot of each Pacific division team’s depth, I took the forward from each roster who has played the most even-strength (5v5) minutes this season and used their on-ice numbers as a proxy for their team’s first line. I then looked at how each team has performed without that player at 5v5 to evaluate the team’s depth. On average, top lines are deployed for about 30% of a team’s total 5v5 time, leaving a lot of minutes for the depth players who can really make or break a team’s season. It’s also a great way to evaluate how well a general manager has constructed their roster.

Below are the forwards for each team who will serve as a proxy for their team’s first line. Included for reference is their proportion of their team’s total even-strength (5v5) time.

Team Top Line Player TOI%
Anaheim Trevor Zegras 32.6%
Calgary Nazem Kadri 28.2%
Edmonton Connor McDavid 33.6%
Los Angeles Anze Kopitar 30.1%
San Jose Timo Meier 31.9%
Seattle Alex Wennberg 29.0%
Vancouver J.T. Miller 28.9%
Vegas Mark Stone 29.7%

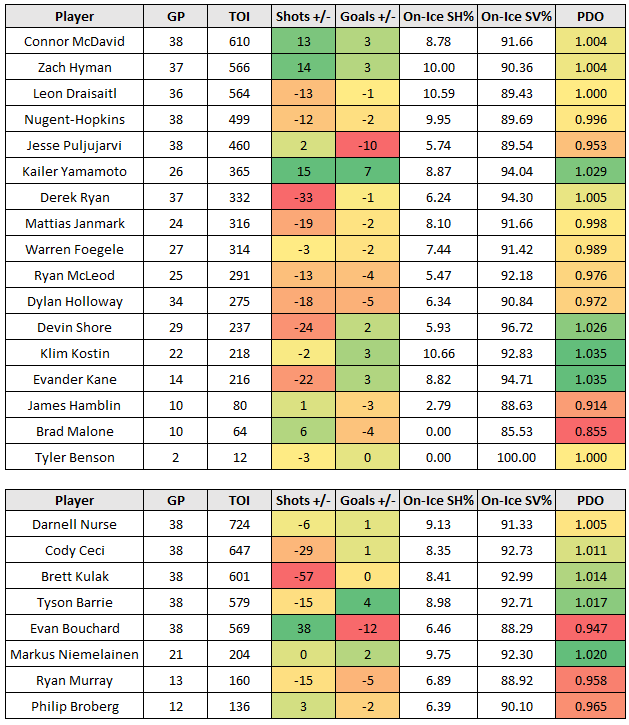
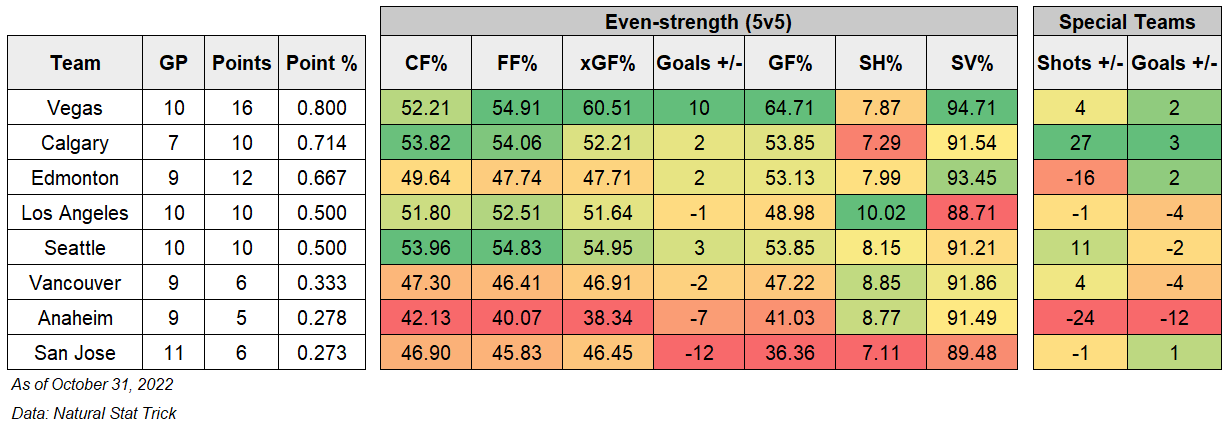
The first table below shows how each team’s top line has performed at even-strength this season, sorted by the team’s current ranking in the Pacific division (based on points percentage). I’ve included the team’s actual results (i.e., goal-share and goal-differential) along with the shot-share metrics like Corsi For percentage (CF%, a proxy for puck possession), and Expected Goals For percentage (xGF%, a proxy for scoring chances) to get a sense of which teams have the right processes in place and if the results are sustainable or not. I’ve also included the team’s shooting percentage and save percentage. A basic heat-map has also been applied to show which teams are doing well or struggling relative to their division rivals.

This second table shows how each team has performed at even-strength without their top line, and included the same data points as the previous table. Again keep in mind, this is for about 70% of the team’s total 5v5 ice time, and will have a major impact on the team’s final standings.

Edmonton isn’t looking too hot here, considering the expectations heading into this season. The top line results at 5v5 have been mediocre, struggling to outscore opponents (+3 goal-differential) and just barely controlling the flow of play. Edmonton’s number’s without their top line are similar to how it’s been the last number of years, with the club consistently getting outshot and outscored – and giving back the majority of the goals that the top line has generated. Their 45.36% goal share without their top line is only ahead of San Jose and Anaheim in the Pacific, and barely ahead of Vegas. It’s a clear indication that management has again done a poor job constructing a competitive roster around their superstar player.

At the top of the division, it appears Vegas is a top-heavy team – controlling the flow of play and outchancing and outscoring opponents with their top line, but giving back everything that’s been gained when their other lines are out there. Vegas’ 44.86% goal-share without their top line is currently only better than San Jose and Anaheim’s, and is the reason why Vegas’ overall 5v5 goal differential is only +1. Seattle is the opposite from Vegas as their top line is the one getting outscored – the third worst goal-share in the Pacific – but getting bailed out by their other three lines that have posted a +26 goal differential. Both Vegas and Seattle are doing a decent job creating opportunities with and without their top lines, a good sign that things should gradually improve. It’ll come down to their finishing talent with either individual players bouncing back or if their management starts exploring the trade market.

Los Angeles and Calgary are pretty similar to one another, doing well when it comes to shot-share metrics regardless of which lines are out there, but are getting sunk by their goaltending that currently ranks near the bottom of the league. They’re both hanging in there though, posting positive goal-differentials with and without their top lines and should continue to remain competitive down the stretch. Calgary’s depth especially should be seeing better results considering their 56% Corsi For percentage and Expected Goals For percentage, but it’ll come down to their finishing talent up front and goaltending. Of the other three clubs at the bottom of the Pacific division standing, San Jose is the most noteworthy as their top line is doing well, posting some of the best shot-share metrics in the division and a 52% goal-share. But they’re clearly lacking everywhere else as their other lines spend more time without the puck and getting outscored at a high rate.

It remains to be seen how Edmonton will make ground in the standings, but it doesn’t appear they’ll see much progress at even-strength, especially when other clubs are posting better shot-share numbers with and without their top lines. It’s again going to come down to what McDavid can do and hope that the rest of the roster can somehow break even in terms of shots and goals when he’s not on the ice. And it’ll be up to the coaching staff to first identify the issues and make the necessary tactical and line-up adjustments. The powerplay is likely going to be the reason Edmonton remains in the race, but it could be over quick if they continue to struggle at even-strength and if the penalty kill continues to be poor.

Data: Natural Stat Trick

Also posted at The Copper & Blue.

Tracking the Pacific division – As of December 31, 2022

We’re 38 games into the regular season and the Edmonton Oilers rank fifth in points percentage in a fairly weak Pacific division. The Oilers continue to get outscored at even-strength (5v5) and rely heavily on their powerplay, which remains one of the best in the league.

Here’s how the Pacific division looks today, with the Oilers posting a 0.553 points percentage, ranking 9th in the western conference and just holding on to the first wild card spot.

Team Record Points Point % Goal differential
Vegas 25-12-2 52 0.667 18
Los Angeles 21-13-6 48 0.600 -9
Seattle 18-12-4 40 0.588 4
Calgary 18-13-7 43 0.566 4
Edmonton 20-16-2 42 0.553 10
Vancouver 16-17-3 35 0.486 -15
San Jose 11-20-7 29 0.382 -26
Anaheim 10-23-4 24 0.324 -68

The good news is that the Oilers overall goal differential (all situations) is now a positive number, which wasn’t the case a month ago when they were one of six Pacific division teams with a negative goal differential. In fact, their current +10 goal differential is the second best in the division – a good reminder that the Pacific is wide-open with each team dealing with their own flaws either at even-strength or special teams and when it comes to goaltending or finishing ability.

Below are the even-strength (5v5) and special teams numbers for each team in the Pacific division (sorted by points percentage) including goal-share results as well as the shot-share metrics that gives us a sense of which teams have the right processes in place and if the results are sustainable or not. I’ve also applied a basic heat-map to show which teams are doing well or struggling relative to their division foes. You can find a description of each metric at the end of this article. Also note that the shot-share metrics are score and venue adjusted based on Natural Stat Trick’s methodology.

There’s been some movement since the last time we checked in on the Pacific with Los Angeles making the most progress moving up to second from fourth, and Calgary moving from fifth to fourth. Edmonton and Seattle have fallen, while Vancouver, San Jose and Anaheim remain at the bottom. No team has really seperated themselves from the pack, including Vegas, each showing some weaknesses that they’ll need to address.

Seattle for example has been strong at even-strength – good shot-share numbers and a solid goal-differential, but their special teams and goaltending have been a big reason why they’ve fallen in the standings. The Kraken powerplay ranks 22nd in the league, generating the third lowest rate of shots and scoring chances. And their penalty kill ranks 31st, largely because of their goaltending. Vegas currently leads the Pacific but they’re just breaking even in terms of goal differential at even-strength because of their average shooting percentage and are relying heavily on special teams to bail them out. Calgary, despite some very good shot-share and puck possesion numbers at even-strength, is having trouble converting those chances into actual goals with some of their key players having down-years. And Los Angeles continues to do well in terms of shot-share and puck possession numbers, but their goaltending is one of the weakest in the league. Again, none of these clubs look like a real threat at this point. It’s really going to come down to which team aggresively addresses their issues first.

Couple things to monitor from an Oilers perspective:

  • A lot of attention is on the Oilers defensive play, and for good reason. At even-strength (5v5), they allow the 11th highest rate of goals against (2.62) and the 12th highest rate of unblocked shot attempts and shots on goalagainst. Every game feels like a referendum on which player should be sent packing next depending on who makes the biggest gaffe. But what’s been overlooked, and definitely tied to the defensive play, is the Oilers lack of offence. They rank 19th when it comes to goals for per hour (2.46) and in the bottom third of the league when it comes to generating shots and scoring chances.
  • The powerplay continues to be excellent, scoring 13.38 goals per hour, ranking first in the league. The success appears to be sustainable considering the talent they have up front and their ability to consistently generate scoring chances. They rank 7th in the league in unblocked shot attempts (a proxy for scoring chances) and 6th in the league when it comes to shots on goal. The Oilers also rank around league average when it comes to drawing penalties – definitely an area worth improving on. It’s a repeatable skill, so you would expect a competent scouting staff to be able to figure out how to identify these types of players, which could help drive better overall results.
  • Over the last ten or so games, the Oilers penalty kill has had better results. They’ve allowed a much lower rate of goals (7.15 per hour) compared to the first 28 games (11.43, 4th highest). But it’s largely been driven by the goaltending. The team continues to allow some of the highest rates of unblocked shot attempts and shots on goals against in the league – an indicator that their results will eventually get worse. Skinner has up until this point been fine on the penalty kill, posting league average save percentage and GSAA. So I wouldn’t expect him to continue bailing out the team if they continue allowing so many chances. The penalty kill needs to do a better job at preventing zone entries and limiting chances. It’s been an ongoing issue since Woodcroft took over, and it might be worth their time to find an assistant who specializes in the area. And that’s assuming the coaching staff is paying attention to the data.

Lastly, here’s a quick snapshot of each players on-ice shot and goal-differential at even-strength, along with their on-ice shooting and save percentages to give a sense of how a player’s season might play out. One player to watch is Klim Kostin who is on a bit of a heater. He’ll definitely get lots of praise for his play and results, but it’s worth tempering expectations.

Data: Natural Stat TrickHockey Viz

Glossary:

  • Points-percentage (Point%) – The total points accumulated divided by the points that were available, including extra time.
  • Corsi For percentage (CF%) – The proportion of all the shot attempts the team generated and allowed that the team generated (i.e., Corsi For/(Corsi For + Corsi Against). This is used as a proxy for possession and is the best at predicting a team’s future share of goals (GF%). (Source: Hockey Great Tapes – Draglikepull)
  • Fenwick For percentage (FF%) – The proportion of all the unblocked shot attempts the team generated and allowed that the team generated (i.e., Fenwick For/(Fenwick For + Fenwick Against). This is used as a proxy for shot quality and considers shot blocking a repeatable skill.
  • Expected Goals For percentage (xGF%) – This is a weighting placed on every unblocked shot based on the probability of the shot becoming a goal. This depends on the type of shot, location and uses historical shot and goals data to come up with the probability for each unblocked shot.
  • Goals For percentage (GF%) – The proportion of all the goals that the team scored and allowed that the team generated (i.e., Goals For/(Goals For + Goals Against).
  • Shooting percentage (SH%) – The percentage of the team’s shots on goal that became goals (i.e., total goals divided by the total shots on goal).
  • Save percentage (SV%) – The percentage of the team’s shots on goal against that were saved (i.e., 1-(totals goals allowed divided by the total shots on goal against).

What’s going on with Leon? – Part 2

The last time we checked in on Leon Draisaitl a few weeks ago, he was getting lots of points on the powerplay but really struggling to produce at even-strength. His rate of points per hour was well below his career levels, and he was posting some of the worst on-ice numbers on the team with the Oilers getting badly outshot when he would be on the ice.

Likely recognizing Draisaitl’s issues at even-strength and the negative impact it was having on the team’s overall results, the coaching staff made some adjustments to get the forward’s even-strength production back on track. The solution: give Draisaitl more ice time with Connor McDavid.

Over the last ten games, the coaching staff has deployed the two on a line together at even-strength more consistently and it’s done wonders for Draisaitl. In these ten games since November 26th, Draisaitl has posted nine points in 166 minutes of ice time – a points per hour rate of 3.25. That’s a significant improvement from the first 20 games of the season when he had nine points in 306 minutes – a points rate of 1.76 and well below his previous three year average of 2.68.

The table below breaks down Draisaitl’s individual and on-ice numbers in the first twenty games of the season where he spent about 20% of his ice time with McDavid, and the last 10 games where he’s been McDavid’s regular wing man, spending 98% of his ice time with the captain.

A big reason why Draisaitl has been so much more productive is the significant improvement in his on-ice shot-share numbers. Playing alongside McDavid, Draisaitl has seen his on-ice possession numbers (i.e., Corsi) and share of scoring chances (i.e., Fenwick) improve by about ten percentage points, going from around 43% all the way to 53% – levels you would expect from high-end talent. The team is spending far more time playing with the puck when Draisaitl has been on the ice in the last ten games, and the results have been much better as well. Prior to being McDavid’s regular winger, Draisaitl was posting an on-ice goal-share of 45% (a -3 goal differential). Since then, he’s posted a goal-share of 57%, a +3 goal differential in these ten games.

With Draisaitl needing to play with McDavid more often to remain productive, it does make the Oilers more vulnerable to getting outshot and outscored when the two aren’t on the ice. Instead of playing around 18 even-strength minutes per game without one of the two being deployed, the Oilers are now playing about 29 minutes per game without them. The Oilers play about 47 minutes per game at even-strength this season, meaning they won’t have one of their two star players on the ice for about 61.7% of their 5v5 time. Ideally, coaches are spreading out their offence and Draisaitl is a scoring threat on his own line, giving the coaching staff an advantage when it comes to even-strength matchups and overwhelming opponents. But if Draisaitl can’t put up even-strength points and becomes a defensive liability without McDavid, the Oilers coaching staff will need to figure out deployment and tactical strategies for the other three lines to ensure they’re not getting out-shot, out-chanced and out-scored without the two star forwards. This might also require some tweaks to the roster construction, something Oilers management has often struggled with.

Up until this point of the season (30 games in), the Oilers are posting a 49% Corsi for percentage and a 47% Expected goals for percentage when McDavid and Draisaitl haven’t been on the ice. These below-average shot-share numbers have lead to a 47% goal-share, or a -2 goal differential – a major issue for the team that has high playoff aspirations. And while the results without McDavid or Draisaitl on the ice have been better over the last ten games, it doesn’t appear to be sustainable considering they continue to get out-chanced regularly without their star players.

So while it’s great to see Draisaitl produce at even-strength again, it does come at a significant cost – one that could impact the Oilers chances of being a legitimate contender.

Data: Natural Stat Trick

Also posted at The Copper & Blue.

Dispirit

With the Edmonton Oilers currently struggling to break even at even-strength (5v5) this season, they desperately need their special teams to keep them afloat and competitive in a fairly mediocre Pacific division. And while the Oilers powerplay continues to dominate and remain one of the best in the league, the penalty kill is struggling mightily allowing one of the highest rates of goals against in the league, completely nullifying everything that their high-octane powerplay has produced.

Over the first 25 games of the season, the Oilers penalty kill has allowed 26 cumulative goals against (3 GF, 29 GA) – a rate of 12.60 goals against per hour, which is fourth highest in the league. One of the main drivers for their poor results is the team’s defensive play, as the club struggles defending the blue line for zone entries and keeping chances outside the high danger scoring areas. And this is reflected in the team’s rate of unblocked shot attempts against (a proxy for scoring chances), which is ninth highest in the league (82.98 per hour) and the rate of shots on goal against which is sixth highest (61.69 per hour).

The team’s defensive play is an issue that’s carried over from last season when they were posting similar numbers, but were being bailed out by the goaltending which posted the 10th best save percentage in the league (87.53%). This year, they’re not getting the same rate of saves on the penalty kill as the current Campbell-Skinner tandem has thus far posted a combined save percentage of 79.58% – which ranks 29th in the league. Campbell is especially struggling on a high-event penalty kill, something that was somewhat expected considering his previous team in Toronto allowed some of the lowest rate of shots against when shorthanded. Among 42 goalies who have played at least 45 minutes on the penalty kill this season, Campbell ranks 39th with a 78.90% save percentage and a -4.73 goals saved above average. Skinner isn’t faring much better, as he ranks 36th in the same pool of goalies with a 80.30% save percentage and 37th when it comes to goals saved above average with -3.21.

These results are especially frustrating when you consider the fact that everything the Oilers powerplay has done for the team has been completely offset by the defensive play and goaltending on the penalty kill. Consider the talent on the powerplay, the cost of these players, the practice time, and the chemistry that’s been developed for them to be one of the best units in the league. It’s all been washed away by a penalty kill that surrenders so many shots, chances and goals against – and preventing the powerplay from being an actual asset. Especially at a time when the Oilers are struggling at even-strength, posting a negative goal differential and below-average shot-share numbers, the Oilers can’t afford deficiencies of this scale.

The Pacific division is wide-open at this point with six of the eight teams currently posting negative goal differentials (in all situations). Fixing the penalty kill, either through tactical or deployment adjustments, has to be a top priority for the coaching staff if they intend on locking down one of the top three playoff spots.

Data: Natural Stat Trick

Also posted at The Copper & Blue.

Tracking the Pacific division – As of November 30, 2022

While the Edmonton Oilers aren’t having the greatest season, the good news is that most of the Pacific division is struggling as well. Six of the eight teams have a negative goal-differential at this point, with only Vegas and Seattle leading the pack. Worth noting too that four of the eight teams in the Central division are also posting negative goal-differentials, with only Dallas, Winnipeg and Colorado having solid seasons so far.

Team Record Points Point % Goal differential
Vegas 17-6-1 35 0.729 +20
Seattle 14-5-3 31 0.705 +16
Edmonton 13-10-0 26 0.565 -3
Los Angeles 12-9-4 28 0.560 -5
Calgary 10-9-3 23 0.523 -3
Vancouver 9-11-3 21 0.457 -8
San Jose 8-14-4 20 0.385 -15
Anaheim 6-15-2 14 0.304 -37

Despite their issues, the Oilers are still posting the third best points percentage in their division, largely driven by their powerplay which generates the third highest rates of goals per hour in the league. Everything else – even-strength play and results, their penalty kill, their goaltending – it all needs work if they want to qualify for the playoffs.

Below are the even-strength (5v5) numbers for each team in the Pacific division (sorted by points percentage) including goal-share results as well as the shot-share metrics that gives us a sense of which teams have the right processes in place and if the results are sustainable or not. I’ve also applied a basic heat-map to show which teams are doing well or struggling relative to their division foes. You can find a description of each metric at the end of this article. Also note that the shot-share metrics are score and venue adjusted based on Natural Stat Trick’s methodology.

Not much has changed for the Oilers since the last check-in at the end of October other than the goal-share dropping significantly, something that was expected considering their shot-share numbers and expected goal-share had been below average and some of the lowest in the division. And these numbers are still poor after 23 games, putting the Oilers at risk of losing ground to the Los Angeles and Calgary who are both posting some of the strongest Corsi for percentages and expected goal shares in the league. Issue for both teams is currently goaltending, which has somehow been worse than Edmonton’s, and it could sink their playoff chances if it doesn’t get sorted out. I’m also curious to see if Seattle’s powerplay, which currently ranks 7th in the league in terms of goals per hour, can continue to drive their overall results. They currently generate some of the lowest rates of shots and scoring chances on the powerplay, so I’m expecting things to cool off.

Back to the Oilers – it seems like the best idea that the coaching staff could think of to improve their 5v5 results (and to get Draisaitl going) is just putting McDavid and Draisaitl together on the ice as much as possible. In the first 19 games of the season, the duo only played 60 minutes together – or about 6.5% of the team’s total ice time. That’s still higher than what I was expecting considering they rarely played together after Woodcroft took over last season, but lower nonetheless. Over the last five games, however, McDavid and Draisaitl have played 69 minutes together – or about 29% of the team’s total ice time. In that time, the Oilers have posted a Corsi for percentage and expected goals for percentages closer to 60% and outscored opponents 5-3. Not sure how sustainable this is with both players averaging more total ice time per game, but it feels like the coaching staff is out of ideas and doing what they know will work. The concern of course will be the rest of the roster and if they can post positive shot-share metrics and goal differentials at 5v5 without their star players on the ice. Definitely something worth monitoring over the next month.

Data: Natural Stat Trick, Hockey Viz

Glossary:

  • Points-percentage (Point%) – The total points accumulated divided by the points that were available, including extra time.
  • Corsi For percentage (CF%) – The proportion of all the shot attempts the team generated and allowed that the team generated (i.e., Corsi For/(Corsi For + Corsi Against). This is used as a proxy for possession and is the best at predicting a team’s future share of goals (GF%). (Source: Hockey Great Tapes – Draglikepull)
  • Fenwick For percentage (FF%) – The proportion of all the unblocked shot attempts the team generated and allowed that the team generated (i.e., Fenwick For/(Fenwick For + Fenwick Against). This is used as a proxy for shot quality and considers shot blocking a repeatable skill.
  • Expected Goals For percentage (xGF%) – This is a weighting placed on every unblocked shot based on the probability of the shot becoming a goal. This depends on the type of shot, location and uses historical shot and goals data to come up with the probability for each unblocked shot.
  • Goals For percentage (GF%) – The proportion of all the goals that the team scored and allowed that the team generated (i.e., Goals For/(Goals For + Goals Against).
  • Shooting percentage (SH%) – The percentage of the team’s shots on goal that became goals (i.e., total goals divided by the total shots on goal).
  • Save percentage (SV%) – The percentage of the team’s shots on goal against that were saved (i.e., 1-(totals goals allowed divided by the total shots on goal against).

What’s going on with Leon?

The star forward is among the league leaders in points, but his production and on-ice numbers at even-strength are lower that expected. It’s critical for the coaching staff and management to figure out what’s going on with Draisaitl if they want their 5v5 numbers to improve.

There’s obviously a lot of team-wide issues right now for the Edmonton Oilers, as the club ranks fifth in the Pacific with a 0.526 points percentage and ninth in the western conference. Defensive play has been poor, the offence has dried up, and there’s plenty of questions about the roster construction and the potential internal solutions. It’ll be interesting to see how the coaching staff and management navigate things in such a high pressure season.

Even-strength (5v5) play is the biggest point of weakness for the club as they’re getting out-shot, out-chanced and out-scored regularly – ranking in the bottom third of the league when it comes to performance indicators that drive positive results. And it’ll need to improve if the Oilers want to keep up with the top teams in the league.

One player in particular that is currently struggling playing even-strength minutes is Leon Draisaitl. He’s a proven star in the league and can improve the team’s odds of winning games. And he’s among the league leader in points this season because of his dominance on the powerplay. But his even-strength numbers this season, including his personal numbers and his on-ice numbers, have been poor compared to his previous three seasons – and it’s part of the reason why the Oilers are struggling to win games.

Starting with his personal numbers, Draisaitl currently has nine even-strength points which ranks fourth on the Oilers – a points per hour rate of 1.85. That’s a drop from the 2.68 points per hour from his previous three seasons – a level that top line, star forwards typically produce at. Heading into this current season, Draisaitl’s rate of points ranked 17th among over 500 forwards who played at least 1,000 minutes since 2019, a period in which he’s accumulated the third highest number of points in the league. His current rate of 1.85 ranks 131st among 324 players who have played at least 200 minutes this year – not anywhere near where he should be considering his history.

What’s driving his drop in production is his individual rate of shots per hour which has decreased from 6.43 per hour over the last three seasons to 5.56. And his shooting percentage is also lower than expected, currently sitting at 14.81%. Considering his age and his talent, you would expect to see his rate of shots and his shooting percentage to gradually improve, resulting in better productivity over the course of the season. But there’s a couple other issues to consider.

One reason for his lower rate of shots per hour this season is the fact that the Oilers are spending a significant amount of time without the puck when he’s on the ice, as reflected by the team’s Corsi For percentage (a proxy for puck possession) of 42.83%. The team is also getting out-chanced more regularly when Draisaitl is on the ice with, as reflected by their 43.19% share of expected goals (a proxy for scoring chances and shot quality) – which again is a drop from the levels we’ve seen with him on the ice over the last three seasons. All of Draisaitl’s on-ice shot-share numbers (i.e., Corsi For%, Fenwick For%, Expected Goals For%) are some of the lowest on the team, only ahead of Holloway and Shore. And it’s on the defensive side of things where the Oilers are really struggling with Draisaitl, as they see more than a 17% increase in the rate of shot attempts, unblocked shot attempts and shots on goal against with their star forward on the ice. The rate of expected goals against this season – which factors in shot quality and scoring chances against – increases by 26% with Draisaitl on the ice, going from 2.78 per hour to 3.51.

Draisaitl’s poor on ice numbers at even-strength is pretty significant considering the expectations on him as a player and the team this season. The Oilers top six is supposed to be one of the best in the league, but it’s hard to accomplish anything when a star forward is struggling and the team is failing to control the flow of play and total scoring chances with him on the ice.

What’s worth noting is that Draisaitl is struggling with pretty much every linemate and defenceman on the Oilers, unable to post shot-share numbers like Corsi For% and Expected Goals For% above the 50% break-even mark, regardless of the player he’s with.

The one player that Draisaitl is having success with this season is Bouchard, as they’ve played 90 minutes together and posted a Corsi For percentage of 51.71% and an Expected Goals For percentage of 52.26 – both numbers being well above the team’s current averages. With Nurse having his own issues and posting some of his worst on-ice numbers in his career this season, it might be beneficial to the team, and especially for Draisaitl, if Bouchard saw an increase in his even-strength minutes and more time with the top lines.

Whatever the coaching staff and management decide to do to improve the team, whether it’s internal or external solutions, it’s important to have a firm grasp of the real issues plaguing the team and implementing changes that help improve the odds of winning games. Considering their poor results and underlying numbers at even-strength – where 80% of the game is played – it’s critical they focus here first and find tactical and deployment solutions as soon as possible.

Data and glossary: Natural Stat Trick

Also posted at The Copper & Blue.

Issue detection

Really can’t emphasize enough how much of a drop off there’s been when comparing this season’s results to last season after the coaching change occurred. One of the biggest improvements the Edmonton Oilers made after Jay Woodcroft took over in February 2022 – and what helped drive the overall results – was the team’s possession and scoring chance numbers at even-strength as the club went from around league-average levels to being one of the best in the league.

After the coaching change last season, the Oilers played more aggressively with leads, they spread out their offence across multiple lines and their depth players weren’t getting out-shot and out-chanced as much as they had been in previous seasons. All of these coaching-driven factors played a major role in the overall results at the end of the 2021/22 regular season, and the process behind it all was based on sound logic and reasoning.

Fast forward to this season, and the team isn’t anywhere near where they were in the final thirty-eight games of last season. Their possession numbers and share of scoring chances are currently some of the lowest in the league, with their Corsi For percentage dropping down from 53.71% last season to 47.76% this season. And their share of expected goals is down to 46.29% – which ranks 26th in the league only ahead of Anaheim in the Pacific division.

Now it’s understandable if the Oilers defensive play gets most of the attention as the results are what stands out first. They’re currently allowing the seventh highest rate of goals against at even-strength (2.78), and their penalty kill is allowing 12.04 goals against per hour – the third highest in the league. Management didn’t exactly build a strong, championship caliber defence core either and we’ve seen established players struggle throughout this season and some of the young prospects struggle to gain traction at the NHL level. The team also spent a lot of money on a new starting goalie who is struggling early on this season – which was also somewhat expected.

When we dig into the actual results, we see that they’re somewhat expected as the club is having all sorts of issues preventing shots and scoring chances at even-strength, with their rates all having increased by a significant margin compared to last season. For instance, the rate of expected goals against – which factors in shot quality and the probability of an unblocked shot becoming a goal – has increased by 17.4% this season. The table below shows the other defensive numbers from this season and the thirty eight games under Woodcroft from last season with percentage changes.

What’s further troubling are the issues up front.

With arguably one of the best top-six forward groups in the league, and with the powerplay having a lot of success and McDavid and Draisaitl leading the league in points – it can generally be assumed that the Oilers offence is and will be just fine. But if we take a look at the numbers at even-strength, that’s really not the case. And things have taken a significant hit compared to last season, similar to the levels experienced on the defensive side of things.

The Oilers are only scoring 2.26 goals per hour at even-strength, which ranks 24th in the league and last in the Pacific division. The biggest issue is that they generate some of the lowest rates of shot attempts, shots on goal and scoring chances – all of which have dropped over 10% compared to last season. The Oilers current offensive rates have them in the bottom third in the league for each category – a big drop off from the end of last season where they were closer to the top five in the league after Woodcroft took over.

You’d hope someone in the Oilers management group is aware of this situation and is questioning (a) how the roster was built the way it was, and (b) the coaching tactics and player deployment that is being implemented. There’s a significant problem in Edmonton both offensively and defensively, and it’s critical for the team to get things on track if they want to be considered a championship contender.

Data: Natural Stat Trick

Also posted at The Copper & Blue.

Bringing it home

When talking about the Oilers struggles this season at his media availability this afternoon, Woodcroft commented about the success the Oilers have had on the road this season and wanting to make their home arena a tougher place to play in for opponents.

The good news is that we’ve demonstrated a competitiveness, a will to win, a finding a way to win. Our level of simplicity and effectiveness on the road where we’re 5-2, we got to bring that home. And we got to figure out a way to make this the toughest arena in the National Hockey League to come into. We’ve done that in the past, we got to do it again. And I think that comes down to a level of consistency and building a level of consistency in your game. (Source)

Had to take a look at the data to see what exactly the difference was between the Oilers performance at home versus on the road, expecting to see some differences. But that’s not exactly what the data shows.

2022/23 Record Points% Goals For/Goals Against
Home 4-5-0 0.444 34-34
Road 5-2-0 0.714 25-24

While the Oilers have had more success on the road so far this season, there’s not much that you can take away and build off of or want to replicate at home. Their overall goal differential is only marginally better on the road, and it’s it’s worth noting that their underlying numbers at even-strength (5v5) inidicate that their results are unsustainable.

Oilers – 2022/23 (5v5) Home Road
Corsi For% 48.87 45.18
Fenwick For% 47.56 45.11
Expected Goals For% 48.61 43.18
Goals for/against 17-21 12-14
Goals for% 44.74 46.15
Shooting% 7.23 8.62
Save% 90.65 92.81
PDO 0.979 1.014

The Oilers are currently one of the worst teams on the road when it comes to controlling the flow of play and total scoring chances as reflected by their 45% Corsi For percentage and Fenwick For percentage. They have a -2 goal differential at even-strength as well, which again is only slightly better than their -4 goal differential at home.

The real reason they’re having success on the road is their goaltending, which is posting a 92.81% save percentage. Reason for that is Skinner who has played four of the Oilers seven road games while Campbell, who has struggled so far this season, has played seven of the nine home games. So if there’s anything the Oilers can take away from their road success, it’s that they should play Skinner more often at home.

Other than that, the Oilers don’t have any real strengths on the road. I’d be curious to hear Woodcroft elaborate on his comments and see if there’s anything tangible he’d like his team to improve on.

Data: Natural Stat Trick

Impact statement

Sixteen games into the 2022/23 season and the Oilers haven’t established a whole lot. They have some points in the banks, have had some big wins, namely two on the road in Tampa and Florida. And their two superstars are leading the league in points. But the team hasn’t rounded themselves into proper form or made any sort of statement that they’re contending for a title.

So far at even-strength (5v5), they have a -6 goal differential, a goal-share of 45.31% that ranks 24th in the league and only ahead of Anaheim and San Jose in the Pacific division. The big issue right now is that they spend more time without the puck as reflected by their 47.32% Corsi For percentage, that ranks 24th in the league. And they allow the fifth highest rate of shots and scoring chances against leaguewide – currently giving up 47 unblocked shot attempts (i.e., Fenwick) per hour and allowing 34 shots on goal against per hour. Important to note that the Oilers are getting league-average goaltending at even-strength with their team save percentage of 91.61% ranking 16th in the league. And the team is posting a shooting percentage also around league average (7.78%). The struggles appear to be a system and deployment issue, something the coaching staff has a strong influence on, so the focus for now really should be there.

Below is a summary of the Oiler’s numbers ar even-strength (5v5), with the shot-share metrics being score and venue adjusted according to Natural Stat Trick’s method. I’ve also included the Oiler’s even-strength numbers from the 38 regular season games from last season that Woodcroft coached. That’s really the baseline that the Oilers should be working towards as we know the team is capable of playing at that level for an extended period of time.

SeasonGPPoint %CF%FF%xGF%Goal diff.GF%SH%SV%PDO
2021/22380.72453.7153.2953.25+2056.028.7891.981.008
2022/23160.56347.3246.5346.45-645.317.7891.610.994

Comparing the two periods, there’s been a pretty clear drop-off from last season, something we saw as early as five games into this season. We know the coaching staff is capable of applying some basic principles and getting stronger underlying shot-share metrics than they have right now – and improving the team’s odds of winning games. But it remains to be seen if the coaching staff can revert back to some of their tactics that gave them so much success at the end of last season.

One tactic in particular is their aggressiveness at even-strength when protecting a lead. While most teams tend to play more conservatively with a lead – more often dumping the puck rather than making a play to create a scoring chance – the Oilers appeared to be bucking that trend last season under Woodcroft when they would continue to generate offence as a way to protect a lead.

When team’s are leading in a game, they on average post a Corsi For% around 45% at even-strength. The Oilers last season under Woodcroft posted a Corsi For percentage of 57% with a lead – one of the highest in the league, behind only Calgary and Florida. This was much higher than the Oilers have ever posted with the lead under various coaches, so there was some hope that this new coaching staff was willing to try different things to have success.

Unfortunately however, the Oilers coaching staff has been far less aggressive with the lead this season, only posting a Corsi For% of 45.6%, which ranks 18th in the league. More teams are currently playing more aggressively with the lead compared to previous season, so  it’d be interesting to see if the Oilers have purposely played more conservatively thus far or if there’s some other issues the coaching staff is dealing with. Definitely something to monitor. Either way, the team will need to explore every option, including what worked for them last season, to improve their odds of winning games and banking some more points.

Data: Natural Stat Trick

Tracking the Pacific division – As of October 31, 2022

The Oilers are off to an okay start to the 2022/23 regular season, having struggled at home in their first six games, but then getting great results on the road winning three games in four nights.

Here’s what the Pacific division looks like at this point, sorted by points percentage.

Team Record Points Point % Goal differential
Vegas 8-2-0 16 0.800 +15
Calgary 5-2-0 10 0.714 +4
Edmonton 6-3-0 12 0.667 +8
Los Angeles 5-5-0 10 0.500 -6
Seattle 4-4-2 10 0.500 -1
Vancouver 2-5-2 6 0.333 -7
Anaheim 2-6-1 5 0.278 -18
San Jose 3-8-0 6 0.273 -10

Edmonton is right where they have to be – a points percentage above 0.650 and top three in the division. The powerplay is once again the main driver for their overall success, but the goaltending at even-strength has also been a factor. 

The rest of the division, and the conference for that matter, isn’t looking all that threatening at this point. Only two teams in the entire eastern conference have a negative goal-differential (Toronto and Columbus), while five teams in the Pacific and four teams in the Central division are in the red. Early days obviously, but the path to the cup in the west doesn’t seem as daunting as it does in the east.

Below are the even-strength (5v5) numbers for each team in the Pacific division (sorted by points percentage) including goal-share results as well as the shot-share metrics that gives us a sense of which teams have the right processes in place and if the results are sustainable or not. I’ve also applied a basic heat-map to show which teams are doing well or struggling relative to their division foes. You can find a description of each metric at the end of this article. Also note that the shot-share metrics are score and venue adjusted based on Natural Stat Trick’s methodology.

I’ve also included each team’s results on special teams, combining the goals for and against on the powerplay and penalty kill, as well as the total shots.

Looking at the even-strength numbers first, we see that while the Oilers are getting decent results, they only have a +2 goal differential and their underlying shot share numbers indicate the success may not be sustainable. Their Corsi For% of 49.64% ranks 19th in the league, while their expected goals for percentage of 47.71% ranks 20th and ahead of only Vancouver and Anaheim in the Pacific. That’s significantly lower than what the Oilers posted in the 38 games Woodcroft coached last season, so I’m expecting these numbers to gradually improve.

The Oilers are getting excellent goaltending thanks to young Stuart Skinner, who ranks first among the 55 goalies who have played at least 100 minutes with a 0.971 save percentage and fourth with a +5.79 goals saved above average (GSAA). He ranks well alongside some pretty good goalies, so hopefully he can sustain above-average numbers as the season progresses. Campbell on the other hand hasn’t been as sharp, something that was expected heading into the season, as he ranks 41st among the 55 goalies in terms of save percentage with 0.905 and 40th with a -1.29 GSAA

Rank (GSAA) Player Team GP TOI SV% GSAA
1 Connor Hellebuyck WPG 7 340 0.947 6.58
2 Carter Hart PHI 6 271 0.952 6.03
3 Jake Oettinger DAL 7 296 0.957 5.83
4 Stuart Skinner EDM 4 178 0.971 5.79
5 Alexandar Georgiev COL 6 290 0.949 5.19
6 Logan Thompson VGK 6 285 0.954 4.99
7 Linus Ullmark BOS 7 285 0.948 4.33
8 Craig Anderson BUF 3 144 0.961 3.42
9 Tristan Jarry PIT 6 281 0.936 3.19
10 Ville Husso DET 5 230 0.937 2.73

Now in nine games, the Oilers have outscored their opponents at even-strength only three times, largely depending on their powerplay to bail them out. Which brings me to my next point.

The Oilers powerplay has been outstanding so far, scoring 11 goals and allowing one. With the talent they have and the history they have together, the Oilers have no issues generating high quality chances and finishing them. What is concerning is the penalty kill which has almost given back everything that this outstanding powerplay has generated. In nine games, the Oilers penalty kill has allowed ten goals and scored two, allowing a rate of 9.76 goals against per hour – sixth highest in the league. They’re also allowing the sixth highest rate of shots against per hour, an issue that has long plagued the Oilers and appears to be continuing under Woodcroft. In such a high-pressure season, the Oilers cannot afford a horrendous penalty kill, especially if their even-strength numbers remain closer to league average.

One other observation from these first nine games is how often the coaching staff is deploying McDavid and Draisaitl together at even-strength. It’s well-established the importance of having multiple scoring lines in the league, spreading the offence to overwhelm opponents. And while it’s fun having two star players on the ice together, it makes a lot more sense playing these two on separate lines and increasing the odds of out-scoring teams.

Last season after Woodcroft took over, McDavid and Draisaitl were deployed together for only 55 minutes at even-strength in the 38 games – so about 3% of the team’s total ice time. At home, they played together for about 17 minutes or 1.8% of the team’s total ice time. And on the road, they played 38 minutes together, or about 4.3% of the team’s total ice time. The consistency of having these two anchoring their own lines at 5v5 was a massive reason for the team’s results last season.

This season, for whatever reason, the coaching staff has deployed the two stars together more often – playing them for 35 minutes or about 8.5% of the team’s total ice time. And almost all of that happened at home in the first six games. Perhaps it was the closer games at home or the fact that the rest of the team was struggling that increased their ice time together. But it was interesting to see how fast the coaching staff went to this option as it does come across as panicky.

5v5HomeAway
2021/221.8%4.3%
2022/2311.8%1.6%

I’m expecting the coaching staff to keep these two on separate lines going forward, as it does improve the odds of outscoring opponents. The key will be keeping them separated regardless of how the season is going, which is probably a lot easier said than done. This is also the first time we’re seeing how Woodcroft will perform over the course of a full season and how he navigates losing streaks and injuries. Just hoping he sticks to his plan and overall approach instead of repeating the mistakes of previous coaches.

Data: Natural Stat Trick

Glossary:

  • Points-percentage (Point%) – The total points accumulated divided by the points that were available, including extra time.
  • Corsi For percentage (CF%) – The proportion of all the shot attempts the team generated and allowed that the team generated (i.e., Corsi For/(Corsi For + Corsi Against). This is used as a proxy for possession and is the best at predicting a team’s future share of goals (GF%). (Source: Hockey Great Tapes – Draglikepull)
  • Fenwick For percentage (FF%) – The proportion of all the unblocked shot attempts the team generated and allowed that the team generated (i.e., Fenwick For/(Fenwick For + Fenwick Against). This is used as a proxy for shot quality and considers shot blocking a repeatable skill.
  • Expected Goals For percentage (xGF%) – This is a weighting placed on every unblocked shot based on the probability of the shot becoming a goal. This depends on the type of shot, location and uses historical shot and goals data to come up with the probability for each unblocked shot.
  • Goals For percentage (GF%) – The proportion of all the goals that the team scored and allowed that the team generated (i.e., Goals For/(Goals For + Goals Against).
  • Shooting percentage (SH%) – The percentage of the team’s shots on goal that became goals (i.e., total goals divided by the total shots on goal).
  • Save percentage (SV%) – The percentage of the team’s shots on goal against that were saved (i.e., 1-(totals goals allowed divided by the total shots on goal against).