After a bit of a slump in February, the Edmonton Oilers performed really well in the month of March, collecting 22 points in 15 games – a points percentage of 0.733 that ranked seventh-best in the league.
The club currently ranks second in the Pacific with a points percentage of 0.653 and eighth in the league. Their even-strength performance indicates that they’ll have positive results going forward. Their powerplay continues to be one of the best in the league. And the penalty kill isn’t costing them wins. All positive indicators heading down the stretch and into the playoffs.
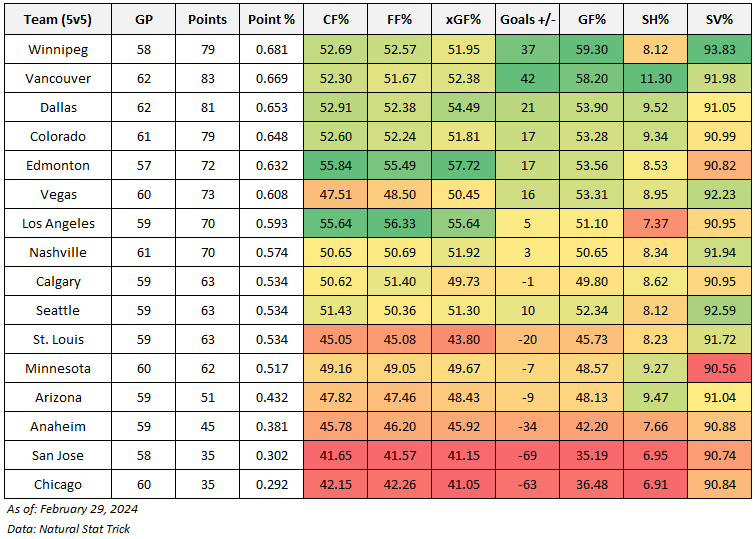
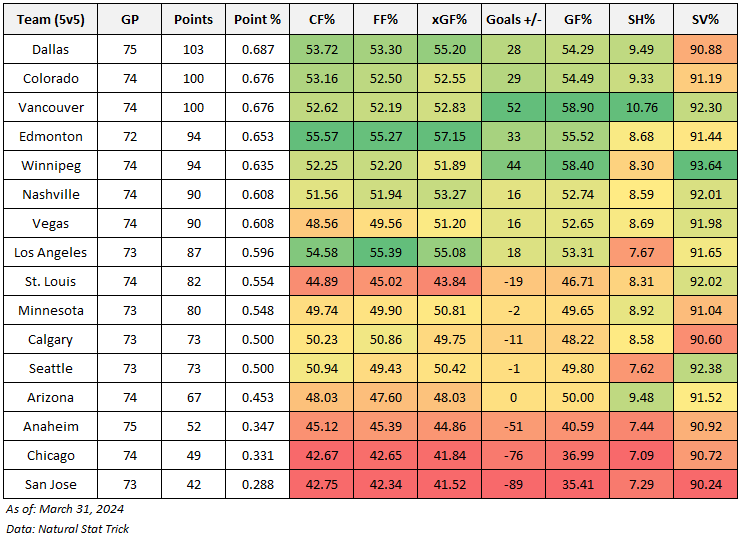
Below are the even-strength (5v5) numbers for each team in the western conference (sorted by points percentage), including goal-share results as well as the shot-share metrics that give us a sense of which teams have the right processes in place and if the results are sustainable or not. At the end of the table are each team’s shooting percentage and save percentage. I’ve also applied a basic heat map to each metric to show which teams are doing well or struggling relative to their conference foes (i.e., green is good, red is bad). You can also find a description of each metric at the end of this article. Please note that the shot-share metrics are score and venue-adjusted based on Natural Stat Trick’s methodology.
Edmonton continues to control the flow of play and scoring chances at even-strength (5v5), posting the third-best Corsi For percentage in the league and the best Expected Goals For percentage. McDavid is the obvious play-driver for the club, but the Oilers are also posting a 53 percent Corsi For percentage and Expected Goals share without him on the ice. The actual results (i.e., goal differential) does slide due to the lack of scoring talent in the bottom six and average goaltending, but there’s still plenty of optimism around the club.
Having said that, the rest of the western conference is looking really strong, especially compared to the east. The top end teams in the west are all posting great even-strength numbers, and look like legit contenders. Colorado, Dallas, Vancouver, Los Angeles, Winnipeg, and now Nashville, are all in the green in terms of shot-share numbers and goal differential.
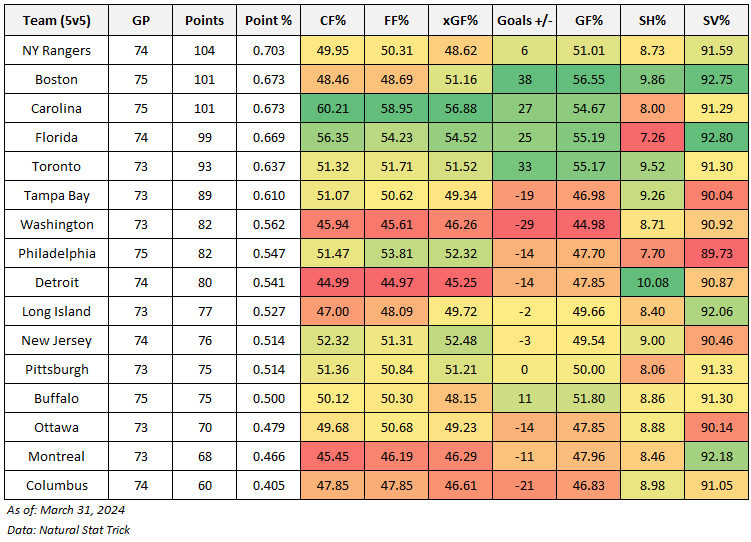
Compare that to the eastern conference where things are looking a little more wide open. The Rangers, while ranking first in the league, aren’t that great at even-strength, ranking below average when it comes to shot-share numbers and only have a 51% goal-share that ranks 14th in the league. Boston is also struggling to control the flow of play, so its difficult to have confidence in them even though they rank second. And three of the top eight teams in the east have a negative goal-differential at 5v5.
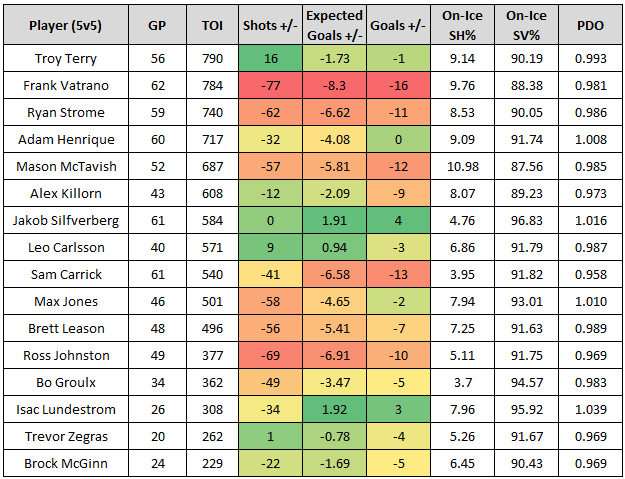
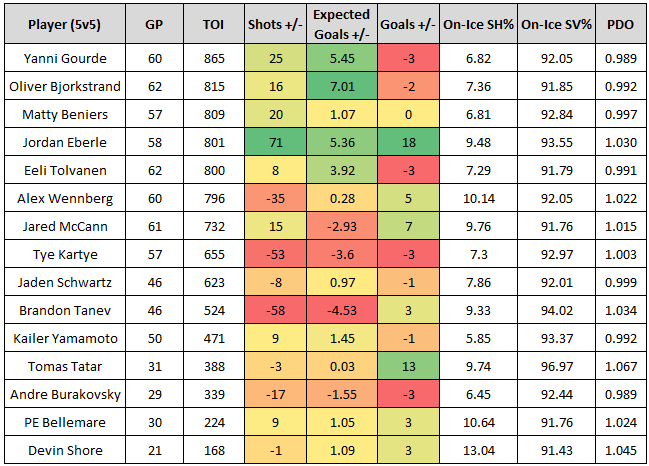
Back to the Oilers, and I wanted to see how the individual players have performed at even-strength since the trade deadline, and if there’s any areas for concern.

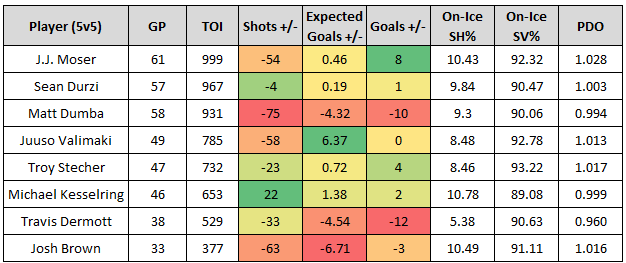
As mentioned, the top end of the roster continued to perform really well, and there’s no indication that their results should decline. It’s the rest of the roster that was a little unstable, especially the new trade deadline additions. Henrique as a center on the third line didn’t work very well, and has been spending more time as a winger on the second line, which has boosted his numbers. Carrick is basically what I was expecting, and isn’t even getting time on the penalty kill now. And Stecher has been so-so in the limited minutes he’s played. I can understand that it takes time for players to adjust to a new team and system, but that’s the risk of trade deadline acquisitions.
Also worth pointing out that while he’s been getting better results recently, Connor Brown’s on-ice shot-share numbers continue to be poor. The team allows a lot of chances with him on the ice, and I wouldn’t have a lot of confidence in his play in critical playoff games. He’s been given plenty of opportunities with an array of linemates now, and I do wonder if the team is better off with someone like Holloway or Gagner in the lineup than him.
Data: Natural Stat Trick