Quick check-in on the Pacific division with the NHL regular season currently suspended due to the pandemic.
Based on points percentage, the Edmonton Oilers have fallen to fourth in the Pacific division now trailing Calgary, Vegas and Anaheim. And they’re holding the second wild-card spot in the NHL’s official standings – only three points ahead of Los Angeles and Winnipeg.
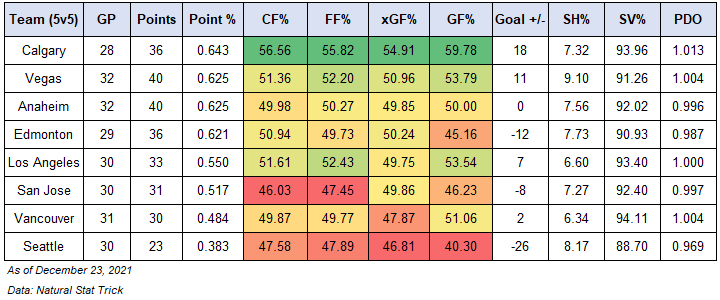
The table above contains the even-strength (5v5) numbers for each team in the Pacific division (sorted by points percentage) including goal-share results as well as the shot-share metrics that gives us a sense of which teams have the right processes in place and if the results are sustainable or not. I’ve also applied a basic heat-map to show which teams are doing well or struggling relative to their division foes. You can find a description of each metric at the end of this article. Also note that the shot-share metrics are score and venue adjusted based on Natural Stat Trick’s methodology.
Goal-differential (5v5)
What’s been apparent all season has been the Oilers poor goal-differential (i.e., Goal +/-) during five-on-five play, due in large part to their mediocre shot-share numbers combined with below average goaltending. Right now the Oilers are only better than Seattle when it comes to goal-differential and are being propped up by their excellent results on the powerplay and penalty kill.
While the other teams in the Pacific division like Vegas and Los Angeles are gradually figuring things out at five-on-five and trying to keep up with Calgary, the Oilers are continuing to flounder. Below is a graph showing each team’s cumulative goal-differential over the course of this season.

Couple notes:
- Calgary had a great start to the year, but have tapered off slightly – somewhat expected considering their goal-share was at 66% at the end of November with a PDO above 102. But we can expect the Flames to continue getting strong results considering their Corsi For% and Expected Goals For% have been excellent all season. That combined with strong goaltending, good special teams and a healthy roster should have them comfortably in a playoff spot.
- Vegas has really turned things around, due in large part to their improved shot-share numbers. When I last checked in November, they were posting a 48.88% Corsi For percentage and a 47.84% Expected Goals percentage. They’re now posting a 51.36% Corsi For pecentage and a 50.96% Expected Goals percentage – levels that we can expect to grow with their roster getting healthy and with one Jack Eichel expected to be in the lineup by season’s end.
- Los Angeles continues to do well at five-on-five, doing well when it comes to controlling the flow of play and posting the third best goal-share in the division. The problem is their penalty kill, which is allowing the 11th highest rate of goals against in the league and the powerplay which is scoring the eighth lowest rate of goals. Worth noting that Trent Yawney is the assistant coach running the penalty kill in Los Angeles, as his results in Edmonton weren’t great and he relied heavily on goaltending when running the penalty kill in Anaheim.
- Anaheim is very similar to Edmonton in that they’re also relying heavily on their powerplay, which ranks fifth in the league, and their penalty kill, which ranks third. But as I found in my last review, they’re not great at generating chances on the powerplay or preventing shots on the penalty kill, so I’m expecting their special teams to slip a bit. Regardless, they’re just breaking even at five-on-five for now but should see an uptick considering their Corsi For percentage had gradually been improving this season.
Depth
As we’re all well aware, the Oilers depth players have posted very poor five-on-five results and shot-share metrics this season with the team getting badly outshot and outscored when the star players haven’t been on the ice. For my own interest, and because we know how important depth is to playoff and championship aspirations, I also wanted to see how the Oilers roster compares against their division rivals.
For this exercise, I kept things simple and wanted to know how each team’s top lines have performed at five-on-five (using each team’s top forward in terms of total ice time as a proxy) and how well the team performed without their top line. On average, the top line plays about 30% of the team’s total even-strength (5v5) time. The top forwards from each team that I’ve identified are below, along with the percentage of their teams total 5v5 time that they’ve been on the ice for:
- C. McDavid (Edmonton) – 34.4%
- J. Gaudreau (Calgary) – 30.2%
- C. Stephenson (Vegas) – 28.2%
- A. Kopitar (Los Angeles) – 30.2%
- T. Hertl (San Jose) – 28.8%
- B. Horvat (Vancouver) – 30.5%
- A. Wennberg (Seattle) – 29.4%
- T. Terry (Anaheim) – 27.6%
Here’s how each team has done this season without their top line on the ice, sorted by goal differential (i.e., Goals +/-). I’ve included shot-share metrics and also applied a basic heat-map to show which teams are doing well or struggling relative to their division foes.
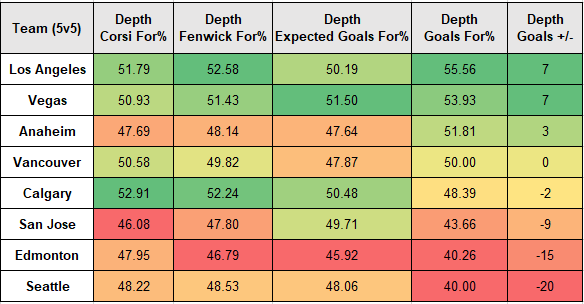
No surprise the Oilers results (i.e., goal-share) without McDavid are poor relative to the other Pacific division teams. But it’s especially concerning to see how poor the Oilers shot-share metrics are as well. They currently rank last in the Pacific when it comes to Expected Goals For percentage and Fenwick For percentage, both of which give us a proxy for scoring chances.
What’s also interesting to see is how the Oilers top line compares with the top lines of the other Pacific division teams. The Oilers results have been good, no doubt. But it’s nothing outstanding considering they’ve only posted a +3 goal differential with the top line on the ice, and their goal-share is nearly tied with Vegas and Vancouver.
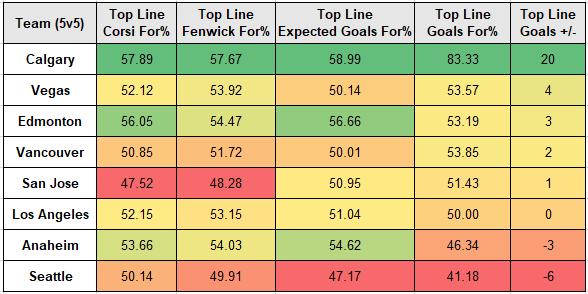
The good news is that the Oilers top line is posting some of the best shot-share metrics in the division with a Corsi For percentage and Expected Goals For percentage above 56% – so we should expect their results to improve. But that’s only if the goaltending gets better. Right now the Oilers have the third lowest team save percentage in the league at even-strength – something that’s probably a spot of bother for the current management group. They’re tried to improve goaltending every off-season but failed to land their targets. They were in on Markstrom two seasons ago (Source: Oilersnation) and had reportedly tried to acquire Darcy Kuemper this previous off-season (Source: Oilersnation). No doubt the team will try to address goaltending during the season to salvage the year, but it’s also worth addressing their depth and figuring out why they’re getting outshot so badly.
Whatever they do, there’s no way ownership should be pleased with these current results. They’ve paid a premium to bring in Holland and expectations remain high with McDavid and Draisaitl on the roster, healthy and in their primes. Management has spent considerable assets over the past few seasons now to address issues, but they’ve managed their cap and roster so badly that they’ve also limited their options to improve the roster in the short-term and long-term. The results speak for themselves and now the pressure is once again on the Oilers star players to secure a playoff spot.
Data: Natural Stat Trick
Glossary:
- Points-percentage (Point%) – The total points accumulated divided by the points that were available, including extra time.
- Corsi For percentage (CF%) – The proportion of all the shot attempts the team generated and allowed that the team generated (i.e., Corsi For/(Corsi For + Corsi Against). This is used as a proxy for possession and is the best at predicting a team’s future share of goals (GF%). (Source: Hockey Great Tapes – Draglikepull)
- Fenwick For percentage (FF%) – The proportion of all the unblocked shot attempts the team generated and allowed that the team generated (i.e., Fenwick For/(Fenwick For + Fenwick Against). This is used as a proxy for shot quality and considers shot blocking a repeatable skill.
- Expected Goals For percentage (xGF%) – This is a weighting placed on every unblocked shot based on the probability of the shot becoming a goal. This depends on the type of shot, location and uses historical shot and goals data to come up with the probability for each unblocked shot.
- Goals For percentage (GF%) – The proportion of all the goals that the team scored and allowed that the team generated (i.e., Goals For/(Goals For + Goals Against).
- Shooting percentage (SH%) – The percentage of the team’s shots on goal that became goals (i.e., total goals divided by the total shots on goal).
- Save percentage (SV%) – The percentage of the team’s shots on goal against that were saved (i.e., 1-(totals goals allowed divided by the total shots on goal against).

