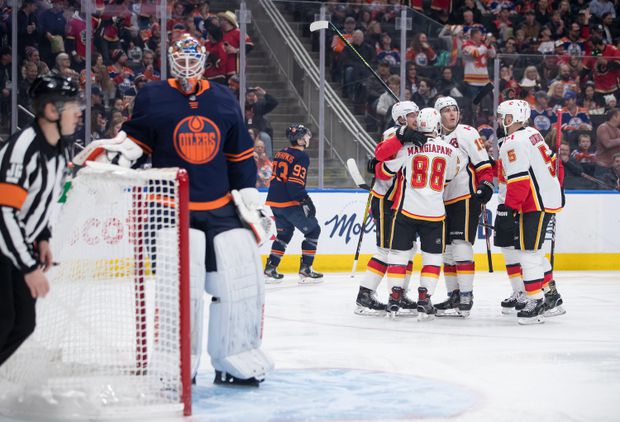
The Oilers are playing better on the road than at home this season, which is odd considering that on average over the last three seasons teams collected 60.7% of the available points (i.e., points percentage) when playing at home and 50.7% of the available points when on the road. This year, the Oilers have a 54.8% points percentage at home (21st in the league, fourth in the division) and a 57.7% points percentage on the road (10th in the league and second in the Pacific division). Below are the results for the season thus far, including their overall goal differential.
| 2019/20 | Games | Pts% | NHL Rank | Goal differential |
| Home | 21 | 54.8% | 21st | -10 (67 GF, 77 GA) |
| Away | 26 | 57.7% | 10th | +5 (75 GF, 70 GA) |
When asked at his media availability on Monday about the results at home as compared to on the road, Oilers head coach Dave Tippett provided this comment:
When you play on the road you play a simple direct style. You have to be all in. At home you tend to get fancy a little bit and maybe tend to try to put on a bit of a show for your fans. But the best show you can put on for your fans is for us to win.
On the road we’re generally playing a straight, disciplined game and that’s the kind of game, when we’re at our best, we play. We have to have that type of mindset wherever we play. It doesn’t matter. (Source)
Digging into the results a little deeper we start to see Tippett’s point about playing a more disciplined game on the road. Focusing first on even-strength (5v5) play, we see there’s been a drop off in terms of how well the team does in controlling the flow of play and their share of the shot attempts and scoring chances – metrics that are largely team driven.
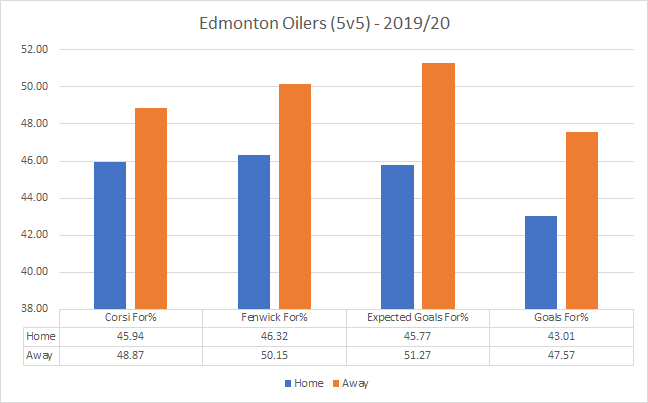
Starting with goal-share, we see that the Oilers even-strength play hasn’t been good overall, posting a negative goal differential both at home and on the road. Their 43.01% goal-share at home is the second worst in the league this season, while their 47.57% goal-share on the road is ranked 15th overall.
Looking at shot-share metrics, the Oilers do see an increase when they’re on the road, as their Corsi For% (a proxy for possession) and Fenwick For% (a proxy for scoring chances) see an uptick towards league average proportions when they’re on the road. And it’s a little alarming that all of their shot-share metrics at home rank in the bottom-five league-wide. Note that the league average shot-shares at home and on the road are right around 50.0% over the last three seasons. The odd team has seen a difference of 2.00 to 2.50 percentage points between their home shot-share compared to their road shot-share, but the difference for most teams is negligible.
This indicates to me that there’s definitely a team-wide issue that the coaching staff needs to address, as the Oilers are somehow managing to generate a slightly higher rate of scoring chances per hour and preventing more against when on the road.
| 5v5 | FF/60 | FA/60 | GF/60 | GA/60 |
| Home | 37.74 | 43.74 | 2.24 | 3.28 |
| Away | 40.37 | 40.12 | 2.44 | 2.45 |
What should be getting more attention is the significant drop in the team’s save percentage when the Oilers play at home. Currently, the Oilers goaltending at even-strength ranks 26th in the league with a save percentage of 90.86%. At home, that number drops to 89.78%, ranking 30th in the league. But on the road, for whatever reason, the Oilers goaltending ranks 14th with a save percentage of 91.76%.
The penalty kill is also where the goaltenders are really costing the Oilers wins at home. On the road, the goaltending has been excellent posting a save percentage of 92.74% – the best in the league. But at home, the save percentage ranks 22nd, with a save percentage of 85.86%. And it’s not like the Oilers penalty kill allows a lot more scoring chances against at home than on the road. In both situations, the Oilers allow close to league average rates.
| Penalty Kill | FA/60 | GA/60 | Sv% |
| Home | 75.22 | 7.52 (23rd) | 85.86% |
| Away | 73.86 | 3.96 (1st) | 92.74% |
If you look at all situations, the Oilers team save percentages goes from being the 29th ranked team with 88.38% at home to being the 5th ranked team on the road with 91.61%. This is definitely an area worth looking into and assessing how the goaltenders are managing themselves on the road versus at home.

Another thing to look into is the play of Leon Draisaitl at home versus on the road. Almost every player on the team sees a drop in their on-ice share of shots and scoring chances when the Oilers play at home, but Leon’s numbers are something else.
The Oilers tend to play a lot more without the puck when Draisaitl’s been on the ice this season, as his on-ice Corsi For% has been 45.31% – second worst among Oilers forwards, only ahead of Khaira. The team has also been out-scored 49-42 with Draisaitl on the ice, a goal-share of 46.15%.
It’s on home ice where his biggest struggles are, as the team has posted a goal-share of 41.38% with Draisailt on the ice. Goaltending is definitely a factor as noted above, but the team also controls only 41.98% of the shot-attempts and 41.73% of the scoring chances with him on the ice.
| Draisaitl (5v5) | CF% | FF% | xGF% | GF% | SH% | SV% | PDO |
| Home | 41.98 | 41.73 | 40.7 | 41.38 | 12.15 | 87.63 | 0.998 |
| Away | 48.11 | 48.28 | 49.84 | 51.21 | 10.27 | 91.43 | 1.017 |
Leon’s numbers improve significantly on the road, with the team posting a Corsi For% of 48.11% and a Fenwick For% of 48.28%. What’s driving the improved shot-share proportions is the team’s inability to suppress scoring chances against when Leon is on the ice, going from 54.15 unblocked shot attempts against at home (one of the worst rates in the league among regular forwards) to 43.45 on the road.
What’s also interesting to see is the negative impact Draisaitl’s been having on McDavid both at home and on the road, as the Oilers appear to be controlling the share of scoring chances just fine when the captain is on the ice with Draisaitl.
| Fenwick For% | McDavid and Draisaitl | McDavid without Draisaitl | Neither on the ice |
| Home | 41.45% | 55.53% | 47.82% |
| Away | 48.96% | 56.61% | 49.89% |
What’s really driving their poor on-ice shot-share numbers is their defensive play when deployed together. At home, they see a rate of 57.86 unblocked shot attempts against per hour – a significant jump from when they’re on the road posting a rate of 42.56 unblocked shot attempts against per hour.
What’s interesting is that it appears to be Draisaitl’s that’s causing the spike, as McDavid’s numbers without Draisaitl and the rest of the team without the two see similar rates of shots against whether at home or on the road.
| Fenwick Against/60 | McDavid and Draisaitl | McDavid without Draisaitl | Neither on the ice |
| Home | 57.86 | 38.99 | 38.26 |
| Away | 42.56 | 34.05 | 39.49 |
There’s definitely more to the Oilers struggles at home, but starting with the team’s overall play at even-strength, the goaltending and Draisaitl’s performance would be a good start. With the playoff race getting tighter in the Pacific, it would behoove the Oilers coaching staff and potentially management to uncover as many weaknesses and try to rectify them as soon as possible.
Data: Natural Stat Trick

Pingback: Addressing the goaltending | The SuperFan