One area of the club that has be driving the Oilers coaching staff crazy is the special teams.
While the powerplay has been solid, generating shots and ranking 9th in the league scoring 8.10 goals per hour, the penalty kill has been the complete opposite. The Oilers rank 29th in the league allowing 8.96 goals against per hour when shorthanded, and have gradually been allowing more and more shots and chances against over the course of the season – more on that in a second.
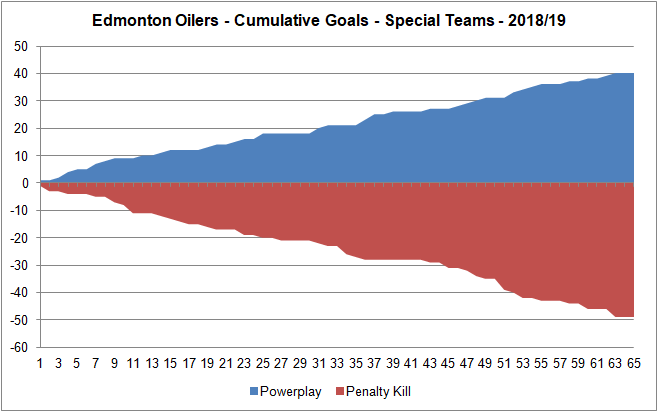
Simply put, any production from the powerplay has pretty much been off-set by the dreadful penalty kill. The Oilers have scored 40 goals on the powerplay, but allowed 49 on the penalty kill. The biggest problem has been the Oilers goaltending in penalty kill situations, which ranks dead last in the league with an 82.75% save percentage. Had the Oilers received league average goaltending in penalty kill situations (currently 86.07%), the team would have allowed nine fewer goals and would be slightly higher in the wild card standings.
Digging into things a bit, I found the shot-metrics for the powerplay and penalty kill interesting, as they’re both trending in very similar directions. Below are the rolling 20 game segments for the special team units – shots-for per hour for the powerplay and shots-against per hour for the penalty kill. Note that the league average rate for shots-for and against this season is 52.0.

Looking first at the rate of shots-for on the powerplay (blue line), you can see how the team started off well but took a hit when Klefbom was hurt in game 31 against the Avalanche in mid December. The Oiler’s low-point came in those first 20 games without Klefbom (generating just under 39 shots per hour), but unsurprisingly improved once Klefbom returned in game 53 against the Blackhawks in early February, with the team generating 64.4 shots per hour since his return. Any team would have an issue replacing Klefbom’s skill-set on a powerplay with four forwards and one defenceman, but the Oilers especially struggled trying to replace his minutes with guys like Nurse and Benning.
What’s especially interesting in the graph above is the rate of shots against on the penalty kill and how it closely mirrors the rate of shots-for on the powerplay. While we can attribute the improved powerplay shots-for rate to Klefbom’s return, I’m not entirely sure what could have caused the spike of shots against shorthanded and why it’s so aligned with the powerplay shots-for numbers. Definitely something worth asking the coaching staff about.
One thing I’d look into is potentially scaling back Kris Russell’s minutes on the penalty kill. Over the last 20 games where the team has been allowing a rate of 60.7 shots against per hour and a goals against rate of 10.41 – both of which being one of the league’s highest – Russell has seen his total ice time (44:37) and ice time per game (2:22) gradually increase on the penalty kill, currently leading all defencemen. In the 20 games prior when the team was doing well on the penalty kill, allowing 50.7 shots against per hour and 7.1 goals against per hour, Russell had missed 10 games due to injury and only played about 14 minutes on the penalty kill (averaging under one and a half minutes per game). In those limited minutes, Russell was extremely poor, posting an on-ice shots against rate of 77.23 (!) and a goals against rate of 12.87 – both rates being the team’s worst among defencemen on the penalty kill.
| Oilers | Dec. 1, 2018 to Jan. 12, 2019 | Jan. 13, 2019 to Mar. 2, 2019 | ||||||||
| Player | GP | TOI | TOI/GP | SA/60 | GA/60 | GP | TOI | TOI/GP | SA/60 | GA/60 |
| Larsson | 20 | 44.25 | 2.21 | 50.17 | 6.78 | 20 | 40.77 | 2.04 | 50.04 | 10.30 |
| Manning | 3 | 1.25 | 0.42 | 0.00 | 0.00 | 9 | 12.58 | 1.40 | 76.29 | 9.54 |
| Jones | 13 | 10.47 | 0.81 | 63.06 | 11.46 | 4 | 8.60 | 2.15 | 27.91 | 6.98 |
| Nurse | 20 | 39.32 | 1.97 | 48.83 | 10.68 | 20 | 39.10 | 1.96 | 69.05 | 10.74 |
| Garrison | 5 | 6.65 | 1.33 | 36.09 | 9.02 | 0 | 0.00 | 0.00 | 0.00 | 0.00 |
| Gravel | 18 | 31.60 | 1.76 | 53.16 | 1.90 | 7 | 12.52 | 1.79 | 62.32 | 9.59 |
| Russell | 10 | 13.98 | 1.40 | 77.23 | 12.87 | 20 | 44.37 | 2.22 | 68.97 | 10.82 |
| Benning | 17 | 25.67 | 1.51 | 39.74 | 7.01 | 16 | 16.08 | 1.01 | 52.23 | 11.19 |
| Klefbom | 6 | 8.80 | 1.47 | 47.73 | 0.00 | 13 | 23.38 | 1.80 | 71.85 | 10.26 |
| Sekera | 0 | 0.00 | 0.00 | 0.00 | 0.00 | 7 | 8.05 | 1.15 | 29.81 | 14.91 |
I wouldn’t say Russell’s the sole reason for the penalty kill gradually getting worse, but he’s one of the factors that the team should probably address. Considering how many goals (and wins) their penalty kill has cost them, it’d be imperative for the Oilers coaching staff to critically examine their tactics and player deployment, and make the necessary changes.
Data: Natural Stat Trick

Pingback: Drivers and anchors on the penalty kill | The SuperFan