Jordan Eberle is in a bit of a funk right now. After 37 games, the winger is tied for third on the team with 25 points (8 goals, 17 assists), but the majority of those points have come on the powerplay, as he only has 12 points at even-strength. Considering his history, and that he’s getting top six minutes with the best players on the team, his production should be much higher.
Since players don’t get the same amount and quality of ice time (i.e., some get more offensive opportunities than others), we can look at how efficient a player is at getting points in the time that they get. When it comes to points per 60 minutes of even-strength ice time, Eberle currently ranks 11th among 15 forwards on the team who have played at least 100 minutes this season with 1.40.
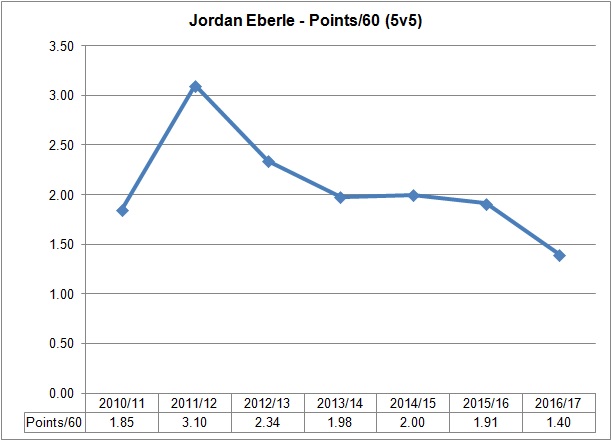
| Season | GP | TOI | G | A | P | Points/60 |
| 2010/11 | 69 | 941.31 | 12 | 17 | 29 | 1.85 |
| 2011/12 | 78 | 1044.52 | 23 | 31 | 54 | 3.10 |
| 2012/13 | 48 | 693.51 | 12 | 15 | 27 | 2.34 |
| 2013/14 | 80 | 1151.03 | 17 | 21 | 38 | 1.98 |
| 2014/15 | 81 | 1228.93 | 18 | 23 | 41 | 2.00 |
| 2015/16 | 69 | 972.86 | 16 | 15 | 31 | 1.91 |
| 2016/17 | 37 | 514.04 | 3 | 9 | 12 | 1.40 |
Looking at his career numbers, we see that 1.40 points per 60 is well below his expected level. Since entering the league, Eberle has regularly finished in the top three on the Oilers when it comes to this metric, so it’s pretty odd to see him ranked so low.
Knowing his individual production is off, we can next look at how the Oilers as a team have done with and without Eberle this season. Below are the five metrics I’ll be using.
- Corsi For% (CF%) – The proportion of all the shot attempts the team generated and allowed that the Oilers generated (i.e., Corsi For/(Corsi For + Corsi Against). This is used as a proxy for possession and can predict a team’s future share of goals.
- Fenwick For% (FF%) – The proportion of all the unblocked shot attempts the team generated and allowed that the Oilers generated (i.e., Fenwick For/(Fenwick For + Fenwick Against). This is used as a proxy for shot quality and considers shot blocking a repeatable skill. It can also predict a team’s future share of goals, slightly better than Corsi.
- Scoring Chances For% (SCF%) – The proportion of all the scoring chances (as defined by Corsica Hockey) that the team generated and allowed that the Oilers generated (i.e., Scoring Chances For/(Scoring Chances For + Scoring Chances Against),
- Expected Goals For% (xGF%) – This is a weighting placed on every unblocked shot based on the probability of the shot becoming a goal. This depends on the type of shot, location and uses historical shot and goals data to come up with the probability for each unblocked shot. This has been found to be a better predictor of future goals than Corsi and Fenwick. (Detailed explanation can be found at Corsica Hockey)
- Goals For% (GF%) – The proportion of all the goals that the team scored and allowed that the Oilers generated (i.e., Goals For/(Goals For + Goals Against).
Here’s how the team has done across those five metrics with and without Eberle this season.
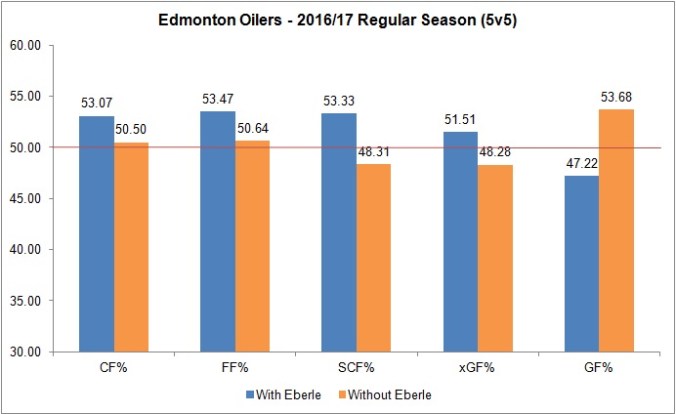
Here we see that across four of the five metrics, the Oilers are a better team with Eberle than without him. For instance, of all the shot attempts (i.e., Corsi) that happen, for and against, the Oilers get 53.07% of them with Eberle on the ice, but that number drops to 50.50% when he’s on the bench. The problem for Eberle is that when it comes to the team’s share of goals, the Oilers are currently taking a hit as they’ve been outscored 17-19 (a goal-share of 47.22%) when he’s on the ice. When he’s on the bench, the team has outscored the opponents 51-44 (a goal share of 53.68%).
Goals, and the share of all the goals, are obviously the most important thing, but they don’t do a good job of predicting future goals. That’s why we look at the shot share (i.e., Corsi/Fenwick) as well as the team’s share of expected goals. The team is outshooting opponents with Eberle on the ice and are getting more quality shots, so we can hope that the actual goal-share will eventually start to align with the metrics that predict future outcomes.
What’s also worth looking into is the effect McDavid is having on Eberle’s numbers and if the team numbers with Eberle on the ice are being driven by the captain. Of Eberle’s 514 minutes of ice time, he’s been with McDavid for 302 mins this season, with Lucic as their regular line mate.
We can look at each of the five team-level metrics again and see how the Oilers have done when Eberle and McDavid have been together, and how the team has done when they’re away from each other.
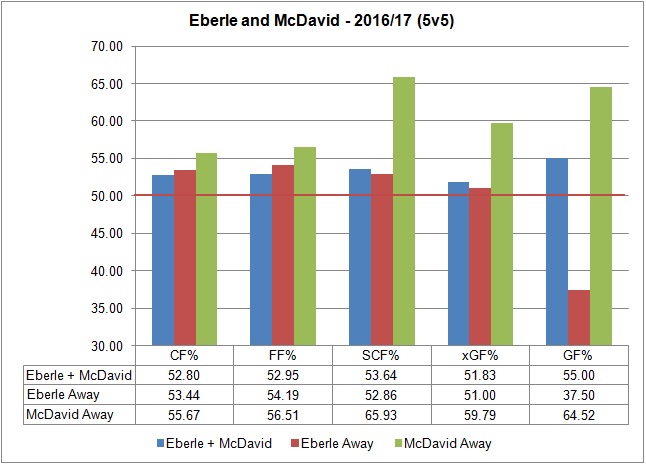
Here we see that McDavid and Eberle have done well when it comes to the team’s shot-share and expected goals together, and the team is getting a higher share of the goals when they’re on the ice together. When Eberle is away from McDavid, the team’s share of shots and scoring chances stay at about the same level, still over 51% for four of the five metrics, so it doesn’t appear Eberle is completely dependent on the captain when it comes to the predictive metrics.
When McDavid is away from Eberle, the team’s share of shot attempts moves from 52.80% to 55.67% and expected goals takes a big jump from 51.83% to 59.79%. What stands out the most is that the goal share jumps up to 64.52%. I wouldn’t consider this a knock on Eberle though, as away from McDavid, the team-level predictive metrics are still at an acceptable level. We have to consider the fact that Eberle’s second most common centerman is RNH, who regularly sees the other team’s top lines and is tasked with more defensive responsibilities.
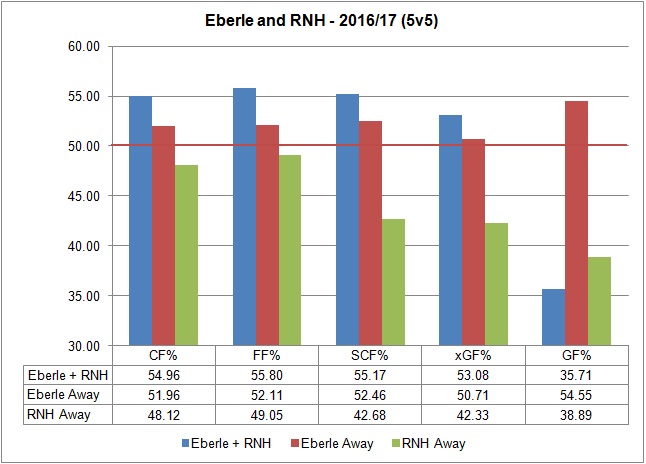
For reference, here’s how Eberle has done with and without RNH this season. Eberle’s numbers away from RNH will be higher for the simple fact that McDavid is the better centerman.
The takeaway from the team-level predictive metrics (shot attempts and expected goals) is that Eberle has not been a drag on the things that should lead to be better outcomes (i.e., goals). With McDavid, without McDavid, with RNH, without RNH, the team gets a good proportion of the shot attempts, scoring chances, and higher quality shots with Eberle on the ice.
So why aren’t the goals coming?
This is where we need to look at the individual player’s shot data to see if anything stands out. In particular, his individual shot rate (i.e., shots on goal per 60), the type of chances, the distance of his shots from the goal and the shooting percentage (i.e., what percentage of his shots turn into goals) should be reviewed.
This season, Eberle is shooting at about the same rate as previous years, generating 7.70 shots on goal per 60 minutes of ice time. So it’s not like he’s getting the puck less this year or that McDavid is taking the bulk of the shots. Eberle typically ranks in the top three among Oiler forwards year-over-year, with this season being no different.

Next, we can see Eberle’s rate of expected goals for per 60 this season compared to previous years. As mentioned above, this is a weighting placed on every unblocked shot based on the probability of the shot becoming a goal. This depends on the type of shot, location and uses historical shot and goals data to come up with the probability for each unblocked shot. For reference, I’ve included Eberle’s actual goals per 60 for each season (red line).
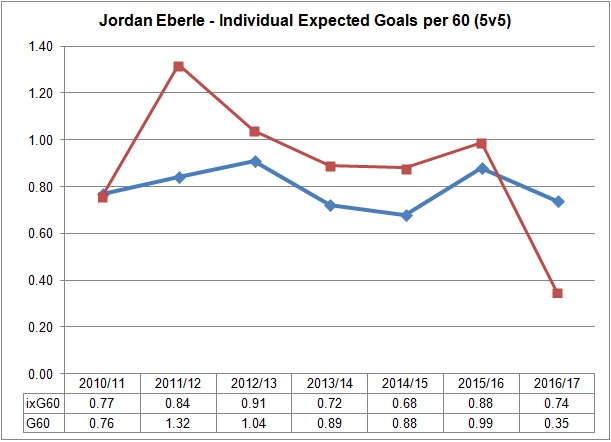
Here we see that Eberle is currently at 0.74 individual expected goals for per 60, which is lower than last season, but around his career average of 0.79. So he himself is getting the same quality shots as he has in the past. His actual goals for per 60 are typically close to the expected number, with 2011/12 and this season being an anomaly.
We can also look at the average distance of his shots on goal from the net. (Link: Rink map with measurements)
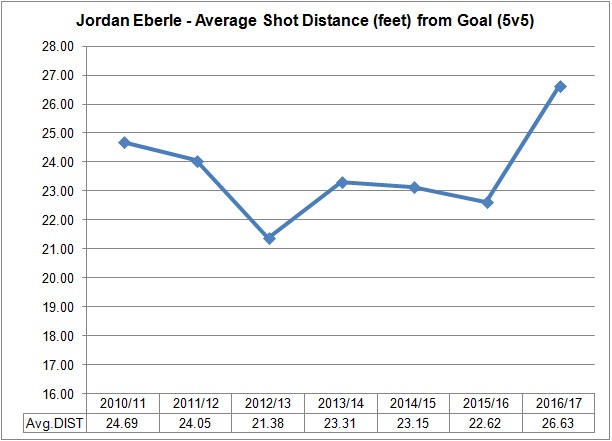
Here we see that his shots, on average, are about four feet farther away from the goal this season. It’s hard to say why, but he is still getting shots from in close, and ranks 4th on the team behind McDavid (22.00 feet), Maroon (23.36) and Draisaitl (24.62).
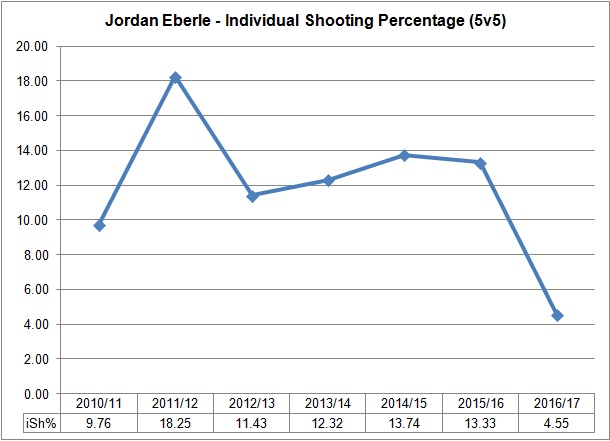
So Eberle is currently getting the same rate of shots on goals and about the same level of quality shots. The issue for Eberle this season is that the shots he’s taking aren’t turning into actual goals, as he’s sitting at a meager 4.55% shooting percentage. That’s far, far below his career numbers, as he typically converts over 10% of his shots into goals. We can also see here that the spike in his shooting percentage in 2011/12 was the reason for his actual goals for per 60 being above the expected levels.
Players don’t typically maintain the same level of shooting percentage over the course of an entire season, and Eberle is no different. Looking at his rolling 25-game average shooting percentage over his career, we see that he goes through some highs and lows, but things eventually balance out. (Source: Corsica Hockey)

What’s interesting here is that his shooting percentage typically trends downwards over the first half of the season, but gradually improves over the second half. The current trend (on the far right) is approaching some career lows, but if Eberle’s history is any indication, his shots will turn into goals more frequently over the remaining 45 games.
The key for Eberle will be to maintain his current rate of shots, and continue contributing to his team’s ability to out-shoot opponents at even-strength. We know he’s capabale of contributing offensively, and it should be a matter of time before he starts converting on more of his shots.
One last thought: I would strongly consider moving Eberle away from McDavid and pairing him with RNH more frequently. In my opinion, Eberle will start producing and it could potentially have a positive impact on RNH who is also struggling with a terrible individual and on-ice shooting percentage. Both players have a history of success together, and could be a very good second line behind McDavid. The big issue for the club is that without McDavid on the ice, the team’s goal share drops to below 50%. If we are to believe that Eberle will start converting on more shots, it would be ideal that it happens when it’s away from McDavid who can generate chances and goals on his own.
Data: Corsica Hockey
