Jordan Eberle is in a bit of a funk right now. After 37 games, the winger is tied for third on the team with 25 points (8 goals, 17 assists), but the majority of those points have come on the powerplay, as he only has 12 points at even-strength. Considering his history, and that he’s getting top six minutes with the best players on the team, his production should be much higher.
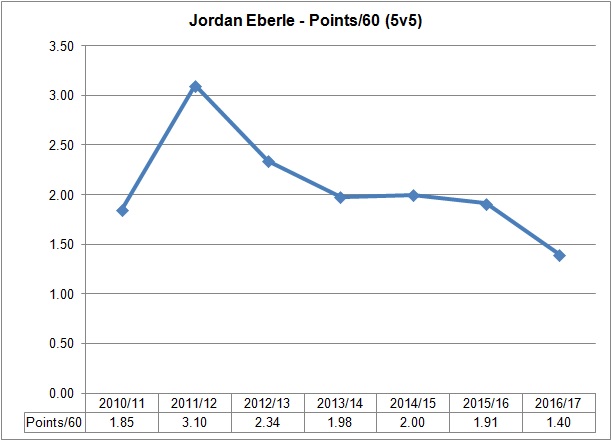
Since players don’t get the same amount and quality of ice time (i.e., some get more offensive opportunities than others), we can look at how efficient a player is at getting points in the time that they get. When it comes to points per 60 minutes of even-strength ice time, Eberle currently ranks 11th among 15 forwards on the team who have played at least 100 minutes this season with 1.40.
| Season | GP | TOI | G | A | P | Points/60 |
| 2010/11 | 69 | 941.31 | 12 | 17 | 29 | 1.85 |
| 2011/12 | 78 | 1044.52 | 23 | 31 | 54 | 3.10 |
| 2012/13 | 48 | 693.51 | 12 | 15 | 27 | 2.34 |
| 2013/14 | 80 | 1151.03 | 17 | 21 | 38 | 1.98 |
| 2014/15 | 81 | 1228.93 | 18 | 23 | 41 | 2.00 |
| 2015/16 | 69 | 972.86 | 16 | 15 | 31 | 1.91 |
| 2016/17 | 37 | 514.04 | 3 | 9 | 12 | 1.40 |
Looking at his career numbers, we see that 1.40 points per 60 is well below his expected level. Since entering the league, Eberle has regularly finished in the top three on the Oilers when it comes to this metric, so it’s pretty odd to see him ranked so low.
Knowing his individual production is off, we can next look at how the Oilers as a team have done with and without Eberle this season. Below are the five metrics I’ll be using.
- Corsi For% (CF%) – The proportion of all the shot attempts the team generated and allowed that the Oilers generated (i.e., Corsi For/(Corsi For + Corsi Against). This is used as a proxy for possession and can predict a team’s future share of goals.
- Fenwick For% (FF%) – The proportion of all the unblocked shot attempts the team generated and allowed that the Oilers generated (i.e., Fenwick For/(Fenwick For + Fenwick Against). This is used as a proxy for shot quality and considers shot blocking a repeatable skill. It can also predict a team’s future share of goals, slightly better than Corsi.
- Scoring Chances For% (SCF%) – The proportion of all the scoring chances (as defined by Corsica Hockey) that the team generated and allowed that the Oilers generated (i.e., Scoring Chances For/(Scoring Chances For + Scoring Chances Against),
- Expected Goals For% (xGF%) – This is a weighting placed on every unblocked shot based on the probability of the shot becoming a goal. This depends on the type of shot, location and uses historical shot and goals data to come up with the probability for each unblocked shot. This has been found to be a better predictor of future goals than Corsi and Fenwick. (Detailed explanation can be found at Corsica Hockey)
- Goals For% (GF%) – The proportion of all the goals that the team scored and allowed that the Oilers generated (i.e., Goals For/(Goals For + Goals Against).
Here’s how the team has done across those five metrics with and without Eberle this season.
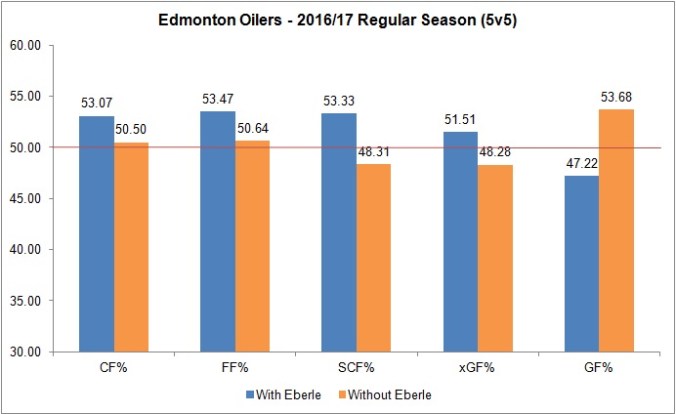
Here we see that across four of the five metrics, the Oilers are a better team with Eberle than without him. For instance, of all the shot attempts (i.e., Corsi) that happen, for and against, the Oilers get 53.07% of them with Eberle on the ice, but that number drops to 50.50% when he’s on the bench. The problem for Eberle is that when it comes to the team’s share of goals, the Oilers are currently taking a hit as they’ve been outscored 17-19 (a goal-share of 47.22%) when he’s on the ice. When he’s on the bench, the team has outscored the opponents 51-44 (a goal share of 53.68%).
Goals, and the share of all the goals, are obviously the most important thing, but they don’t do a good job of predicting future goals. That’s why we look at the shot share (i.e., Corsi/Fenwick) as well as the team’s share of expected goals. The team is outshooting opponents with Eberle on the ice and are getting more quality shots, so we can hope that the actual goal-share will eventually start to align with the metrics that predict future outcomes.
 The Oilers rank 10th in the league, sitting at a PDO of 100.32. Team save percentage (92.55%) and team shooting percentage (7.76%) are right around the league average. When Eberle is on the ice, the team save percentage stays the same, right at 92.72%. The shooting percentage on the other hand, takes a dip with Eberle on the ice, dropping down to 6.04%. Eberle’s personal shooting percentage (the proportion of his own shots that turn into goals) at 5v5 is sitting at 4.84%, a significant drop from his career shooting percentage prior to this season, which sits at 13.19%.
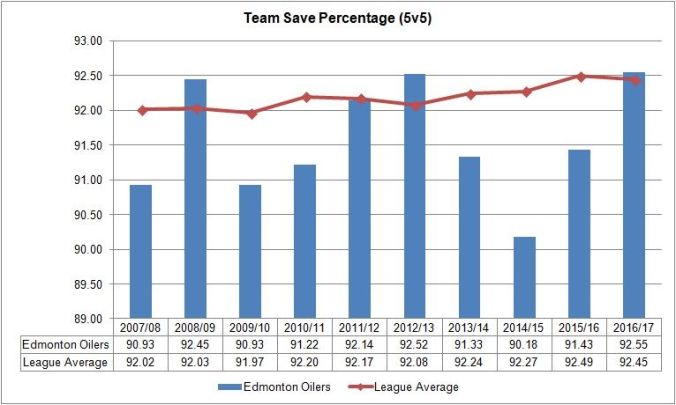
/cdn0.vox-cdn.com/uploads/chorus_asset/file/7693289/McDavid.jpg)