Looking for Positives from the 2015/16 Season

Recently I’ve been digging into the team’s overall possession numbers, as well as other metrics, trying to find some positive signs from the 2015/16 season. My expectations going into the season were high considering the success Todd McLellan has had in the past when it comes to possession, but those expectations were tempered knowing that the roster had major deficiencies and the amount of injuries the club had to deal with. What I’ve found so far is that even though the team  mustered less than 50% of the total shot attempts at even-strength this past season, the club did remain rather consistent, hovering around 20th place in the league through the whole season. I consider this progress as the Oilers have historically posted brutal possession numbers and would typically trend downwards as the season wore on.  It’s also worth noting that for the first time in over seven seasons, the Oilers posted a 25-game stretch where the team Corsi For% was over 50%.

What I’ve also found using rolling 25-game averages is that even though the team steadily declined in their share of shot attempts near the end of the season, the club actually improved, rather nicely, over the course of the season when it came to expected goals (xGF). This metric, available at Corsica Hockey, takes into account the quality of shots, including the type of shot, the distance from where it was taken, whether it was a rush shot or a rebound, and from what angle it was taken from. You can read more about the expected goals methodology at Corsica Hockey. Please note that the Corsi and expected goals data has been adjusted to account for score, zone and venue.

For my own verification, I also looked into War on Ice’s scoring chance data and high danger scoring chance data (adjusted for score), two metrics that expected goals takes into account along with other factors. Looking at the rolling 25-game averages, I found that the Oilers gradually improved when it came to the rate at which scoring chances and high danger chances were generated this season.

Full article is at The Copper & Blue.

Brandon Davidson’s Impact on the Oilers Possession Numbers

In my last post I dug a little deeper into a stretch of twenty-five games from January to March where the Oilers posted, for the first time in over seven seasons, a Corsi For% over 50%. What I found was that the coaching staff had actually reduced the ice time of one Lauri Korpikoski during that stretch, which may have played a role in the team’s overall performance when it comes to possession. As we know Korpikoski has been one of the league’s worst possession players and has a history of dragging down the performance of linemates.

Now if we look at the actual rate of shot attempts for and against in rolling 25 game averages, we see that the team was actually suppressing shots poorly for most of the season, improved  over that 25-game stretch from January to March, and then cratered late in the season (Source: Corsica Hockey). This indicated to me that something might have happened on the blueline and was worth looking at again in terms of deployment during the stretch of 25-game where they had a Corsi For% over 50, and the games after it.

Below is each defencemen’s proportion of ice time during the course of the season, which is available at Hockey Viz. I’ve added the vertical red bars to show where the Oilers had a Corsi For% over 50% and highlighted young Brandon Davidson’s line.

Full article is at The Copper & Blue.

Digging into the 25-game Stretch When the Oilers Had Decent Possession Numbers

In my last post, I looked at how the Oilers did possession wise in 2015/16 and found that the Oilers improved from last season and avoided any sort of drop off over the course of the season. The team finished 20th in the league with 48.71% Corsi For (adjusted for score state, venue and zone by Corsica Hockey), which is still sub-par, but demonstrated some progress.

What’s also worth noting is that for the first time in over seven seasons, the Oilers had a stretch of 25 games where their Corsi For% was over 50%. I’m not declaring that the rebuild is over, but it’s a good sign nonetheless.

Between January 10th and March 4th, 2016, which were games 43-67, the Oilers posted a 50.9% share of all shot attempts at even-strength. The club also saw a bump in their share of goals, reaching 48.3% during those 25 games, but unfortunately only mustered eight wins in that stretch. Team shooting percentage at even-strength went up slightly from 7.1% up to 8.2% in that “streak”, but the Oilers team save percentage stayed around their season long average of 91.5%.

Prior to January 10th, 2016, the Oilers played in 42 games and had an adjusted CF% of 47.9%. That number moved up in the next 25 games to 50.9%, but then dropped to  47.3% over the remaining 15 games. The same trend happened with the Oilers share of unblocked shot attempts and shots on goal. The team’s share of goals was the most significant as the team reached 48.3% over their 25 game stretch, and were far below that before and after that stretch. I want to believe that the Oilers were doing something right between games 43 and 67, so I figured it’d be worth digging into player deployment.

Full article is at The Copper & Blue.

Don’t Worry, Be Corsi: The Oilers Have Shown Signs of Improvement This Season

Despite the Oilers poor effort at home against the Flames on Saturday night, the team has shown some signs of life this season. It’s easy to point out the individual flaws and the decade of bad hockey in Edmonton. But we can’t overlook what this current group of players has accomplished this season under new management and a new coaching staff.

Now lets be real for a minute. This is a 30th place team. But a lot of it has to do with the injuries to key players. It has to do with poor roster construction which management did not address over the summer. And it has to do with games like the one this past weekend, where weaknesses, like the defence and special teams, get exposed. But before we trade everyone away this summer, it’s worth looking at the overall team performance and compare it to previous seasons.

An important metric worth including in our regular assessments of the club is Corsi, which has been used as a proxy for possession. The metric tells us which teams are spending more time in the offensive zone, and we’ve learned that over time outshooting eventually leads to outscoring (Sources: Objective NHLNHL Numbers)

What we can also do, thanks to Corsica Hockey, is adjust Corsi to take into account things like score effects, team and player zone starts and venue (since home teams tend to get their shot attempt counts inflated). This way we can get a much more accurate assessment of a teams performance when it comes to possession and have a lot more confidence when comparing teams.

Full article is at The Copper & Blue.

Thoughts on Yakupov + Radio Spot

It’s hard not to be a fan of Nail Yakupov. He’s young, talented and has an excitement for the game that’s easy to support.

And what I think really expedited and really amplified the support for Yakupov was the unfair treatment he received very early in his NHL career. Around the World Juniors tournament, Canadian writers were quick to critique Yakupov for not being accessible, openly questioning his character and professionalism. On top of that, there was plenty of speculation on draft day that the Oilers’ scouts didn’t want Yakupov. So fans had a player in front of them that wasn’t liked by Edmonton based sports writers AND he wasn’t wanted by the Oilers. How could you not love Yakupov at this point?!

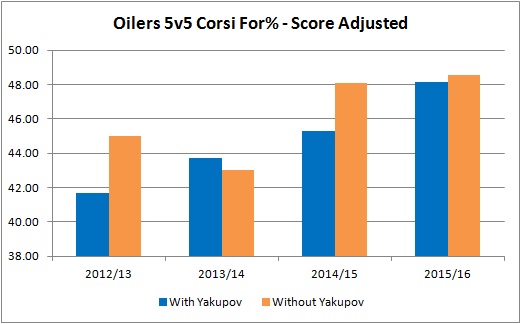
Unfortunately, over the past four years, Yakupov hasn’t produced at an acceptable level. He has never put up a good level of point production at  even-strength, with the Oilers often doing better possession-wise when Yakupov is on the bench (Source: War on Ice)

YakupovCF

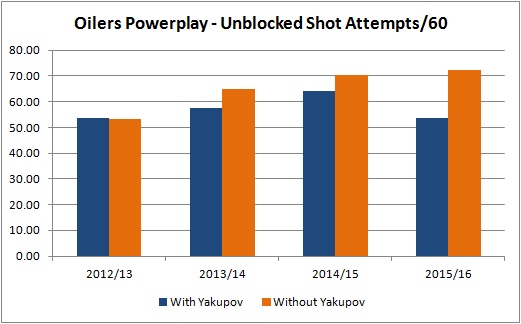
The other problem for Yakupov has been his performance on the powerplay. Looking at just the team’s generation of unblocked shot attempts (i.e., Fenwick For/60), which is a good predictor of powerplay success, we see that when Yakupov has been on the ice, he’s typically been either near or below the overall team average. (Source: Hockey Analysis). This just isn’t good enough for someone that has offensive ability.

YakupovPPFF60

We also know that the Oilers never really surrounded Yakupov, or any of their prospects for that matter, with reliable, experienced players who could provide rookies with on-ice guidance and mentorship. Since joining the league, Yakupov’s five most common centermen at 5v5 have been Sam Gagner (596:14), Derek Roy (534:15), Ryan Nugent-Hopkins (426:05), Mark Arcobello (296.34) and Mark Letestu (215:51). (Source: Hockey Analysis). 

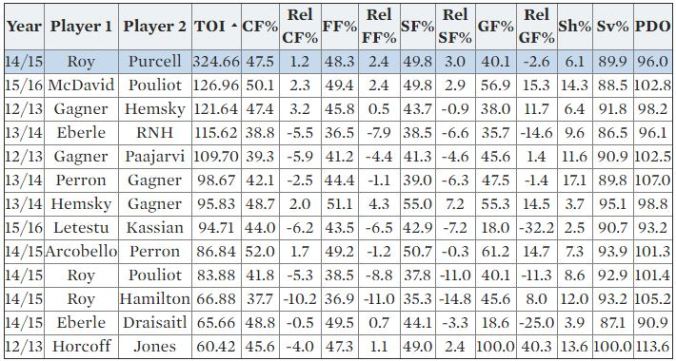
I also compiled a a table containing all of the line combinations Yakupov has been a part of for more than 60 minutes at 5v5 since his rookie season. (Source: Corsica Hockey)

Yak Lineys

If you’re interested, I dug into these line combinations a bit more over at The Copper & Blue.

Couple other things:

I find it pretty amusing that the voting results among the Oilers scouts has been made public. You always have to take a grain of salt with this type of journalism. But I’d be interested in seeing what the results were among the Oilers staff when it came to selecting Mitch Moroz at 32nd overall in the same draft as Yakupov. While we’re at it, why not dig into the Oilers scouting staff’s Taylor vs Tyler vote? Maybe when the information will sell papers, we’ll get access to it.

And let’s not kid ourselves: Yakupov was viewed as a number one pick by hockey scouts and insiders. From Bob McKenzie in June 2012:

..Yakupov has been the more or less undisputed top prospect this year from wire to wire, ranked No. 1 in TSN’s pre-season (mid-September), mid-season, (late January), draft lottery (early April) and final (late May) rankings.

Of the 10 scouts surveyed by TSN for its final rankings, eight pegged Yakupov as the top prospect. Everett Silvertip defenceman Ryan Murrayand Yakupov’s linemate, centre Alexander Galchenyuk, were the only other prospects to get a No. 1 ranking. Each had one.

There’s going to be a lot of crap written about Yakupov over the next few weeks and into the summer and probably well after Yakupov is traded away. The key thing to remember is it’s going to be the same group of Edmonton based writers who chase page clicks and rely on sensationalistic journalism to draw readers. I think we’re lucky to have some very good writers that cover the Oilers, but we have to take some of the crap content at times.

We can’t overlook the fact that Yakupov has worked extremely hard to make it to this point. It’s unfortunate that the Oilers didn’t provide the right environment for him or even considered returning him to junior or loaning him to the KHL knowing full well that he was a one dimensional player on draft day. Instead, we’re left with a cautionary tale (the Oilers have become masters at these) about the importance of development and setting realistic expectations for prospects. It’s my hope that Yakupov finds a new home this summer, is given some quality linemates and coaching, and has reasonable, recalibrated expectations placed upon him.

Shawn Horcoff Plays in His 1,000th NHL Game

Originally published on The Copper & Blue.

20101006_horcoff

This past Thursday night, former Oilers captain Shawn Horcoff played in his 1,000th NHL game, a milestone that only 301 players in the history of the NHL have reached before him.

Since being drafted in the fourth round by the Oilers in 1998, 99th overall, Horcoff has notched 509 points, which ranks him 10th in his draft class. 447 of those points were with the Oilers, where he also played in 35 playoff games, scoring 23 points.

Following his tenure with the Oilers, Horcoff played with the Dallas Stars where he scored 20 points as a depth player in 2013/14, and lead the roster in playoff points that spring. He followed this up with a 29 point campaign in Dallas, ranking sixth on the team in points per 60 at even-strength. This season, Horcoff has notched 13 points in 51 games for the Ducks, and has played significant minutes on the penalty kill, which ranks number one in the league.

The 37-year-old is nearing retirement, but is still providing good prouduction as depth player. His time with the Oilers was often criticized because of his contract, but his effort level and contributions on-the ice cannot be overlooked.

Congrats to Shawn Horcoff on a significant milestone. And all the best in the playoffs this season.


Checking in on Mark Fayne

FaynexGA60Rolling25At the start of the season, it appeared all hope was lost for defenceman Mark Fayne. He was clearly struggling with the new system, as foot speed and reaction time appeared to be an issue. His numbers reflected it, as the shot attempts against and the shots on goals against often increased when Fayne was on the ice. This translated into a higher expected goals against/60, which factors in shot type, distance and angle, and if the shot was a rush shot or a rebound. More on how shot quality is calculated can be found at Corsica Hockey.

Here’s how the most common Oilers defenceman did as of December 9th, 2015, the day that Fayne was demoted to Bakersfield. I looked into the defensive rates (i.e. “per 60”) metrics: shot attempts against (CA/60), unblocked shot attempts against (FA/60), shots on goal against (SA/60) and expected goals against (xGA/60). Please note that the stats are score, zone and venue adjusted, based on Corsica Hockey’s methods, to give a more accurate assessment of player performance. Tables are sortable.

Full article is at The Copper & Blue.

Oilers Performance When Trailing and When They’re Leading

Earlier this week, I looked into how the Oilers have done this season when they have a one goal lead. I was at the Nashville game and watched the team blow two one-goal leads and eventually lose the game. The majority of the chatter online and on the radio afterwards was about the goaltending and Laurent Brossoit’s poor play. But when I dug a little deeper, I found that the Oilers as a whole absolutely crater when they have a one-goal lead, a trend since the start of the season. When it comes to possession, generating scoring chances and most importantly scoring/preventing goals while the team is leading, the Oilers see a significant drop from their usual performance levels.

I received some positive feedback about the analysis, and was asked by a reader how the Oilers do when they’re actually trailing in a game. Based on how they’ve played and the lack of wins overall, combined with their injury issues, my guess was that the Oilers were not very good when trailing in games. I could only recall a few games where they played well while trailing, so I thought it’d be worth looking at the data.

First up, I created a new graph that compares how the Oilers do in all-score states at even-strength, with how they do when they’re leading in a game. My previous article looked specifically at when the Oilers lead by one, so this expands the dataset slightly. Unfortunately, we still see that compared to the NHL average, the Oilers take a significant drop from their standard level of play when it comes to possession, scoring chances and goals. They don’t lead in a game often (they rank 27th in the league in ice time) and sit near the top of the league when it comes to how big of a drop they take from their typical performance levels (Source: War on Ice).

Full article is at The Copper & Blue.

Exploring the Oilers’ Powerplay Issues

The Oilers powerplay has received extensive criticism this season as the club sits 19th in the league with a 17.5% success rate. The expectations were high as Todd McLellan and Jay Woodcroft ran very good powerplays in San Jose, even finishing in the top three in the league a few times. At the start of the season, Woodcroft discussed some of the concepts the coaching staff were going to instill and what would make them successful.

Everything for us comes off of the shot so we want to encourage our team to shoot the puck and we have clear retrieval points of how to get the puck back once the shot is taken. Teams in the NHL are very good on the kill, they bring a lot of pressure and so it’s very important that everyone is on the same page, but again, no set plays. We have principle and structure rather than set plays. (Source: OilersNation)

We know from past research that the generation rate of unblocked shot attempts (i.e., Fenwick For/60) is a good predictor of powerplay success (Source: Objective NHL). Unfortunately, this aspect of the game has been an issue all season for the Oilers as they don’t generate enough shot attempts on the powerplay, and often have their shots blocked. While premier powerplay teams like the Capitals, Ducks and Bruins also lead the league in Fenwick For per 60 (FF/60), the Oilers rank 19th (at 62.04) with little progress since October. Below is their 10-game rolling average of FF/60 on the powerplay this season (Source: Corsica Hockey).

Full article is at The Copper & Blue.