Checking in on the Oilers Pacific Division Rivals

Forty games into the 2016/17 season, and the Oilers are holding a playoff spot, ranking third in the Pacific with 47 points, good for fifth in the Western conference. The team is coming off of a big win against a good Boston club last night, with Maroon, McDavid and Talbot leading the way. Up next is a back-to-back set against the Devils, who will have played the night before, and the Senators.

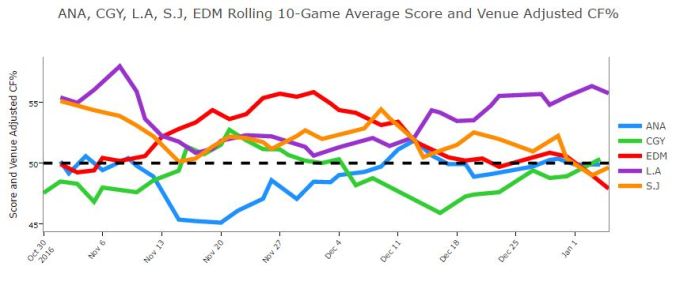
With the team in a playoff race now, it’s worth checking in on how the Oilers Pacific division rivals are doing in terms of goals and the shot metrics that predict future goals. The three California teams are going to be the ones to beat, but if the Oilers can get consistent even-strength scoring from the lines that don’t feature McDavid, they could potentially challenge for that third spot.

Here’s what the Pacific Division looks like today. I’ve included each team’s record, along with their points percentage, which is the points divided by the total points available (Source: Hockey Reference).

Team Games Record PTS PTS% GF% CF% XGF%
San Jose Sharks 39 23-14-2 48 0.615 52.98 52.03 53.07
Anaheim Ducks 40 20-12-8 48 0.600 43.16 44.72 41.48
Edmonton Oilers 40 20-13-7 47 0.588 52.38 51.10 49.00
Calgary Flames 40 21-17-2 44 0.550 47.16 49.59 47.14
Los Angeles Kings 39 19-16-4 42 0.538 50.55 54.07 53.03
Vancouver Canucks 40 19-18-3 41 0.513 46.05 47.63 46.57
Arizona Coyotes 38 11-22-5 27 0.355 49.17 49.45 51.51

What we can also do is look at how each team is doing over 10-game, rolling segments this season. What we do here is take games 1-10, find the average of the metric, then take games 2-11, find the average, games 3-12, and so on. Doing so can highlight trends and can give us a better perspective of how a team’s entire season has been going.

I’ve focused on even-strength play (5v5), as it evaluates a team in a natural game setting where coaches are rolling their lines, trying to score and defend, and is where the majority of the game is played. These numbers are also score adjusted, based on Corsica Hockey’s methodology. This way, we eliminate score-effects, as team’s that trail in a game start to take more risks and generate more shots, while team’s that lead in a game tend to play safer, and generate far fewer shots. Without adjusting, team’s that trail a lot, like the OIlers have in the past, start posting better shot-shares, for example, mainly because they’re taking more risks trying to tie a game. So adjusting for score-effects puts more emphasis and value on the events that occur in close game situations and gives us a more accurate assessment of a team. More on adjusted metrics can be found at Corsica Hockey.

pac-rollingcf

Full article is at The Copper & Blue.

The Oilers Have League Average Goaltending. Rejoice!

A big reason why the Edmonton Oilers have been a competitive team this season has been the play of 29-year old goalie Cam Talbot. The netminder has started 32 of the Oilers 36 games this season, the most among all goalies, playing over 1,900 minutes, and has a record of 17-10-5 with three shutouts. Among the 46 goalies who have played at least 500 minutes at even-strength (5v5) this season, Talbot ranks 20th with a save percentage of 92.73%. Worth noting that his play on the penalty kill was a big reason why the team ranked so highly at one point, as he ranks 10th among the 41 goalies who have played at least 70 minutes shorthanded with a save percentage of 89.66%. (Source: Corsica Hockey).

The Oilers currently sit 10th in the league, and 5th in the Western Conference, when it comes to team save percentage at even-strength with 92.55%. This is a major jump from the past three seasons, as the club has ranked 26th, 30th and 29th since the 2013/14 season. The league average typically hovers around 92.0% to 92.5%, so anything near that can be considered progress for this franchise.

team_save_percentage___edm_vs_league

Full article is at The Copper & Blue.

The Edmonton Oilers With and Without McDavid (Part II)

A while back, I looked into how the Edmonton Oilers did across five metrics with McDavid on the ice and McDavid off the ice at even-strength (5v5) (Source). Those five metrics were:

  • Corsi For% (CF%) – The proportion of all the shot attempts the team generated and allowed that the Oilers generated (i.e., Corsi For/(Corsi For + Corsi Against). This is used as a proxy for possession and can predict a team’s future share of goals.
  • Fenwick For% (FF%) – The proportion of all the unblocked shot attempts the team generated and allowed that the Oilers generated (i.e., Fenwick For/(Fenwick For + Fenwick Against). This is used as a proxy for shot quality and considers shot blocking a repeatable skill. It can also predict a team’s future share of goals, slightlty better than Corsi.
  • Scoring Chances For% (SCF%) – The proportion of all the scoring chances (as defined by Corsica Hockey) that the team generated and allowed that the Oilers generated (i.e., Scoring Chances For/(Scoring Chances For + Scoring Chances Against),
  • Expected Goals For% (xGF%) – This is a weighting placed on every unblocked shot based on the probability of the shot becoming a goal. This depends on the type of shot, location and uses historical shot and goals data to come up with the probability for each unblocked shot. This has been found to be a better predictor of future goals than Corsi and Fenwick. (Detailed explanation can be found at Corsica Hockey)
  • Goals For% (GF%) – The proportion of all the goals that the team scored and allowed that the Oilers generated (i.e., Goals For/(Goals For + Goals Against).

Here’s how the Oilers are looking with and without McDavid after 35 games.

Here we see that the club is relying heavily on their captain to score goals and generate chances and high quality shots this season. On the bright side, the team is posting a share of shot attempts and unblocked shot attempts above 50%, which is significant as the franchise has historically been very poor when it comes to these metrics, often ranking near the bottom of the league. Before this season, the Oilers have only once in their last 8 seasons posted a 25-game stretch of 50% CF% (Source). So the goals aren’t coming as often with McDavid off the ice, but the team isn’t getting caved when it comes to the number of shots.

While it’s expected that teams do better with their star players, there should not be a significant drop off without them. What we’ve seen in the playoffs year over year is that depth and consistency is critical for a team’s success. Ideally a team’s management group compiles a balanced roster and establishes a five or seven year window where they can be legitimate contenders. To do that, the team needs offensive output from across their roster, something the Oilers have struggled with so far this season.

Since the end goal is a championship, I looked into the last six Stanley Cup finalists to see how the team did over the regular season with and without their best player (which is based on the total number of points they accumulated in the regular season). Not an exact science, and there’s plenty of things you can alter, but I’m comfortable with this simple method.

Full article is at The Copper & Blue.

Penalty Kill Struggles

When I last checked in on the OIlers penalty kill in early November, things were humming along just fine. They had the 4th best penalty kill percentage with 90.2% efficiency, and they allowed the fourth fewest goals against per hour with 3.01. One issue the team was having at the time was that they were allowing a higher than average rate of unblocked shot attempts against per hour. And this issue was being masked by some outstanding goaltending, which was mostly Cam Talbot, as the Oilers had one of the best team save percentages in the league, with 93.55%.

Fast forward to today, and it looks like things are starting to catch up to the Oilers. The club is now ranked 10th in the league with an efficiency of 83.5%. They now sit at a goals against per hour rate of 4.87, 8th best in the league, with the league average being 5.80. The rate of unblocked shot attempts against is now at 67.47, now only slightly higher than the league average of 67.12. And the club’s team save percentage on the penalty kill has come back down to earth, down to 89.86%, but is still ranked 7th in the league, with league average being 87.77%.

We can also break out the Oilers performance on the penalty kill into rolling 10-game stretches, to get a sense of the overall trend. Below is the goals against per hour rate over the first 32 games. The first dot in the graph represents the rate of goals against per hour between games 1 and 10. The second dot represents the rate of goals against per hour between games 2-11, then 3-12, and so on. What we see here is that the Oilers were pretty darn good early on, well below league average, but things have been getting progressively worse. It looks like things may stabilize for the Oilers around the 5.0 goals against per hour mark, right around the league average, but the most recent stretch of 10 games have been pretty bad. We also have to consider here that the Oilers have had a pretty grueling schedule over the past couple of weeks, so fatigue may be a factor.

oilerspk-ga60-20161218

Full article is at The Copper & Blue.

Letestu to the Rescue II

The Oilers powerplay has been trending upwards the past few weeks, and currently ranks 6th in the league with a 22.4% efficiency. Another way to look at the powerplay is by the number of goals the team has scored per 60 minutes, which currently has them second in the league, only behind the Columbus Blue Jackets, with 8.06. The league average for goals scored per 60 is 5.74, which the Oilers have been above for the most part thanks largely to a shooting percentage over 14% (4th best in the league). What’s also been encouraging is the fact that the number of unblocked shots (i.e., Fenwick) the club generates per 60 has steadily increased on the powerplay, a good predictor for future success, and is now ranked 11th in the league with 68.12. At one point the Oilers were ranked quite low league-wide, well below the league average of 66.5.

Related: Letestu to the Rescue (2016, November 18)

It’s really been the last 10 games for the Oilers, and the addition of Mark Letestu to the powerplay unit, that has driven the team’s success with the man advantage. Over the first 17 games, Letestu had played a total of 19 minutes on the powerplay, which ranked him near the bottom in terms of ice time among forwards. This was surprising considering that Letestu has historically had a positive impact on the team on the powerplay, as the Oilers typically generated more unblocked shot atttempts with him on the ice. This impact also showed up in his teammates performance, as players often had better on-ice shot generation rates with Letestu than without him. Please note that the graph below contains the shot metrics as of November 18, 2016.

letestu_pp_ff60

Full article is at The Copper & Blue.

Bad News Sunday: Time for a reality check

After reading Minnia’s article on Friday, I felt pretty good about the team. She made some great points about the team’s progress, the impact different players have had, and how great McDavid has been. Ya know things aren’t so bad, I thought. The Oilers are first in the Pacific division. They’re getting 51.9% of the total shot attempts at even-strength. They’re getting 51% of the total goals scored. The powerplay is in the top 5. The penalty kill is in the top 10.

Then I watched the game on Friday night. And the sunshine-and-lollipops feelings went away. Okay, who am I kidding. My cold, bitter heart that’s endured so much losing because of this team didn’t let those feelings sink in for too long. We need to face it: this team has problems.

  1. Points are slipping away

After 30 games, the Oilers hold a record of 14-11-5. They sit first as of this writing, but could very well be out of the top three in their division by the end of the night. Their points percentage, the points divided by the total available points, is 0.550. To put this into perspective, a 0.550 points percentage was good enough for eighth place in the Western conference last season. Not only are the Oilers very mediocre up to this point, but so is their division, and pretty much the entire West. And the Oilers still haven’t been able to capitalize. They couldn’t beat the Coyotes this year. They couldn’t beat the Sabres. And they’ve consistently left points on the table against teams they should be competing against, like Minnesota, for a playoff spot.

Full article is at The Copper & Blue.

Weekend Q&A: McDavid’s Wingers, McLellan’s Short Leash, and the Rogers Place Crowd

coppernblue.com.full.54273Below is part of the Weekend Q&A my colleague Minnia and I put together over at The Copper & Blue.

Minnia: With McDavid being paired with so many different wingers, especially on the right side, who have you liked best so far?

Sunil: This guy is so incredible that it doesn’t even matter who his linemates are. Usually we look for which two or three players have chemistry and how they can work off of each other. With McDavid, you look at who needs to play with him to get going or which player’s potential you can maximize. At the start of the year, I would have pushed for Maroon to be McDavid’s left side instead of Lucic, just based on Maroon’s 16 games with Edmonton last season. And I would’ve wanted Eberle on the right side, as he had great chemistry with McDavid and has the speed and finish to produce on the top line with him. Today, I’d rather have Maroon playing on other lines, as he’s been a positive influence on others and has been able to generate goals with McDavid on the bench, something that remains an issue for the Oilers. As of today, I’d keep Lucic with McDavid as they’ve been productive together, and I’d add pretty much any of the depth right wingers to that line. It wouldn’t hurt to have Puljujaarvi there, since the Oilers have no idea what to do with him, or even Slepyshev who has the skillset to fill a complementary role. Whatever the Oilers do, they have to ensure that the other three lines behind McDavid are loaded up so they can start producing goals. This means they may have to have the more depth players on the first line with McDavid.

Minnia: It seems McLellan is quick to “punish” this season, whether it’s reducing ice time drastically for mistakes in-game (Klefbom, Larsson) or sitting players for extended periods of time (Pouliot)– do you like his approach in leaving very little room for mistakes, or would you appreciate some more leeway for players?

Sunil: I think it’s ridiculous how McLellan has been handling/punishing his roster to be honest. A coach is responsible for putting together optimal line combinations and defence pairings, and then properly deploying them to increase their odds of winning games. If a player is struggling within a game, it makes sense to give ice time to the players you’re trusting. But after the game, re-set, work with the player, and base your future decisions not just on one bad play, but a larger sample size. Klefbom is a prime example here. He’s done very well paired with Larsson this year, all areas of the ice, against the other team’s top lines. The duo have a 51.79% share of all of the shot attempts when they’re on the ice this season, which is great considering the competition they face (Source: Corisca Hockey). Their 345 minutes together is the most on the team, so why not stick with that? After a bad play last week, Klefbom still isn’t back with Larsson, who is now getting caved in when it comes to shots against paired with Russell.

Minnia: Taking a look at Bakersfield, who are some of the players on the cusp you’d like to see up on the Oilers in case of injury (#knockonwood)?

Sunil: I would love to see Jujhar Khaira with the Oilers at some point this season. He’s a good skater and showed last season in limited minutes that he can keep up with the more established players. In 2015/16, with Pouliot out, Khaira skated with RNH and Eberle for a total of 53 minutes at 5v5, and played the same level of competition that RNH is accustomed to. The trio had a 50% share of the shot attempts, which was great considering the rest of the team was below 48% for most of the season. Long term, he should be a depth centerman, but it wouldn’t hurt to continue breaking him in on the wing. This season in Bakersfield, he has 5 goals and 5 assists in 12 games and ranks second on the roster when it comes to points per game (0.83). He’s also one of the team leaders in shots per game (3.1).

Minnia: What do you make of the interesting trend that the Oilers seem to lose a lot of games when they win the Corsi battle, yet win a lot of games when they lose the Corsi battle?

Sunil: A lot of that has to do with score effects. Basically, when a team is trailing in a game, which the Oilers have done often recently, they increase their output of shots as they start taking more risks and might shorten their bench and get their top players out there to find offence. On the flip side, when a team is leading, they often slow down their offence, start playing a safer game, off-the-glass-and-out tactics in an attempts to stifle the shots against. At the end of the game where the Oilers lose, it might look like they were outshooting the other team, but that usually happened after they were trailing.

Full article is at The Copper & Blue.

The Edmonton Oilers With and Without McDavid

The Oilers were very fortunate to have won the draft lottery that landed them an elite player like Connor McDavid. In 23 games this season, the 19 year old has scored 29 points, with 20 of those points coming at even-strength. His 3.29 points per hour at 5v5 has him third in the league, behind Kucherov and Stamkos. He consistently drives offence in all three zones, as teammates do better with him than without him when it comes to individual and on-ice metrics.

Without a doubt, McDavid has been the key driver behind the Oilers success so far this season. The club is 12-9-2, securing 26 points, and sits in first place in the Pacific division. And their +9 goal differential (all situations) ranks them second in the western conference. Say what you will about the teams in the west and their struggles, but the Oilers have managed to take advantage and remain competitive.

A quick glance at the underlying numbers, and the Oilers appear to be an average-to-good NHL club. Below is their overall share of shot attempts, scoring chances, expected goals and goals at 5v5 this season. Included for each metric is their ranking in the league.

CORSI FOR% FENWICK FOR% SCORING CHANCES FOR% XGOALS FOR% GOALS FOR% PDO
51.89 (9th) 52.60 (7th) 52.09 (10th) 50.59 (14th) 53.41 (9th) 100.44 (11th)

This is all very positive for the Oilers as the club has historically been below 50% for pretty much every shot and goal metric. The fact that they have close to a 52.0% share of the shot attempts is significant progress and indicates that they should be able to compete for a playoff spot this season. But if we look at how the Oilers do with McDavid on the ice and compare that to how the club does without him, things get a little interesting.

mcdavid-on-and-off-ice

Full article is at The Copper & Blue.

Letestu to the Rescue

The Oilers powerplay currently ranks 19th in the league, converting on 16% of their opportunities this season. One of the big reasons why they haven’t done so well is because of the poor shot production with the man advantage. This is an issue that’s lingered since last season, with the coaching staff often preaching the importance of getting shots through and finding second chances around the net (Source: Inside Sports, 630 CHED). As of today, the Oilers rank 20th in the league when it comes to the rate of unblocked shot attempts (i.e., Fenwick For per 60 minutes), sitting at 62.15. This is slightly down from last season when the club generated just over 63 unblocked shot attempts per hour.

What I found last season when looking at the powerplay, was that the Oilers generated more shots when veteran Mark Letestu was on the ice. He finished the 2015/16 season with the fifth highest ice time on the powerplay, behind Hall, Sekera, Draisaitl and Eberle. This was in large part because of injuries to Klefbom and McDavid, but nevertheless, Letestu was effective in driving the team’s overall shot rates.

This season, Letestu has only played 17 minutes on the powerplay through 18 games, which ranks him 10th on the team among the regular skaters just ahead of rookie Jesse Puljujarvi. (Source: NHL)

letestu-pp-ff60

Full article is at The Copper & Blue.

Couple Thoughts on Darnell Nurse

After 16 games, 21-year old defenceman Darnell Nurse is averaging just over 17 minutes of ice time per game, fifth among the seven defencemen who have played at least 100 minutes this season. He currently leads the Oilers in ice time on the penalty kill, where he’s been paired with Eric Gryba for the most part. He’s second among defencemen with four points, including a fantastic goal scored at the Heritage Classic in Winnipeg. 

The Oilers appear to have learned their lesson from last season as they are not deploying Nurse against the other teams top lines and are managing his ice time well. He started the season on the third pair with Gryba, but has seen his ice time steadily increase, along with the level of competition, after Kris Russell was injured. The main reason for this is that Sekera, who was paired with Russell, is now skating with young Matt Benning who the team is carefully sheltering with less ice time and against the other teams secondary forwards. This has pushed Nurse and Gryba up to more of a second pairing, while Sekera and Benning are deployed as a third pairing (Source: Hockey Viz)

Over the course of the season, Nurse has shown signs of progress, especially on the offensive side of the game. He’s skating with the puck more, he’s jumping in on plays more frequently and he’s been quite effective at getting his shots on net. Below is each defencemen’s rate of individual unblocked shot attempts, with young Nurse leading the way at 5v5, just slightly ahead of Klefbom. (Source: Hockey Analysis)

nursefa60

Full article is at The Copper and Blue.