Re-capping the Oilers 2026 playoff jog

“We were an average team all year. (When you’re) an average team with high expectations, you’re going to be disappointed.”

That post-game comment from Connor McDavid is a pretty succinct summary of the Edmonton Oilers 2025/26 season.

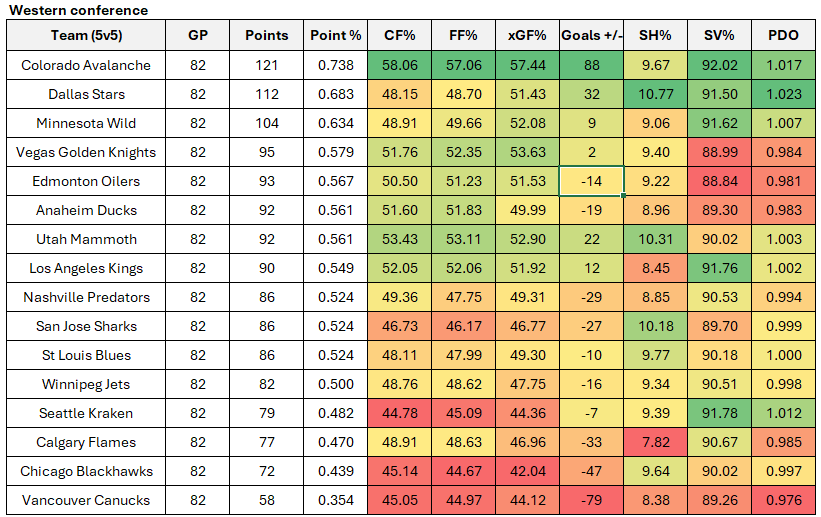
Their regular season had mediocre results driven by mediocre process. Their final points percentage and goal-share was league average. And their underlying shot-share metrics that capture the team’s ability to control the flow of play and outchance opponents were well below what they were in previous seasons. But the wave of two appearances in the finals combined with having McDavid and Draisaitl on the game-one roster masked those warning signs and created a false sense of optimism heading into the playoffs.

First, a brief summary of the Oilers 2026 post-season run – or maybe we’ll just call it a light jog.

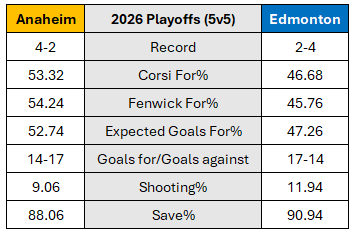
The Oilers did manage to outscore the Ducks at even-strength (5v5), but that was largely driven by a higher-than-normal shooting percentage of about 12 percent. The Oilers underlying numbers were unsurprisingly poor, as they only controlled 47 percent of the shot attempts and were often out-chanced as reflected by their Expected Goals for percentage of 47 percent. Put another way, the Oilers probably should have had a -2 goal differential instead of +3.

The powerplay was a bright spot for the team, scoring four times in only 22 minutes, a rate of 10.75 goals per hour, which aligns with their elite-level regular season results. Unfortunately, the refs didn’t call a lot of penalties in this series, which was bizarre and took away one of the Oilers edges in this series. But that’s just the usual post-season match fixing we all get to enjoy.

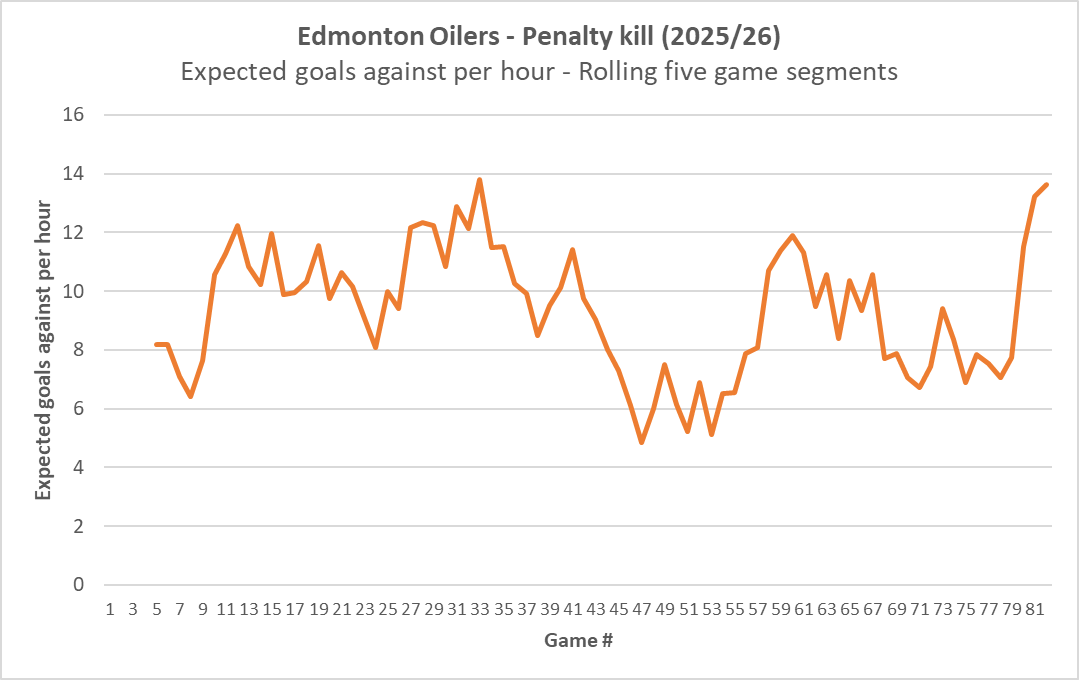
The Oilers penalty kill was a complete disaster, even getting called out by their captain last night. They allowed eight goals in only 21 minutes shorthanded – a rate of 22 goals against per hour, which is exceptionally high. And remember, this did not come out of nowhere. It was a problem all season and got even worse just before the playoffs began. This is going to be talked about for a long time as it pretty much cost them the series. Coaching, deployment and tactics will be under the microscope this off-season and I suspect a couple bad signings are going to be made to address this.

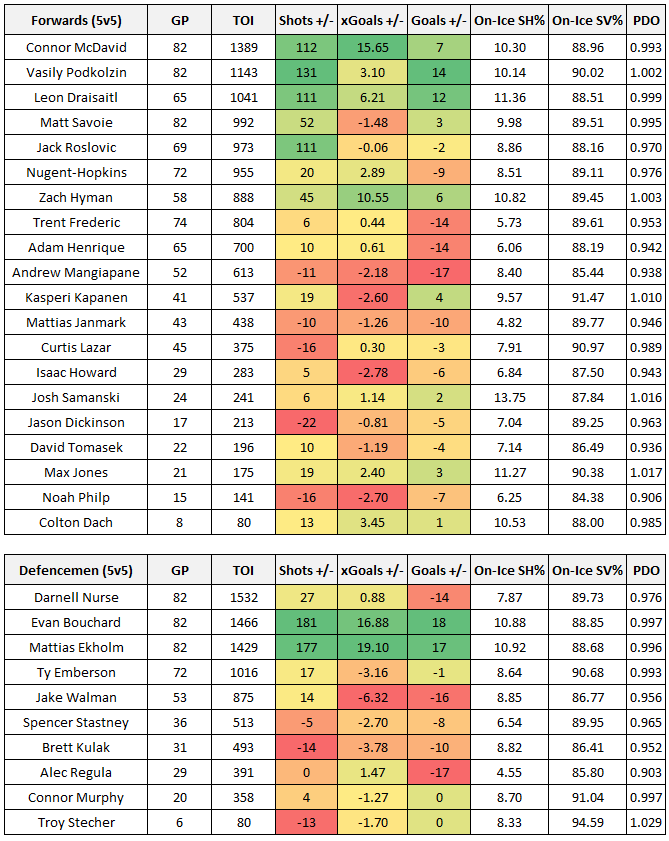
And here’s how the Oilers players did against the Ducks at even-strength (5v5), split by position and sorted by ice time, with a simple heat map applied to show how players compared to their teammates.

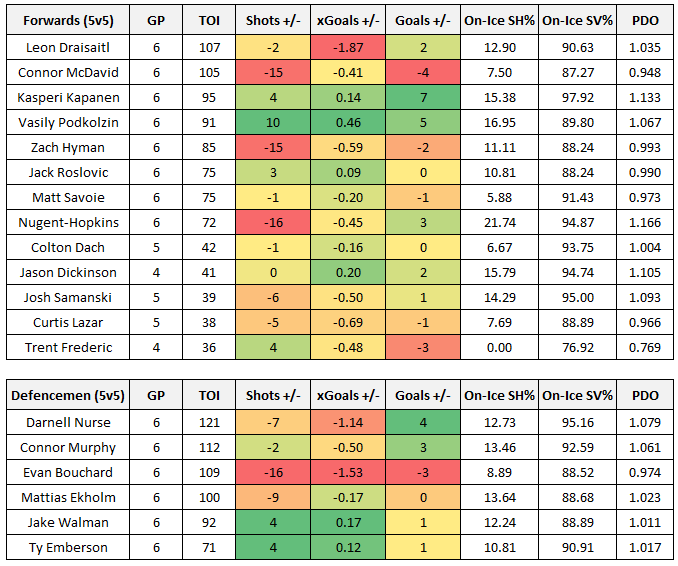
What stands out are the ghastly numbers posted by the Oilers top players. McDavid’s on-ice shot and scoring chance differentials were the worst in his playoff career and made him more of a liability rather than a driver. What was especially alarming was how bad McDavid and Draisaitl performed together. In 34 minutes together, they posted a 42 percent Corsi For percentage, and a 26 percent (!!) Expected Goals for percentage. It’s pretty obvious the two were injured, the coaching staff didn’t have a backup plan – and the Ducks exploited it. On the backend, Bouchard was pretty bad, spending a lot of time defending and only had three assists in the series. Darnell Nurse had another underwhelming postseason, offering little impact. And Ekholm was also looking pretty ordinary.

And now that they’ve been disposed of by the Ducks, the Oilers front office decision-makers are where they should be – focused on figuring out the real root causes of a disappointing regular season and reassessing whether its current approach is capable of sustaining championship contention. If Edmonton truly wants to be one of the top teams, that off-season work needs to go far deeper than blaming a short playoff run and just addressing the symptoms. This season was the result of many failings beyond the penalty kill, the coaching and the depth players. There’s a systemic issue here, and it needs to be figured out as soon as possible.

Data: Natural Stat Trick

Edmonton’s penalty kill was bound to break

Quite the hole the Edmonton Oilers have dug themselves into, having now lost three straight games to the Anaheim Ducks. And unsurprisingly, the penalty kill sits at the center of the problem.

In my end‑of‑season post, I summarized the Oilers’ penalty kill as sketchy, and the numbers supported that. They finished the regular season with the 12th‑highest rate of goals against while short‑handed (8.16 per hour). That result was largely driven by poor underlying process – Edmonton allowed the ninth‑highest rate of shots against (54.64 per hour) and the ninth‑highest rate of expected goals against (9.57). Put another way, this team struggled to disrupt opposing power plays and consistently failed to keep the puck out of high‑danger areas.

Now that weakness has been fully exposed in the postseason—and things have gone from bad to worse, and could cost them another critical season. Through just 17 minutes of penalty‑kill time against the Ducks, the Oilers have surrendered six power‑play goals. That translates to a goals‑against rate north of 20(!) per hour. Once again, the underlying numbers tell the same story: a massive spike in shots against (89.83 per hour) and expected goals against (14.87 per hour). The Ducks are basically having no issues generating chances.

Worth noting that the penalty kill had been a recurring concern throughout the regular season, particularly after Adam Henrique went down with injury for an extended stretch. The 34‑year‑old centre was a significant contributor short‑handed, and his absence was felt. Now that he’s injured again, the drop‑off is even more pronounced.

What I also didn’t realize was just how poorly the Oilers penalty kill performed late in the regular season, particularly in terms of the volume and quality of scoring chances allowed.

The chart below shows the Oilers’ expected goals against per hour on the penalty kill across the regular season, broken into rolling five‑game segments. The goal was to determine whether Edmonton had previously allowed scoring‑chance rates comparable to what we’re now seeing against Anaheim. I suspected they had—but I didn’t realize just how severe the spike was over the final few weeks of the season.

Given those trends, you’d expect the coaching staff to have been aware of this vulnerability heading into the playoffs. Either they weren’t aware of the data or they chose not to address it with urgency. Neither explanation reflects particularly well on any of them – specifically Knoblauch and Mark Stuart.

After seeing this data laid out, it’s hard to be completely surprised that the Oilers now find themselves down 3–1 in the series. What’s most alarming is that this feels entirely preventable—an issue that was clearly brewing long before game one of the post-season.

Data: Natural Stat Trick

Related articles:

Slow your roll

The Edmonton Oilers 2025/26 regular season was a disappointing one as they finished with only 93 points – a 0.567 points percentage that ranked 14th in the league. Considering the previous five straight seasons of having a points percentage above 0.600, including four (kinda five) straight 100-pont seasons – this is definitely a drop off. But thanks to a weak conference, and especially a weak Pacific division where all five Pacific division playoff teams were below 0.600 and ranked 13th or lower in the league, the Oilers still managed to secure home ice advantage in the playoffs. Wild.

The Oilers lack of success was largely driven by their mediocre play at even-strength (5v5). Their -14 goal-differential and 48 percent goal-share ranked 20th in the league, which wasn’t surprising considering their Corsi For percentage barely broke even. Their share of scoring chances was a little better, and ranked in the top ten league-wide, but there was a noticeable drop off from previous seasons when they would be near the top of the league when it came to expected goal metrics.

That’s probably what’s the most troubling part about the Oilers regular season. Last year, they also had a negative goal differential at 5v5, but they were at least posting exceptional shot-share numbers, which meant the positive results were eventually going to come. This year however, it’s hard to have that same level of confidence, especially when you consider the team’s shot-share metrics are all around the 47 percent mark when McDavid or Draisaitl weren’t on the ice. The results have been just ghastly with the team posting a -31 goal differential when one of the glimmer twins aren’t deployed.

Here’s a quick look at the Oilers’ skaters, and their on-ice numbers sorted by ice time. Included is each player’s on-ice shot differential, expected goal differential and actual goal-differential. And for additional context, each player’s on-ice PDO is captured. A basic heat map is applied to show how players compare within their cohort. The key takeaway here is that the Oilers top six group is pretty good, and the rest are a bunch of blots ready to be exploited. Dickinson hasn’t been the solution for the bottom six group, and it’s hard to tell who can step up in the playoffs. The defence group has one solid pairing and the rest is a spot of bother.

The other factor to consider is the just-barely-average goaltending the Oilers are heading into the playoffs with – with Ingram taking the starter role. This is definitely an upgrade from previous seasons and bodes well for the team. But it’s a little concerning that the teams 5v5 save percentage was 88.84 percent (dead last in the league) over the course of the full season, and around the same mark over the final twenty-five games. Ingram just needs to be average, and Jarry should hopefully not see much ice time.

Quick notes on special teams. The Oilers powerplay finished the season as the league’s best, which is no surprise, scoring 11.88 goals per hour. This was largely driven by their high rate of shots and chances, which all ranked at the top. The penalty kill is where things are a little sketchy. The team finished 21st overall, allowing 8.16 goals against per hour. The team had trouble preventing shots and chances (all ranking in the bottom third of the league) and the goaltending was around league average levels. What’s interesting is that the team did do a better job at preventing shots at even-strength over the final stretch of the season, so it’s a little odd that this focus on defensive play didn’t translate to special teams.

Below are the final even-strength (5v5) numbers for each team in the western conference (sorted by points percentage), including goal-differential results as well as the shot-share metrics that give us a sense of which teams have the right processes in place and if the results are sustainable or not. At the end of the table are each team’s shooting percentage and save percentage. I’ve also applied a basic heat map to each metric to show which teams are doing well or struggling relative to their conference foes (i.e., green is good, red is bad). You can also find a description of each metric at the end of this article. Please note that the shot-share metrics are score and venue adjusted based on Natural Stat Trick’s methodology.

Again, it was a giant, chaotic joke of a Pacific division/western conference/NHL. All five Pacific teams that made the playoffs had a lower points percentage than the Washington, who had the 12th best points percentage in the league (0.579), but still missed the playoffs. Los Angeles ranked 20th in the league with 0.549 and made it. Detroit, Long Island and Columbus all had better points percentages than Los Angeles and all missed the playoffs.

Vegas, Edmonton and Anaheim all had issues in net, so the results should probably have been better considering their ability to control the flow of play. What’s interesting is that over the course of the season, there wasn’t a lot of movement among the teams, and we had a good sense of who would make it pretty early on. The teams that did catch fire and media attention often fizzled out as their underling numbers were often poor. So there really wasn’t much excitement, especially with the Pacific being so, so bad.

For reference, I’ve also put the table together for the eastern conference. Carolina, Tampa Bay and Ottawa all posted strong shot-share numbers, but it appears they’ve also had some goaltending issues. Buffalo obviously did well, but I do wonder if we see them struggle considering their shot-share numbers weren’t great and they rode the PDO pony a bit. Same with Montreal. Boston appears a little fraudulent, as does Philadelphia, so I don’t think they’ll get very far.

Obviously pulling for Edmonton because of the smart cats they have in the front office, but I’m thinking it’ll be Colorado coming out of the west and likely Carolina and Uncle Dennis representing the east.

Data: Natural Stat Trick

Bearing off

This has to be it, right? The Edmonton Oilers get a second chance to win the Stanley Cup starting on Wednesday night against the Florida Panthers, which should be a very entertaining series. Both clubs have been dominant this post-season, and it felt kind of inevitable that they’d be going at it again. Pip count is near identical, now it comes down to the rolls – and hopefully things swing the Oilers way.

Here’s how the two clubs have done at even-strength this post-season. Both have dominated the scoresheets, each hovering around a near identical 62 percent goal-share. And their success has been supported by strong shot-share numbers – no surprise there.

What stands out here is the fact that the Oilers goaltending has been slightly better at even-strength this post-season, with the Panthers hovering closer to league average levels. Bobrovsky had a solid regular season, ranking 15th among 58 goalies who played at least 1,000 minutes in the regular season with a 91.9 percent save percentage. And a +8.53 goals-saved-above-average. Skinner, meanwhile, ranked 46th in save percentage (90.2 percent) and 48th in GSAA (-8.80). What that tells me is that Bobrovsky put together longer stretches of success in the regular season than Skinner – but it remains to be seen which one can do it first in the finals.

Both teams are also getting good results from across their rosters – scoring goals with and without their star players on the ice. Without one or both of McDavid or Draisaitl at even-strength, so about 50 percent of the team’s total time, the Oilers have posted a goal-share of 67.74 percent (21 goals for, 10 goals against). And on the other side, without one or both of Barkov or Tkachuk, about 46 percent of the team’s total time, the Panthers have also posted an exceptional goal-share of 66.67 percent (20 goals for, 10 against).

Where the Panthers depth players have an edge over Edmonton is their possession numbers, as measured by the Corsi For percentage (i.e., unblocked shot attempts). Edmonton tends to struggle controlling the overall flow of play, especially with Nurse on the ice with the depth players. In those situations (i.e., Nurse without one or both of McDavid or Draisaitl), the results have been good (9 GF/5 GA), but the team’s shot share metrics like Corsi and Expected Goals hover around 45 percent.

Here’s how the Panthers skaters have fared this post-season at even-strength, sorted by ice time, with a basic heat map applied to show how each player compares to their teammates.

While there are some players riding the PDO wave, like the Lundell/Marchand/Luostarinen line (who have been excellent), there are others like Reinhart who have the potential to see their scoring pop at evens. Reinhart’s on-ice shot-share numbers have been excellent, but he has only broken-even in terms of goals. Suspect the Panthers coaching staff will heavily target Darnell Nurse, as well as Henrique, Brown and Janmark. As I wrote recently, the Oilers tend to allow a lot of shots with these players on the ice – a trend that has continued since the regular season.

Should also note that the Panthers powerplay has only been alright. They’ve scored at a rate of 8.47 goals per hour, which is close to what they had in the regular season. They’re struggling to generate shots, sitting at a rate of 38 shots per hour, which is one of the lowest among all teams this post-season, and well below where they were in the regular season. The Panthers penalty kill on the other hand has been excellent. They’ve only allowed seven this post-season (a rate of 3.90 goals against per hour), which is one of the best in the league and half of what they allowed in the regular season. They’ve done an excellent job suppressing shots and making life easier for their goaltender – something the Oilers powerplay will have to figure out right away.

As I said at the top, both clubs have moved into their home boards and are in excellent position to win the game – but it’ll come down to the rolls. A bounce here and there, and hopefully someone getting the hot hand should allow Edmonton to bear off and win their first championship since 1990.

Data: Natural Stat Trick