This has to be it, right? The Edmonton Oilers get a second chance to win the Stanley Cup starting on Wednesday night against the Florida Panthers, which should be a very entertaining series. Both clubs have been dominant this post-season, and it felt kind of inevitable that they’d be going at it again. Pip count is near identical, now it comes down to the rolls – and hopefully things swing the Oilers way.
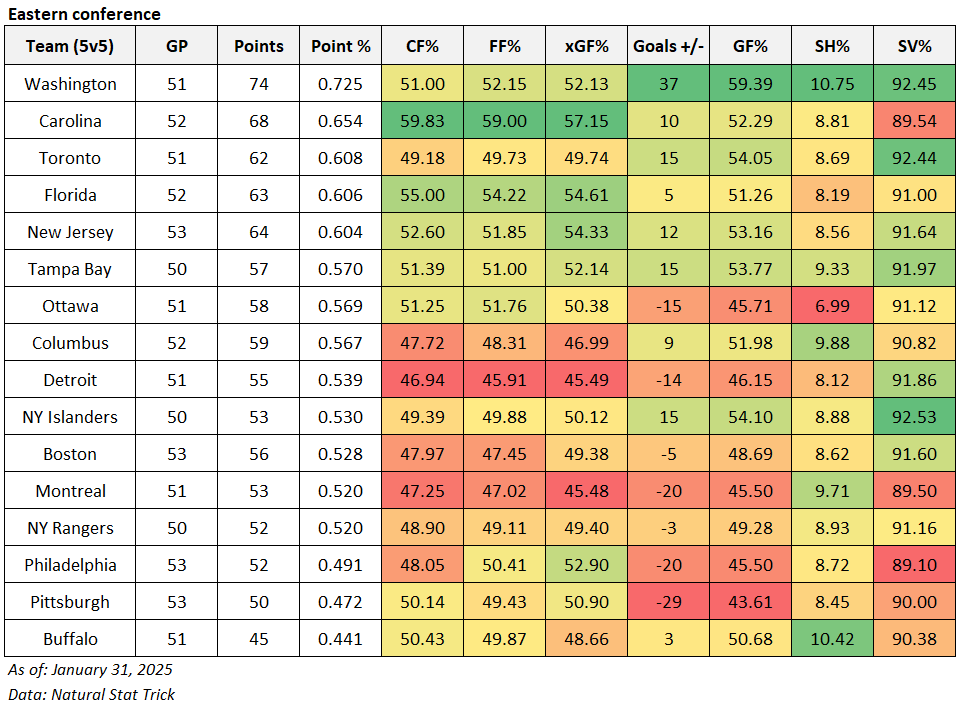
Here’s how the two clubs have done at even-strength this post-season. Both have dominated the scoresheets, each hovering around a near identical 62 percent goal-share. And their success has been supported by strong shot-share numbers – no surprise there.
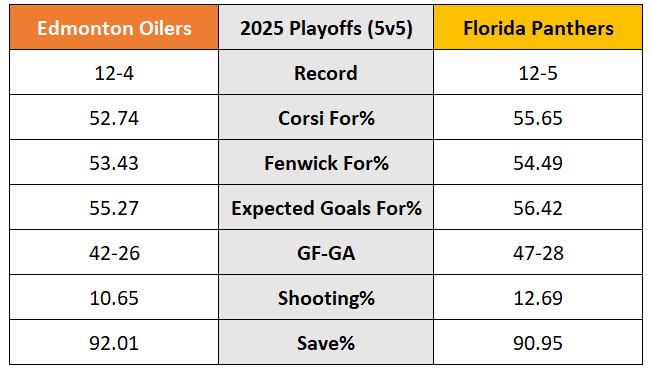
What stands out here is the fact that the Oilers goaltending has been slightly better at even-strength this post-season, with the Panthers hovering closer to league average levels. Bobrovsky had a solid regular season, ranking 15th among 58 goalies who played at least 1,000 minutes in the regular season with a 91.9 percent save percentage. And a +8.53 goals-saved-above-average. Skinner, meanwhile, ranked 46th in save percentage (90.2 percent) and 48th in GSAA (-8.80). What that tells me is that Bobrovsky put together longer stretches of success in the regular season than Skinner – but it remains to be seen which one can do it first in the finals.
Both teams are also getting good results from across their rosters – scoring goals with and without their star players on the ice. Without one or both of McDavid or Draisaitl at even-strength, so about 50 percent of the team’s total time, the Oilers have posted a goal-share of 67.74 percent (21 goals for, 10 goals against). And on the other side, without one or both of Barkov or Tkachuk, about 46 percent of the team’s total time, the Panthers have also posted an exceptional goal-share of 66.67 percent (20 goals for, 10 against).

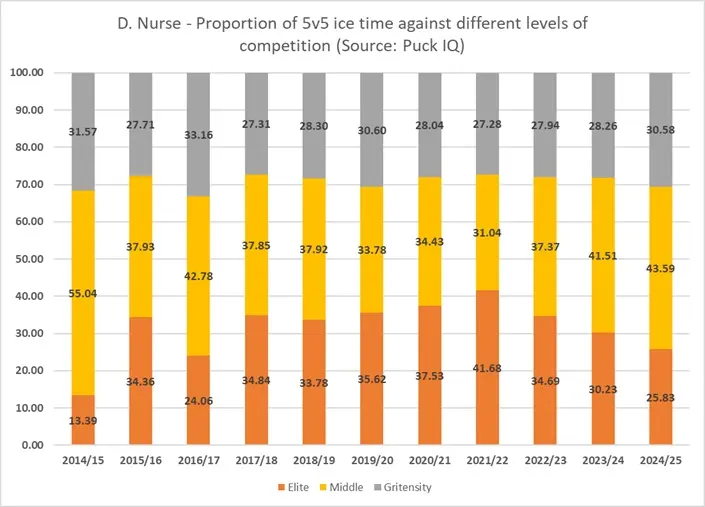
Where the Panthers depth players have an edge over Edmonton is their possession numbers, as measured by the Corsi For percentage (i.e., unblocked shot attempts). Edmonton tends to struggle controlling the overall flow of play, especially with Nurse on the ice with the depth players. In those situations (i.e., Nurse without one or both of McDavid or Draisaitl), the results have been good (9 GF/5 GA), but the team’s shot share metrics like Corsi and Expected Goals hover around 45 percent.
Here’s how the Panthers skaters have fared this post-season at even-strength, sorted by ice time, with a basic heat map applied to show how each player compares to their teammates.
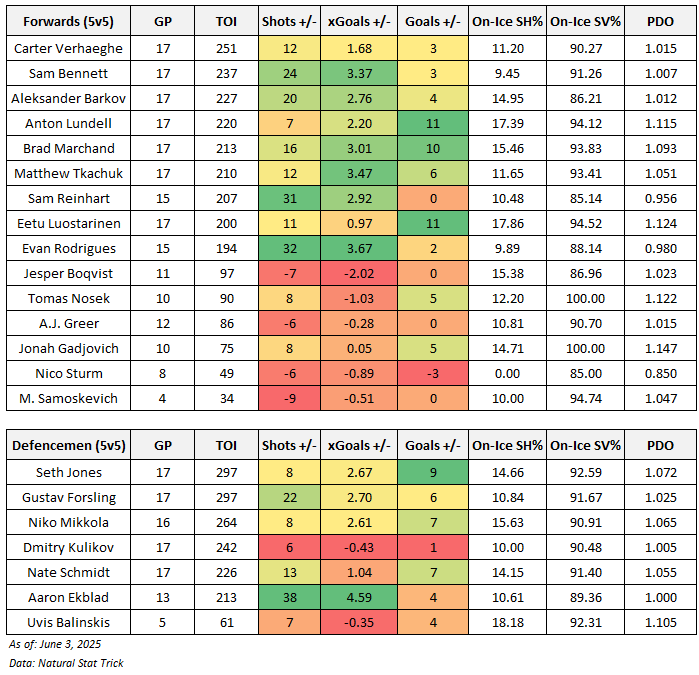
While there are some players riding the PDO wave, like the Lundell/Marchand/Luostarinen line (who have been excellent), there are others like Reinhart who have the potential to see their scoring pop at evens. Reinhart’s on-ice shot-share numbers have been excellent, but he has only broken-even in terms of goals. Suspect the Panthers coaching staff will heavily target Darnell Nurse, as well as Henrique, Brown and Janmark. As I wrote recently, the Oilers tend to allow a lot of shots with these players on the ice – a trend that has continued since the regular season.
Should also note that the Panthers powerplay has only been alright. They’ve scored at a rate of 8.47 goals per hour, which is close to what they had in the regular season. They’re struggling to generate shots, sitting at a rate of 38 shots per hour, which is one of the lowest among all teams this post-season, and well below where they were in the regular season. The Panthers penalty kill on the other hand has been excellent. They’ve only allowed seven this post-season (a rate of 3.90 goals against per hour), which is one of the best in the league and half of what they allowed in the regular season. They’ve done an excellent job suppressing shots and making life easier for their goaltender – something the Oilers powerplay will have to figure out right away.
As I said at the top, both clubs have moved into their home boards and are in excellent position to win the game – but it’ll come down to the rolls. A bounce here and there, and hopefully someone getting the hot hand should allow Edmonton to bear off and win their first championship since 1990.
Data: Natural Stat Trick