Paying attention

klefbom - injury

Since Oscar Klefbom’s injury, the Oilers have gone 3-7-1, collecting seven points in eleven games – a 0.318 points percentage, third worst in the league.

Below are the team’s underlying numbers, each of which have ranked in the bottom five league-wide. So not only have the results been bad (42.00% goal-share, and a -8 goal differential), but the key drivers to success such as possession (Corsi), shot quality (Fenwick) and scoring chances have been poor as well.

Edmonton Oilers (5v5), last 11 games
Goals For% 42.00%
Corsi For% 44.41%
Fenwick For% 41.86%
Scoring Chances For% 44.99%

Worth noting that the Oilers combination of player driven outputs like shooting percentage and save percentage at even-strength (5v5) can’t be blamed for this recent stretch. The team save percentage has taken a dip to 90.71, which is below league average and something that was expected considering how hot the goaltending was running. However the team shooting percentage has been above league average – 9.42%. That’s a total PDO of 100.1.

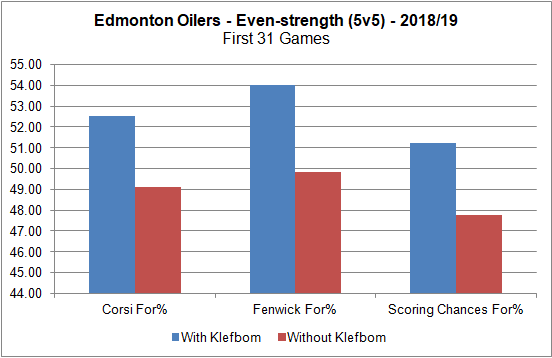
Obviously a big factor in all of this is the injury to Klefbom who had bounced back from an injury plagued 2017/18 season and was the Oilers best defenceman over the first 31 games. He was playing in all situations, against top competition and posting excellent numbers. With Klefbom on the ice, the Oiler’s controlled more of the play and were often getting more opportunities in the offensive zone, which were reflected in his on-ice numbers.

20190106 - Klefbom.png

With that in mind, it’s not all that surprising to see how badly the team’s shot-share numbers have cratered without Klefbom and with increased minutes for Darnell Nurse, whose on-ice numbers from the first 31 games are almost the complete opposite from Klefbom’s (more on that later).

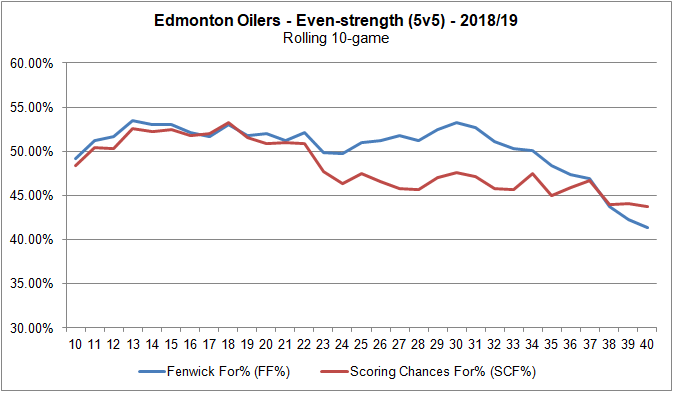
I’ve plotted out the team’s rolling 10-game Fenwick For%, which captures the Oilers share of unblocked shot attempts, a good proxy for shot quality and is used to predict future goal-share. You can see that the team started taking a slide at the 31 game mark when Klefbom was hurt.

20190106 - rolling fenwick rates

Now if you lost your best defenceman, who is known for his offensive ability, who skates well and who can make passes up to the forwards – and your results have been garbage after his injury – what type of player should you try to replace his minutes with? And if you need to enter the trade market, what should you be shopping for?

The Oilers decided on December 31st, after seven games without Klefbom, after increasing Nurse’s minutes and seeing him struggle, that what they needed most were stay-at-home defencemen. They decided to look at the goal metrics, a highly volatile metric that doesn’t predict future goal-share very well, focusing on the 31 goals against in seven games. They moved away future assets to address this need, which was based on a metric that doesn’t correlate with future goal-share and wins, including a draft pick in the top 100 and valuable cap space for next season.

Had they looked at the team’s shot-share metrics with and without Klefbom in the line-up as part of their information gathering, they may have come away with a different conclusion and focused on addressing their real problem.

Below is the team’s rate of unblocked shot attempts (Fenwick) for and against per hour, broke out into rolling 10-game segments. I’ve chosen Fenwick for this exercise as defencemen have a greater impact on these numbers, as it excludes blocked shot attempts. I’ve also included a black line to represent the league average for both Fenwick-for and Fenwick-against per hour, which is currently 42.5.

20190106 - rolling fenwick rates

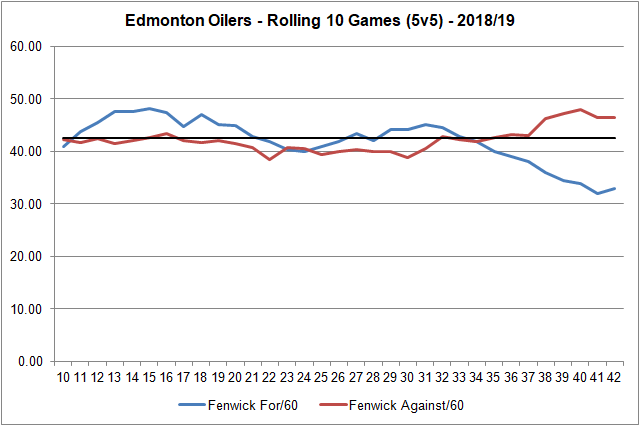
Here we see both rates, for and against, hover around the league average until around the 31 game mark. From that point, the rate of unblocked shot attempts against actually continues hovering around the league average and only gradually increases. In fact, after 42 games, the Oilers rank 17th in the league in Fenwick-against per hour, with 42.5 – the league average.

The unblocked shot rates for, on the other hand, is what took a bigger hit after Klefbom was hurt in game 31. The team has struggled since offensively, posting a league worst 33.4 Fenwick-for per hour in their last 11 games, deviating much further from the league average (42.5) than their rate of Fenwick-against (46.4).

So while it’s true that the team had allowed 31 goals in those seven games that triggered a trade, it’s largely because the team could not sustain any offence in the opponents zone – something that Klefbom had a big impact on.

It’s been fairly obvious for some time now, dating back a few seasons, that the Oilers do not have the depth to replace Klefbom’s unique skill set. Nurse saw his minutes increase in Klefbom’s absence but his performance has been poor, something that was expected considering how much he struggled in the first 31 games this season.

20190106 - nurse

Put another way, in the first 31 games, the Oilers rate of Fenwick-for per hour increased by 4.15 with Klefbom on the ice but dropped by 5.80 with Nurse on the ice. When it came to the team’s rate of Fenwick-against per hour – it dropped by 3.03 with Klefbom on the ice, but jumped up by 4.0 with Nurse on the ice. This current issue is a good reminder that Nurse is best suited for lesser minutes in more of a depth role. And that the team needs to continue identifying and developing offensive defencemen, some of which appear to be in the system.

This current issue is also a good reminder that the Oilers continue to base their roster decisions on poor and shallow information, and have continued to bleed assets chasing solutions for problems that don’t exist. The two new defencemen, one of which has been healthy scratched already, aren’t going to solve the Oilers offensive problems, no matter how tough or “mean” they are. The solution now is for Klefbom to return to the line-up and for the team to change how they assess team defence and better understand its importance to goal scoring.

Until then expect their underlying shot-share and results to stay the same.

Data: Natural Stat Trick

Focusing on scoring chances

coppernblue.com.full.54273One of the interesting underlying trends this season, aside from their rapidly declining shot-share numbers, is the Oilers rate of scoring chances for and against at even-strength. They currently rank 23rd in the league when it comes to their share of the total scoring chances (SCF%) with 47.76%, generating 25.01 scoring chances per hour (21st in the league) and allowing 27.35 per hour (22nd). Note that the scoring chance data used here is based on Natural Stat Trick’s definition of the metric, which you can read more about on their glossary page.

Below is the Oiler’s share of scoring chances this season at even-strength, in rolling 10-game segments to demonstrate the trend. I’ve also included the team’s declining shot-share, specifically Fenwick For (or unblocked shot attempts), which is used often as a proxy for shot quality. Fenwick data is much larger of a sample size than scoring chances, and can give us a little more confidence in our interpretation of the publicly available scoring chance data.

20190104 - scoring chance and fenwick trend

The Oilers rate of scoring chances for and against have gotten worse since Hitchcock arrived, with the team’s overall numbers taking a hit after he replaced McLellan behind the bench and taking another hit after Klefbom was hurt. Below is the team’s rate of scoring chances for and against per hour broken out by rolling 10-game segments, which gives us a better idea of what the trend has been like over the first forty games this season.

Full article is at The Copper & Blue.

CBC Edmonton News (TV): Re-cap of last night’s win, impact of Klefbom’s injury and the Oilers results under Hitchcock

cbc edmonton logoI joined host Tanara McLean on the CBC Edmonton News for my weekly segment to discuss all things Oilers. Clip is here and starts at the 14:00 mark: CBC Edmonton News (2019, January 3)

Topics we covered:

  • Last night’s win in Arizona to start the road trip and the keys to success.
  • The impact of losing Klefbom to injury, and Nurse’s struggles with more ice time.
  • The Oilers under Hitchcock and the impact goaltending has had to the team’s results.
  • The recent transactions and what can be expected from the new defencemen.

Big thank you as always to the crew for putting it all together.

Tracking the Pacific Division – As of December 31, 2018

Oilers-Sharks-2

It’s been a disastrous stretch to close the year. Six straight losses now, one win in their last eight. After 39 games, the Oilers have collected 39 points, going 18-18-3. They had nine wins in their first 20 games under McLellan. They currently have nine wins in their 19 games under Hitchcock.

Meanwhile, the Flames have now scored the third most goals in the league and moved to the top of the Pacific division. San Jose, Vegas and Vancouver have six wins in their last ten. Anaheim has slowly come back down to earth, something that was expected considering their poor shot-share numbers, with their results being propped up by above-average goaltending.

Here’s how the Pacific division teams have done as of December 31, 2018. An explanation of each metric can be found in the glossary at the end of the article.

Pacific Division - 20181231

Couple notes:

  • It was a matter of time before Calgary, San Jose and Vegas took over the top three spots in the division. At the end of November, these three teams were posting good shot-share numbers with Vegas behind Anaheim in terms of actual results. Vegas’ problem at the time was their goaltending, which has gradually improved.
  • San Jose appears to still be struggling with their goaltending, and it wouldn’t surprise me if they made a move to address it in the new year.
  • A big reason why San Jose is winning is their special teams. They rank 7th in the league with 8.63 goals per hour on the powerplay (5v4) and generate the third highest rate of unblocked shot attempts. Their penalty kill (4v5) ranks fifth in the league, allowing 5.29 goals against per hour, and are in the top ten league wide when it comes to limiting unblocked shot attempts.
  • The rest of the Pacific division teams (excluding Vegas) can’t seem to generate a whole lot of offence on their powerplays – they’re all in the bottom third in the league when it comes to unblocked shot attempts. Want to find an edge in this division? Fix your damn powerplay.
  • Arizona had a good start to the season at even-strength, posting a +5 goal differential and a 54% Corsi For percentage. Since then, they’ve plummeted to the bottom of the league (-23 goal differential at even-strength), with their shot-share metrics below 50% now.
  • Vancouver and especially Anaheim should be a lot lower in the standings, but they’re relying on individual talent to stay afloat. Anaheim’s relying on goaltending, while Vancouver is getting some outstanding production from Elias Pettersson. It’ll be interesting to see if they buy into their results and make some long-term decisions based on goal-metrics. But that just might be an Edmonton thing.
  • Los Angeles has gradually been improving getting some good goaltending and winning five of their last ten, but it’s probably too late. They put themselves into a deep hole early in the season and should probably start making some moves for next season. I’d expect an overhaul with their special teams  – both their powerplay and penalty kill is currently bottom five in the league. And they’re bottom five in the league when it comes to generating shots on the powerplay and limiting shots on the penalty kill.

Data: Natural Stat Trick

Glossary:

  • Points percentage (PTS%) – The total points accumulated divided by the points that were available, including extra time.
  • Goals-for and Goals-against (GF/GA) – The number of goals scored and the number goals allowed at even-strength.
  • Goal Differential (Goal +/-) – The difference between the goals scored and the number of goals allowed (i.e., goals-for minus goals-against)
  • Corsi For percentage (CF%) – The proportion of all the shot attempts the team generated and allowed that the team generated (i.e., Corsi For/(Corsi For + Corsi Against). This is used as a proxy for possession and can predict a team’s future share of goals (GF%).
  • Fenwick For percentage (FF%) – The proportion of all the unblocked shot attempts the team generated and allowed that the team generated (i.e., Fenwick For/(Fenwick For + Fenwick Against). This is used as a proxy for shot quality and considers shot blocking a repeatable skill. It can also predict a team’s future share of goals, slightlty better than Corsi.
  • Shots For percentage (SF%) – The proportion of all the shots on goal that the team generated and allowed that the team generated (i.e., Shots For/(Shots For + Shots Against).
  • Scoring Chances For percentage (SCF%) – The proportion of all the scoring chances that the team generated and allowed that the team generated (i.e., Scoring Chances For/(Scoring Chances For + Scoring Chances Against).
  • High Danger Corsi For percentage (HDCF%) – The proportion of all the high danger shot attempts that the team generated and allowed that the team generated (i.e., High Danger Shot Attempts For/(High Danger Shot Attempts For + High Danger Shot Attempts Against).
  • Goals For percentage (GF%) – The proportion of all the goals that the team scored and allowed that the team generated (i.e., Goals For/(Goals For + Goals Against).
  • Shooting percentage (SH%) – The percentage of the team’s shots on goal that became goals (i.e., total goals divided by the total shots on goal).
  • Save percentage (SV%) – The percentage of the team’s shots on goal against that were saved (i.e., 1-(totals goals allowed divided by the total shots on goal against))
  • PDO – The sum of a team’s shooting percentage (SH%) and its save percentage (SV%). It’s based on the theory that most teams will ultimately regress toward a sum of 100, and is often viewed as a proxy for how lucky a team is. (Source)

Settling Nurse Down

coppernblue.com.full.54273Following the first period of Thursday night’s game against the Vancouver Canucks, Oilers play-by-play commentator Jack Michaels and his co-host Bob Stauffer discussed the team’s struggles, focusing on the poor play of Darnell Nurse. The 23-year old defenceman had been on the ice for three of the four goals against in the first period, having made some poor reads and decisions with the puck in his own zone. What was interesting was that both commentators suggested that Nurse was struggling because of the absence of Kris Russell who has been Nurse’s most common defensive partner this season.

It may sound a little strange considering Russell has historically been a drag on his teammates offensive numbers, consistently posting poor on-ice shot share numbers relative to his team. But this season, it does appear that Nurse is in fact posting better on-ice numbers with Russell as his partner than without him.

Before digging into the numbers, it’s worth mentioning that the warning signs of Nurse’s individual struggles were apparent early in the 2018-19 season and have continued through the first 37 games. Among regular Oilers defencemen this season (those who have played at least 100 minutes), Nurse has the lowest on-ice goals-for percentage at even-strength (5v5) with 43.10% – a goal differential of -8 (25 GF, 33 GA). The team’s possession numbers as well as their share of unblocked shot attempts (a proxy for shot quality) have also been at their lowest this season when Nurse is on the ice – a 47.44% Corsi For percentage and 46.94% Fenwick For percentage.

Full article is at The Copper & Blue.

Mediocrity

coppernblue.com.full.54273After 37 games, the Oilers are 10th in the western conference with a record of 18-16-3. They’ve collected 39 points – a points percentage of 0.527 – and are two points out of a wild card spot.

At even-strength (5v5), the Oilers have a -4 goal differential (64 goals-for, 68 goals-against) – a goal-share of 48.48%, which ranks 20th in the league. The team has struggled offensively, scoring at a rate of 2.15 goals per hour – the sixth lowest rate in the league. The Oilers have a done good job preventing goals – allowing a rate of 2.29 goals against per hour, ninth best in the league – due in large part to some good goaltending that ranks 10th in the league with a 92.44% even-strength (5v5) team save percentage.

On special teams the powerplay (5v4) currently ranks 8th in the league with a goals-for per hour rate of 8.25, and their penalty kill (4v5) ranks 22nd in the league with a goals-against per hour rate of 7.76.

The Oilers’ results after 37 games have them in a playoff race for sure, but there’s really nothing about them that indicates they’re anything better than a wild card team. Almost every metric at even-strength and on special teams has them either at or below league average numbers, suggesting that if they are to have any success it’ll be player/luck driven – either a league leading team shooting percentage or team save percentage.

When it comes to shot-share metrics at even-strength (5v5) like Corsi, which we use as a proxy for possession, and Fenwick, which we use as a proxy for shot quality, they currently rank 16th in the league – 49.86% Corsi For% and 50.26 Fenwick For%. And it’s not like they’re good at either generating shot attempts or preventing them – just around or below league average when it comes to shot rates per hour.

If the results aren’t great and the underlying shot share metrics that we use to predict future results are average, you’d hope there would be something, anything else at even-strength that the Oilers are good at – something that they could build off of. But it just doesn’t exist right now.

The Oilers rank 22nd in the league when it comes to their total share of scoring chances with 48.37%, generating 25.46 scoring chances per hour (19th in the league) and allowing 27.17 scoring chances per hour (21st). Generating high danger shot attempts remains to be a problem for the Oilers, as they rank 25th in the league when it comes to their share of the total high danger shot attempts with 46.31%. They have the seventh lowest rate of high danger shot attempts for with 9.92 and rank 23rd in the league when it comes to preventing them with 11.50.

It’d be nice to point to the Oilers powerplay as a sign of progress, but that hasn’t been the case either. While the Oilers currently do have the eighth best powerplay (5v4) in the league, it’s likely not sustainable and will probably finish closer to league average goal scoring numbers. The team just hasn’t been very good at generating unblocked shot attempts, currently ranking 19th in the league with 67.35 per hour, really struggling with consistency. The team shooting percentage is one of the highest in the league right now and will likely regress toward league average.

The penalty kill (4v5) is one area where the team has done well. The results have been below average as they rank 22nd in the league, but the Oilers do a decent job limiting unblocked shot attempts against sitting sixth in the league with a rate of 61.08 per hour. I’d expect the overall results to improve but only if the goaltending remains consistent.

It really is incredible that the Oilers are in the position they are in considering they’ve had a few seasons to build a team around the best player in the world. I don’t know how any organization – whether it be in professional sports or a real-world business environment – can look at the results and look at the performance drivers under the current management regime and feel confident in their situation going forward.

Data: Natural Stat TrickHockey Reference

Full article is at The Copper & Blue.

CBC Edmonton News (TV): Recent struggles, powerplay and lineup changes

cbc edmonton logoI joined host Kim Trynacity on the CBC Edmonton News for my weekly segment to discuss all things Oilers. Clip is here and starts at the 19:00 mark: CBC Edmonton News (2018, December 20)

Topics we covered:

  • The Oilers recent struggles and what we  can expect going forward
  • The powerplay and the lineup changes we saw in practice this morning
  • The loss of Jujhar Khaira to a two-game suspension and what this means for the team
  • Preview of Saturday night’s game against the Tampa Bay Lightning


Average ice-time per game before and after Hitchcock

oilers-dallas-16w

After watching Milan Lucic play only 11 minutes in all situations on Friday night against the Flyers, it’s become quite apparent that the winger is a fourth-line option for Ken Hitchcock.

Lucic has seen his ice time gradually decrease over the course of this season, and it’s largely his powerplay minutes that have been taken away since Hitchcock’s arrival. He’s still averaging the same minutes per game at even-strength as he did when McLellan was behind the bench, hovering around 11.5 minutes. But it’s on the powerplay where he’s seen his average minutes per game drop significantly from just over three minutes per game down to less than one.

Lucic - Ice time per game - cumulative average

Quick note about the graph above: the cumulative average minutes per game at any given point factors in all of the previous games from that point. So at the 12-game mark, the average minutes per game factors in games 1 through to 12. At the 33-game mark, the average minutes per game factors in games 1 through to 33.

This had me wondering about who else has seen an increase or decrease in their average ice time per game since Hitchcock arrived compared to when McLellan was behind the bench. And in what situations (i.e., even-strength, powerplay or penalty kill) were the players seeing a difference. Ice time is the biggest influence a coach can have on the team – it is currency – and we can quickly get a sense of who the coach trusts and in which situations. Over the course of three seasons we learned a lot about McLellan – how he likes to manage his bench, who his go-to players are, but also where McLellan has his biases and blind spots. With a new coach, we get a fresh perspective on things, and a chance to see players placed in or removed from different situations.

For this analysis I only included players that were on the roster before and after November 20th, 2018 when the Oilers made the coaching change. So players like Evan Bouchard, Kailer Yamamoto, Ryan Strome (who were on the roster before Hitchcock) and Caleb Jones, Chris Wideman and Valentin Zykov (who weren’t on the roster before Hitchcock) were excluded from this analysis.

Below is a list of the Oilers skaters and their change in average ice time per game after Hitchcock became coach by game-state. This table is sorted by the players change in average ice time per game in all situations. I’ve applied a color scale to show which players have seen a positive change (green) and which players have seen a negative change (red) for each of the game-states.

Oilers Ice Time - All Situations - 20181216

Leading the way is winger Alex Chiasson who has had a very productive season so far, and is currently skating on the top line with McDavid and Draisaitl. Since Hitchcock’s arrival, Chiasson has seen a bump in his average ice time per game at even-strength and on the powerplay. And he’s also seeing about half a minute more per game on the penalty kill.

Brodziak and Kassian have also seen more ice time at even-strength, but also on the penalty kill along with Draisaitl. With Strome’s departure and Rieder being out with an injury, it’s not too surprising to see other forwards start filling in more on the penalty kill.

What’s most surprising to me in all of this is that McDavid hasn’t seen as big of a bump in total average ice time – only a minute more since McLellan was dismissed. Hitchcock has commented on how well McDavid recovered on the bench and I had assumed McDavid was seeing or was going to see significantly more ice time.

At the other end are more of the fringe players like Marody and Russell, but also forwards who at one point played regular minutes in the top six group of forwards like Rattie and Lucic. As mentioned earlier, Lucic’s minutes at even-strength (5v5) are about the same as before Hitchcock arrived, but his powerplay minutes are what took a significant hit.

One player whose ice time is worth watching is Nugent-Hopkins. He’s been a solid all-round player for the team this season, and was at one-point leading the team in penalty kill ice time, while at the same time playing significant minutes on the powerplay.

Among the defencemen, Larsson and Gravel have seen the biggest change in total average ice time per game. Both players are averaging more ice time at even-strength, with Larsson also receiving more time on the penalty kill. Nurse has also seen a bump, due in large part to receiving more ice time on the powerplay. And surprisingly, Klefbom has seen a decrease in his average ice time as he’s spending slightly less time on the powerplay and the penalty kill.

It’s only 13 games with Hitchcock behind the bench, but we’re starting to see a change in how things are run based on the average ice time players are receiving. Hard to say if it’ll be for the best – the team is riding some amazing goaltending numbers right now and getting better results, but they’re also posting similar shot-share numbers as before and generating and allowing around the same number of shots per game. It’ll be worth looking into what impact the changes in average player ice time are having on the results (i.e, goal-metrics) and also the underlying numbers to validate the sustainability.

Data: Natural Stat Trick

CBC Edmonton News (TV): Hitchcock’s impact, Klefbom’s injury and previewing tonight’s game

cbc edmonton logoI joined host Alicia Asquith on the CBC Edmonton News for my weekly segment to discuss all things Oilers. Clip is here and starts at the 16:00 mark: CBC Edmonton News (2018, December 13)

Topics we covered:

  • The contributing factors to the Oilers recent success
  • The Oilers team numbers this season, before and after Hitchcock’s arrival
Todd McLellan Edmonton Oilers (2018/19) Ken Hitchcock
20 Games 11
9-10-1 Record 8-2-1
0.475 Points% 0.773
-9 Goal differential +5
31.4 Shots per game 30.2
30.1 Shots against per game 29.5
9.1% Team Shooting% 8.9%
89.1%  Team Save% 92.4%
  • The loss of Klefbom to injury and what impact it will have to the roster.
  • Preview of tonight’s game against the Winnipeg Jets

Data: Natural Stat Trick