A common trend we’ve seen across the league for many years now is how coaches alter their approach depending on what the score is in a game. Trailing in a game, and you can expect the coach to start playing the skilled players a little more and be willing to take on some more risks to create offensive chances. Leading in a game, and teams start to play more conservatively, not really trying anything that could lead to a turn over, and focus more on just keeping the puck out of their own zone.
And we can see this in the data from the previous three seasons. Using Corsi For percentage as a proxy for puck possession, we see how when the game is tied, team’s on average control about 50% of the total shot attempts for and against. When trailing in a game and looking for the next goal, we see that the league average Corsi For% jump to 55%. And when they’re leading, teams tend to take their foot off the gas, not trying to create too much, and we see the league average Corsi For% drop to around 45%. In the graph below, these league-average levels are indicated by the orange line. And for context, I also added the league-high (blue line) and league-low (grey line) Corsi For% for each game-state to show the range.
Protecting the lead
The way coaches approach things when their team is leading in a game isn’t all too suprising considering the majority of them are fairly risk-averse. And they would rather their players play a simple game and not do anything that could jeoparidize their lead. What’s interesting is that in his first fourteen games as head coach of the Edmonton Oilers, Jay Woodcroft seems to have a different approach and appears to be pushing his team to continue generating offence even with a lead. A stark contrast to the previous three head coaches the Oilers have had since 2015.
The table below has the same three lines as the previous graph showing the range of Corsi For% across the league when a team is leading in a game, tied or trailing. Added to the graph now are bars to represent the previous coaches the Oilers have had and what the Oilers Corsi For% was under them in different game states.
What we see here is that when Todd McLellan, Ken Hitchock or Dave Tippett were coaching, the Oilers followed the usual trend. They would push for offence at a league average rate only when trailing in a game, and saw a significant drop in their puck posession numbers when leading in a game. Hitchcock especially had the Oilers pretty much playing in a defensive shell posting some of the lowest posession numbers in the league when the score was tied or when the Oilers were leading.
What stands out here are the Oilers numbers when they’ve been leading in games under Jay Woodcroft. While the average team posts a Corsi For% of 45% when leading the score, the Oilers are posting one of the highest possesion numbers in the league with 54%. They appear to be pushing for offence, opting to control the flow of play and put pressure on opponents as a way to stifle any chances against. It’s a riskier way to play, but makes sense considering it’s what the top teams in the league do. This season, eight of the top ten teams in terms of Corsi For% when leading have a points percentage above 0.600, and includes Florida, Calgary and Colorado at the top.
I’d be curious to hear Woodcroft’s thoughts on the matter and if he does have a different perspective on how best to protect leads, especially with so many critical games coming up. And if this changes the type of players Holland and his scouting staff start targeting in the off-season.
The Edmonton Oiler’s special teams has become a drag this season, something I don’t think fans were expecting considering how much of a positive impact it has had on the overall results over the previous two seasons.
When you combine the goals for and against on the powerplay and the penalty kill this season, the Oilers special teams has posted a -1 goal differential, which is right around league average. That’s a significant drop from last season when the Oilers special teams posted a +19 goal differential, the highest in the league. The year before that, their special teams was +21 and tied for first in the league. Without a doubt, the Oilers special teams is the reason why they finished second in their division in 2019/20 and 2021, considering how poor their even-strength (5v5) goal-differential was in both of those seasons (-16 in 2019/20 and -1 in 2020/21). Since the Oilers full-season goal differential at even-strength (while improving under Woodcroft) is still poor sitting at -5, they desperately need their special teams to be better than league average if they have any hopes of clinching a playoff spot.
Penalty kill
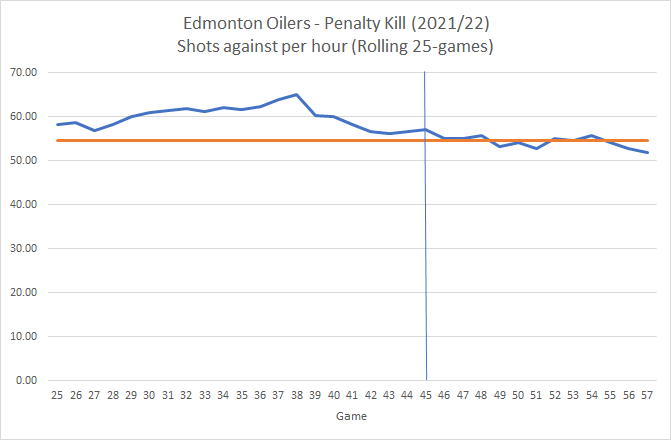
The Oilers are currently allowing the sixth highest rate of goals against in the league on the penalty kill (8.91 per hour) and only ahead of Detroit, Montreal, Arizona, Seattle and Vancouver. And this is largely due to their goaltending which has posted a 84.53% save percentage that ranks 26th overall.
The Oilers have actually done a decent job in front of their goaltending, allowing a near-average rate of shot attempts and shots on goal against. And these numbers have gradually been improving. Under Dave Tippett, the Oilers allowed 58.47 shots against per hour, slightly higher than the league average rate of 54.67. Under Woodcroft, the Oilers are now allowing 55.38 per hour.
The problem is the goaltending has consistently been poor this season. Koskinen has an 84.50% save percentage, ranking 47th among 62 goalies who have played at least 50 minutes, while Smith ranks 56th with an 82.1% save percenatge. While both goalies did post solid penalty kill save percentages over the previous two seasons, Oilers management should have expected an eventual drop-off considering the age of both netminders and the increased potential for injuries and the extended recovery times necessary. Unfortunately, this is what happens when managers lack an understanding of player-aging-curves and fail to address key issues in the off-season.
Powerplay
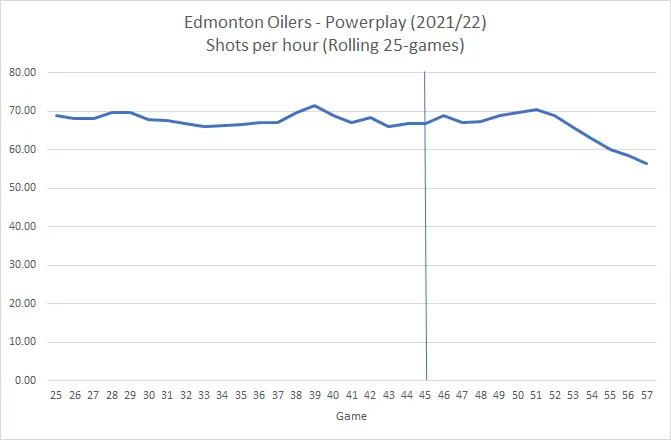
Over the full season, the Oilers powerplay has scored at a rate of 9.44 goals per hour, ranking fifth in the league and just slightly below the rate of goals they scored over the previous two seasons, leading the league with 10.60 per hour. The Oilers had a great start to the season but have since been in a steady decline with the Oilers generating only 6.41 goals per hour since Woodcroft was hired – one of the lowest rates in the league. The graph below breaks out the Oilers season into rolling 25-game segments and shows the rate of powerplay goals per hour, with the vertical line indicating when the coaching change occurred.
A big reason why the Oilers powerplay has dropped off is their declining rate of shots and scoring chances. Prior to the coaching change, the Oilers were generating over 69 shots per hour – the highest in the league and well above the league average rate of 54.66 per hour. But since Woodcroft’s arrival, the rate of shots has dropped down by 29.5% falling to 48.64 per hour.
The issue here is that the Oilers are really missing Ryan Nugent-Hopkins.
The Oilers have historically seen their rate of shots on the powerplay drop whenever Nugent-Hopkins isn’t on the ice, and that’s even with McDavid and Draisaitl on the ice. Over the previous two seasons, McDavid and Draisaitl have played 52 minutes without Nugent-Hopkins with them and saw their on-ice rate of shots-for drop by 23.8% – going from 64 shots per hour when the trio is together to 49 shots per hour without Nugent-Hopkins.
The same drop-off has occurred this year with the rate of powerplay shots dropping by 16.3% when McDavid and Draisaitl haven’t had Nugent-Hopkins with them, going from 71 shots per hour down to 60. Nugent-Hopkins has missed 11 games this year, and in the 100 powerplay minutes the Oilers have played without him the team has seen a major drop in productivity scoring at a rate of 6.54 goals per hour – a stark decline from the 11.28 goals per hour the Oilers have scored when he’s been on the ice.
While the Oilers can’t predict when injuries will hit, they should be aware of the fact that Nugent-Hopkins is starting to creep into the tail end of his career, having played 701 NHL games now and becoming more susceptible to injuries. And they should also be aware of the positive impact he’s historically had on the powerplay and planned on what to do if they’re ever without their powerplay witch. Again this comes down to management’s ability to regularly analyze their on-ice results, conduct sound player evaluation and intergrate as much information as possible into their decision-making process. The powerplay can still be fixed, but Ken Holland and his staff are once again taking a reactive approach instead of proactively trying to get ahead of issues before they come up and derail a season.
If the special teams is what costs the Oilers a playoff spot, management will have only themselves to blame.
I joined Rod Kurtz on CBC Radio Active to talk about the Oilers and their performance thus far under Jay Woodcroft. Full segment is here: CBC Radio Active (2022, March 7)
Topics we covered:
What the Oilers have done well since Jay Woodcroft’s arrival as head coach, and the key underlying numbers. We referenced the article I wrote last week.
The deployment of 11 forwards and seven defencemen, and what impact it’s having on the top end players.
Goaltending and why Skinner should get some starts soon.
Evander Kane’s results and some of the underlying numbers that might be of some concern.
Thanks as always to the great team at CBC for putting it all together!
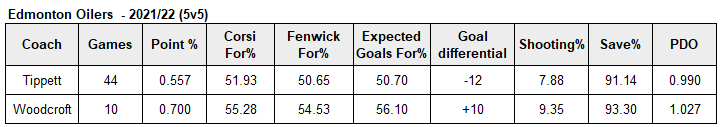
The Edmonton Oilers have been very good so far under Jay Woodcroft, with strong on-ice results supported by excellent underlying numbers. The Oilers have outscored opponents 36-25 in all situations, and have been exceptional at even-strength (5v5), posting a +10 goal differential and shot-share metrics that would be in line with the top teams in the league.
At even-strength, the Oilers have been posting a slightly higher team shooting percentage, converting on 9.35% of their shots, and getting better goaltending over the last ten games, posting a team save percentage of 93.30%. I’d expect both numbers to regress towards league average levels, especially the goaltending which is always at risk of falling off completely considering the age of the goaltenders and managament’s inability to properly address their issues. Regardless, because the Oilers are controlling the flow of play as indicated by their 55% Corsi For% and their ability to create higher-quality chances more frequently they may be able to overcome some of their roster deficiencies.
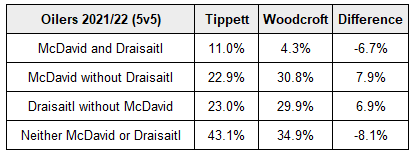
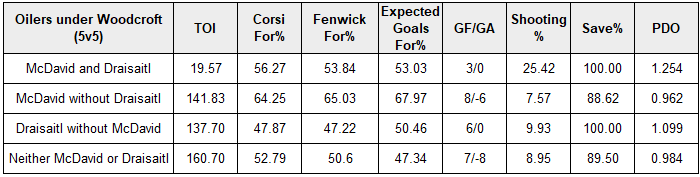
One thing I’ve wondered about over these ten games is how ice-time is being distributed among forwards with Woodcroft going with an eleven-forwards and seven-defencemen (11F/7D) approach. Specifically, I wanted to know how the depth forwards would be impacted because of the coaching change. The table below shows four different scenarios of player deployment this season and what percentage of the team’s total ice time it has occurred with Tippett behind the bench running the standard 12F/6D structure and with Woodcroft running the 11F/7D.
What we see here is that the percentage of the team’s ice time without one of the top two star players has dropped 8.1%, meaning the depth players are getting deployed less often and the top two lines getting a higher proportion. Considering the lack of depth talent and the need to give the young defencemen more ice-time, it’s understandable that Woodcroft would go with an 11F/7D format and give his star players a higher share of ice time. The main concern with this of course is burning out McDavid or Draisaitl and putting them at risk for injury, which would put any sort of deep playoff run at risk. We know how critical forward depth is for teams, so it would not surprise me if the Oilers try to address this at the trade deadline.
It’s worth noting too that a lot of the team’s recent success under Woodcroft has been driven by McDavid and Draisaitl (shocking, I know), although the latter could see his on-ice success diminish eventually.
In these last ten games, the Oilers have been outshot and outchanced quite regularly with Draisaitl on the ice but the goaltending has been excellent, stopping everything. Hopefully when the goaltending does come back to expected levels, which could be below average, the team can make up for it on the other end of the ice and go on a shooting percentage heater – something we’ve seen happen with Draisaitl in the past.
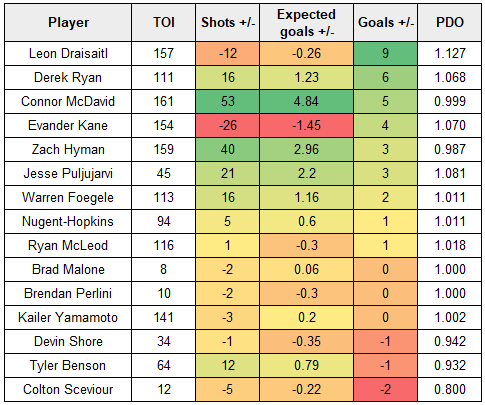
The other player who might be of concern to the coaching staff is Evander Kane, Draisaitl’s regular line-mate that could be dragging down Draisaitl’s on-ice shot-share numbers at even-strength. Below is a snap shot of the Oiler forwards from the last ten games, sorted by their on-ice goal-differential and includes their on-ice shot differential and expected goal differential.
With Kane on the ice, the Oilers allow more shots and scoring chances, but he’s also been the beneficiary of the team’s goaltending heater. And when Draisaitl has been away from Kane, his on-ice shot-share numbers improve from a Corsi For% of 45.32% in 123 minutes together, to a Corsi For% of 61.64% in 33 minutes. Kane also sees his Corsi For% increase when playing without Draisaitl as well, so it’s more likely just a bad line-pairing for both players. Regardless, it’d be wise of the coaching staff to tinker with the line combinations sooner rather than later and figure out what will improve the odds of out-scoring opponents, especially when their on-ice PDO’s come back down to earth.
With playoff positioning on the line and the trade deadline coming up in three weeks, it’s a good time to compare the Edmonton Oilers to the rest of the Western conference.
After 53 games, the Oilers have a 0.575 points percentage (with a record of 29-21-3), which ranks fourth in the Pacific, ninth in the Western conference and just outside of a wild card playoff spot. The good news is that things have been trending upwards for the Oilers since Jay Woodcroft and Dave Manson replaced Dave Tippett and Jim Playfair, but there remains some areas of concern that could derail the Oilers playoff push.
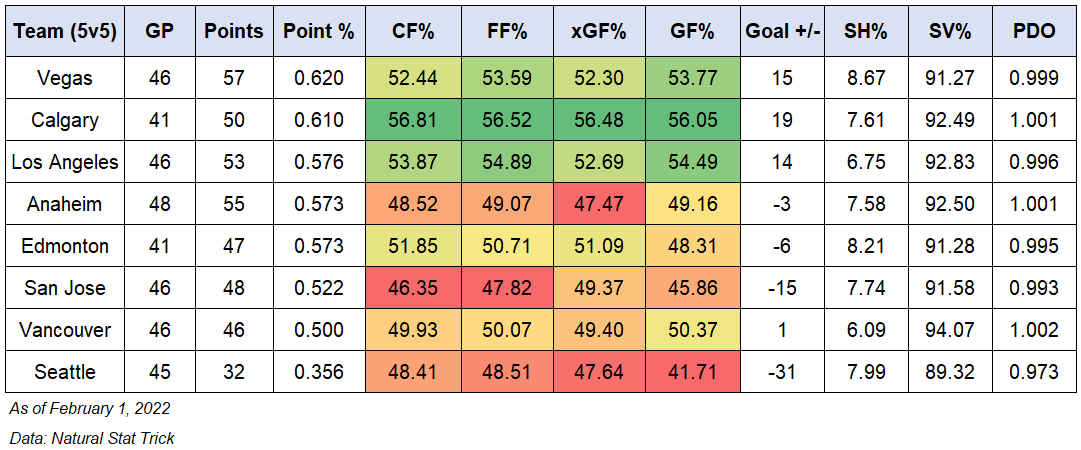
Below is a table of the western conference teams sorted by their points percentage as of February 28th, 2022. I’ve included each team’s even-strength (5v5) results as reflected by goals for percentage (GF%) and goal differential, as well as the underlying shot-share metrics such as Corsi For% to measure how well the Oilers as a team control the flow of play, as well as Fenwick For% and Expected Goals For% to gauge how well they control the overall share of scoring chances. Team shooting percentage and team save percentage has also been included to capture the player-driven factors that may be impacting the overall results. A glossary can be found at the end of this article.
I’ve also included each team’s special teams results, combining the goals for and against on the powerplay and penalty kill (Goals +/-). The shot differential (Shots +/-) gives us a sense of which teams are doing the right things tactically and process-wise, but may be getting sunk by a lack of finishing ability on the powerplay or poor goaltending on the penalty kill.
The good news for the Oilers is that they’ve been playing much better at even-strength (5v5) since Jay Woodcroft and Dave Manson replaced Dave Tippett and Jim Playfair, with the team posting a 55.85% Corsi For percentage, a 55.84% Expected Goals For percentage and a +9 goal differential in their first nine games behind the bench. It’s early, but so far the Oilers are generating about two more shots per hour and allowing four fewer shots per hour at even-strength since the coaching change.
Over the course of the regular season, the Oilers have been gradually improving when it comes to shot-share metrics at 5v5 hovering around the break-even 50% mark, but there’s been a definite uptick recently as indicated in the graph below. Breaking the season into into rolling 25-game sections, we see that the Oilers are now hovering around the 54% mark, which is where the top contenders hover over the course of a full season.
What stands out here is that while the Oilers did post a Corsi For% of 52% at the time of Tippett’s firing, the team barely broke even in terms of Expected Goals For%, indicating that while they were generating more shot attempts than their opponents, they couldn’t convert those into quality chances. Likely because those shot attempts were coming from low-probability scoring areas. Under Woodcroft, the team is not only possessing the puck more often as indicated by their 55.85% Corsi For percentage, but they’re also creating better scoring opportunities for themselves more often. Something worth monitoring to see if the Oilers can maintain this kind of productivity, and if management recognizes the impact the coaching change has had on the team.
The concern with Edmonton remains goaltending, which ranks 14th in the western conference in terms of save percentage (91.31) at even-strength – only ahead of Arizona and Seattle. The team is playing so much better up front, it would be a shame if goaltending is what costs them a playoff spot or a deep playoff run. The problem, as I’ve written about a few too many times now, is that the Oilers current management group under Ken Holland (a) doesn’t know how to properly evaluate goaltending, and (b) doesn’t have the assets, creativity and salary-cap management skills to solve their short-term and long-term problems in net.
And with special teams, the Oilers are no longer anything special – again thanks to their goaltending. The powerplay is still generating the second highest rate of goals in the league, scoring 10.14 goals per hour, and continue to generate the highest rate of shots. But the penalty kill is allowing the sixth highest rate of goals against (8.70), pretty much giving back everything the powerplay has created. And despite allowing an average rate of shots against, the Oilers team save percentage on the penalty kill ranks 25th in the league and 13th in the western conference, just ahead of Los Angeles, Dallas and Vancouver.
Put another way: if the Oilers received league-average goaltending, they would have allowed seven fewer goals at even-strength (5v5) and four fewer goals on the penalty kill. Stopping 11 goals would have the Oilers higher up in the standings, closer to second place in their division, rather than on the wild card bubble.
When comparing the Oilers full regular season to the rest of the western conference, it’s clear that they’re in the mushy middle – not quite good enough to be cup contenders but also not bad enough to be a draft-lottery team. But when looking at which way the Oilers are trending with a new head coach, it does make you wonder where the team could have been at this point had they made the coaching change right after they were swept by the Jets in the 2021 playoffs. And if they could have avoided some of the poor signings and trades they made in the following off-season – many of which appear to have been influenced by the previous coaching staff.
For now, the Oilers are in a tight playoff race with teams that have their own strengths and weaknesses. Vegas for instance has great shot-share numbers at even-strength, but the goaltending has been poor, just barely better than Edmonton’s. Los Angeles is similar to Vegas at even-strength, but their special teams are weak. Dallas has average shot-share numbers at even-strength, but are getting good goaltending and producing well on the powerplay. Nashville is similar to Dallas in terms of even-strength play, but have the fifth best team save percentage. It’s clear that the margin for error is pretty thin, which should make for a pretty entertaining playoff race. It’s just unfortunate that we’re having to talk about wild-card positioning at this point rather than a divison title.
Points-percentage (Point%) – The total points accumulated divided by the points that were available, including extra time.
Corsi For percentage (CF%) – The proportion of all the shot attempts the team generated and allowed that the team generated (i.e., Corsi For/(Corsi For + Corsi Against). This is used as a proxy for possession and is the best at predicting a team’s future share of goals (GF%). (Source: Hockey Great Tapes – Draglikepull)
Fenwick For percentage (FF%) – The proportion of all the unblocked shot attempts the team generated and allowed that the team generated (i.e., Fenwick For/(Fenwick For + Fenwick Against). This is used as a proxy for shot quality and considers shot blocking a repeatable skill.
Expected Goals For percentage (xGF%) – This is a weighting placed on every unblocked shot based on the probability of the shot becoming a goal. This depends on the type of shot, location and uses historical shot and goals data to come up with the probability for each unblocked shot.
Goals For percentage (GF%) – The proportion of all the goals that the team scored and allowed that the team generated (i.e., Goals For/(Goals For + Goals Against).
Shooting percentage (SH%) – The percentage of the team’s shots on goal that became goals (i.e., total goals divided by the total shots on goal).
Save percentage (SV%) – The percentage of the team’s shots on goal against that were saved (i.e., 1-(totals goals allowed divided by the total shots on goal against).
Joined by Bruce Curlock (@bcurlock) on the show to talk about the Edmonton Oilers coaching change and what to expect from the team with Jay Woodcroft and Dave Manson behind the bench. Bruce shared some great insight on the Bakersfield Condors development program and which prospects to keep an eye on. We also discussed the Oilers’ current needs, what needs to go right for them to make the playoffs and why analytics needs to be part of the decision-making process this off-season.
I joined Rod Kurtz on CBC Radio Active to talk about the firing of head coach Dave Tippett and assistant coach Jim Playfair, what led to their dismissals and what to expect from Jay Woodcroft and Dave Manson. Full segment is here: CBC Radio Active (2022, February 10).
Topics we covered:
The timing of the firing, with the Oilers about to begin a crucial stretch of games.
Tippett’s recent decision to start goaltender Mike Smith in back-to-back games, and why that was a bad idea. Referenced this 2013 article from Broadstreet Hockey, written by a blogger who is now an assistant general manager in Carolina.
What to expect with Jay Woodcroft behind the bench and the impact he and Dave Manson have had on the development of key prospects in the Oilers system.
Thanks to the team at CBC for putting it all together!
Joined by Michael Parkatti (@mparkatti) to talk analytics and how NHL teams like the Edmonton Oilers can integrate some of the best-practices out there into their decision-making processes. Michael shared his experience getting into hockey analytics, including winning the Oilers Hackathon event in 2013 and actually getting to work with the Oilers. We also talked about how analytics is used in the real-world by competitive organizations, what the Oilers would need to do get started and how to get the most out of an analytics department.
At the half-way point of their regular season, the Edmonton Oilers are tied with Anaheim for foruth place in the Pacific dvision with a 0.573 points percentage.
The table above contains the even-strength (5v5) numbers for each team in the Pacific division (sorted by points percentage) including goal-share results as well as the shot-share metrics that gives us a sense of which teams have the right processes in place and if the results are sustainable or not. I’ve also applied a basic heat-map to show which teams are doing well or struggling relative to their division foes. You can find a description of each metric at the end of this article. Also note that the shot-share metrics are score and venue adjusted based on Natural Stat Trick’s methodology.
Since my last check-in in late December 2021, Vegas and Calgary have switched spots in the Pacific while Los Angeles has jumped over Anaheim and Edmonton. Not too susprised about that considering the Kings have been playing well at even-strength, controlling the flow of play, and consistently getting better goal-share results than Edmonton and Anaheim.
The battle for third, fourth and fifth in the Pacific is really going to come down to each club’s special team units. Edmonton’s powerplay continues to be one of the best in the league, while their penalty kill is struggling. Anaheim is doing well in both areas. And the Kings aren’t good at either.
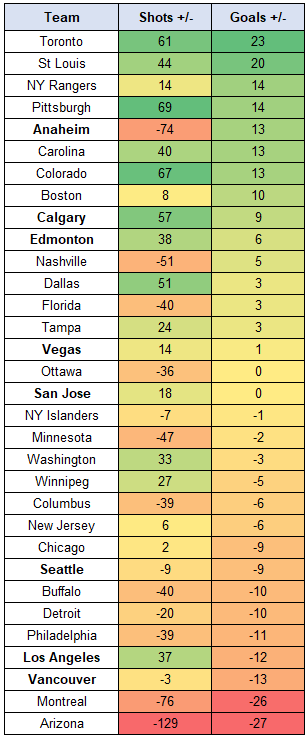
The table to the right is sorted by every team’s special-teams goal differential – basically adding up all of the goals scored and allowed on the powerplay and penalty kill. I’ve also included each team’s shot differential, and applied a basic heat map. The Pacific division teams are in bold.
Edmonton currently ranks 10th in the league thanks in large part to their powerplay, and it’s safe to assume they’ll be in this range considering they do a good job of generating shots and scoring chances. Anaheim stands out for a couple reasons. They’re obviously getting excellent results, posting a combined special-teams goal differential of +13 – fifth best in the league. But they don’t do a good job generating shots on the powerplay or preventing shots on the penalty kill – ranking 30th in the league.So it’ll be interesting to see if they can sustain their positive goal-differential results.
Los Angeles stands out here as well. Their results have been poor, ranking 29th in the league here. But they do a decent job generating shots on the powerplay and preventing shots on the penalty kill. Again, something to watch for over the last half of the season if they can get some saves on the penalty kill.
Points-percentage (Point%) – The total points accumulated divided by the points that were available, including extra time.
Corsi For percentage (CF%) – The proportion of all the shot attempts the team generated and allowed that the team generated (i.e., Corsi For/(Corsi For + Corsi Against). This is used as a proxy for possession and is the best at predicting a team’s future share of goals (GF%). (Source: Hockey Great Tapes – Draglikepull)
Fenwick For percentage (FF%) – The proportion of all the unblocked shot attempts the team generated and allowed that the team generated (i.e., Fenwick For/(Fenwick For + Fenwick Against). This is used as a proxy for shot quality and considers shot blocking a repeatable skill.
Expected Goals For percentage (xGF%) – This is a weighting placed on every unblocked shot based on the probability of the shot becoming a goal. This depends on the type of shot, location and uses historical shot and goals data to come up with the probability for each unblocked shot.
Goals For percentage (GF%) – The proportion of all the goals that the team scored and allowed that the team generated (i.e., Goals For/(Goals For + Goals Against).
Shooting percentage (SH%) – The percentage of the team’s shots on goal that became goals (i.e., total goals divided by the total shots on goal).
Save percentage (SV%) – The percentage of the team’s shots on goal against that were saved (i.e., 1-(totals goals allowed divided by the total shots on goal against).
I joined Rod Kurtz on CBC Radio Active to talk about the Oilers and their downward spiral since December. Full segment is here: CBC Radio Active (2022, January 19).
Topics we covered:
Leon Draisaitl’s recent comments and his exchange with beat reporter Jim Matheson.
How to best address the Oilers goaltending issues.
The underlying numbers over the last 15 games, which includes only three wins and two six-game losing streaks.
The changes needed behind the bench and especially the front office.
Thanks to the team at CBC for putting it all together!
:no_upscale()/cdn.vox-cdn.com/uploads/chorus_asset/file/23308666/GameStateCF.png)
:no_upscale()/cdn.vox-cdn.com/uploads/chorus_asset/file/23308719/GameStateCF___EO_history.png)