Looking forward to what should be an entertaining western conference final between the Edmonton Oilers and Dallas Stars.
Both clubs had great generated plenty of offence in the regular season, each consistently near the top of the league in terms of shot and scoring chance rates in all situations. And that translated into plenty of goals, with Dallas finishing with the third highest rate of goals per hour (3.54) and Edmonton finishing fourth (3.53). Both teams also had excellent results on the powerplay, with Edmonton finishing with the second highest rate of goals (10.53 per hour), while Dallas finished fifth (9.15 per hour). And a lot of their strengths from the regular season are transferring to the playoffs.
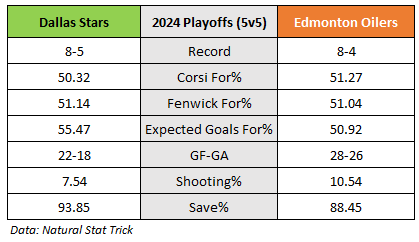
Here’s how both teams have performed so far in the 2024 playoffs at even-strength. Pretty evenly matched clubs, with Dallas having the upper-hand when it comes to goaltending. Dallas appears to be struggling to score goals, which is a little odd considering their shooting percentage over the regular season was one the best in the western conference (9.33 percent). Should note, however, that over the final twenty five games of their season, the Stars did see their shooting percentage slip a little, so maybe we shouldn’t be too surprised.
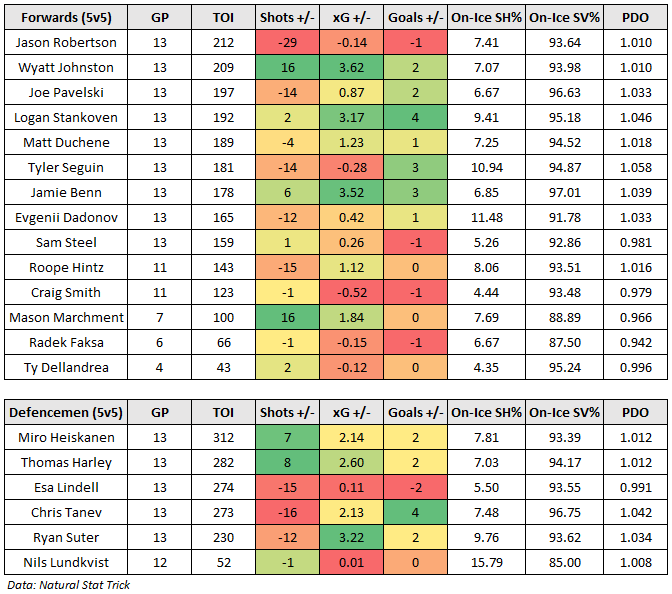
And here’s a quick glance at how the Dallas Stars skaters have performed in their first two rounds.
Interesting to note that while Tanev is having excellent results, he and Lindell could potentially be exploited by the Oilers top line players as the Stars tend to allow a lot of shots and chances with them on the ice. The Stars top defensive pairing is going to be lethal, so I’m curious to see how Knoblauch runs the forward lines with last change at home in games three and four.
It’s been a bit of a roller coaster for the Edmonton Oilers in this series against the Vancouver Canucks. They’ve blown leads in one game, and then scored a winning goal in the final minutes of another. They’ve been completely outplayed one game and then bounced back with a dominant performance the next.
The good news for Edmonton is that there are reasons for optimism heading into game seven. They’ve controlled the flow of play at even-strength (5v5), generating a higher share of shots and scoring chance. The powerplay has been generating a lot of offence and producing at a good clip. And the goaltending appears to finally be stabilizing as their save percentage has been at league average (90%) or better the last three games.
Below is a summary of how the two teams have performed at even-strength after six games, and what their actual results have been. The Oilers hold the edge when it comes to shot-share metrics, posting a 58 percent Corsi For percentage and a 52 percent Expected Goals For percentage. This has them at the top among the other second round teams. Because both teams have had issues in net, the Canucks and Oilers rank first and second, respectively, among the second round teams when it comes to shooting percentage.
Special teams is where the Oilers have outperformed the Canucks as the powerplay continues to be excellent – generating a high rate of chances and scoring five times this series, which translates to a rate of 10.50 goals per hour. This is almost identical to their powerplay scoring rate during the regular season (10.53), which ranked second highest in the league. The Oilers penalty kill has also been excellent, allowing only three goals in six games – a goals against rate of 5.83 per hour. The good news is that their penalty kill results appear to be sustainable as the club has allowed only 21 shots against in six games, a rate of 40.78 per hour, which is one of the lowest among the second round teams.
Here’s a quick glance at how the Oilers skaters have done this series.
Good to see that Nurse and Ceci have been split up as the two have been posting terrible shot-share numbers together for quite some time. Nurse’s overall minutes at even-strength have been reduced, which I think has helped his performance numbers improve. It’s also interesting to see the negative impact Ceci is having on Kulak now.
Up front, there’s plenty of positives especially among the top two lines. They’re consistently out-shooting the Canucks and they should be due for some more 5v5 goals – especially Draisaitl. I do wonder if we’ll see McLeod break out of his scoring funk. The good news for him is that the Canucks struggle to generate shots and goals when he’s on the ice, so his value remains high.
I’d expect the Canucks to really leverage their last-change, and target the Oilers bottom two lines in game seven. Not a lot going on for the Oilers when McDavid or Draisaitl are on the bench as they’ve been outscored 4-2 in 134 minutes at even-strength without their two star players. The Oilers depth players are doing a good job outshooting the Canucks (52-44), but aren’t getting shots from dangerous areas – resulting in an on-ice shooting percentage of only 3.85 percent.
And here’s how the Canucks skaters have fared this series.
The top of their order is having a rough time, with Miller’s first line spending a lot of time against McDavid’s line and spending more time without the puck. Pettersson is the one bright spot among the forwards, and does appear to be gradually improving. He along with Hoglander are more noticeable, and could be the tandem to watch in game seven – especially with Boeser expected to be out of the lineup. Getting them away from the Oilers star players and against the Oilers depth players could be key.
Had the pleasure of joining host Judy Aldous on CBC’s Alberta at Noon radio program on Friday afternoon. Got to talk Edmonton Oilers, hockey fandom, and much more.
Enjoyed this a lot as I got to spend the full hour on the show and cover a bunch of great topics.
It’ll be interesting to see what the pace will be like in the upcoming second round series between the Edmonton Oilers and Vancouver Canucks. The Oilers are coming off a five-game series against the Kings, where the two clubs posted some of the highest rate of shots and goals among the first round teams. And the Canucks are coming off a six-game series against the Predators where shots and goals were hard to come by. Considering the Canucks were consistently posting some of the highest rates of shots during the regular season, I’d expect their offensive game to bounce back, especially against an Oilers team that has some deficiencies and likely isn’t going to be blocking shots at the same rate the Predators were.
I don’t think it’ll be enough though to knock-off the Oilers who have a lot of firepower up front. The star players are healthy. Their powerplay is clicking. And the goaltending, while not great, has been good enough. What the Canucks can really take advantage of is the drop-off in shot-share numbers and results when McDavid isn’t on the ice at even-strength. In the six game series against the Kings, the Oilers outscored the Kings 6-3 with McDavid, but were outscored 6-9 without him. These poor results were largely driven by the fact that the Oilers spent a lot of time without the puck, posting a 41% Corsi For percentage and an Expected Goals For percentage of 43%.
Here’s how the Oilers skaters performed at even-strength against the Kings.
Up front, there’s a little concern with the second line, but Draisaitl tends to outperform his shot metrics in the playoffs. There’s still a risk that his results eventually take a hit, especially since he’s spending a lot of time without the puck. Nugent-Hopkins and Kane were also on the ice for a lot of shots against, and could be a target for the Canucks as they’ve struggled off and on during the regular season. Foegele had some poor results as well, and was gradually demoted as the series wore on, so it’ll be interesting to see if he bounces back. McLeod is going to be critical once again as he’s done really well playing against top competition and holding his own in terms of shot differentials.
The big area for concern is that Nurse-Ceci tandem, who played primarily with Draisaitl’s line. Expect to see the Canucks go after these two, especially on the forecheck to create turnovers. Also a little leery about the Canucks goaltending being the difference maker at even-strength. Silovs hasn’t played a lot during the regular season, and I would argue is better rested than Skinner. He was excellent against the Predators, and could easily go on a heater here.
And here’s how the Canucks skaters did at even-strength against the Predators in the first round.
Miller, Boeser and Hughes were the play drivers in that first round, and it’s interesting to see that Hughes actual results were lower than expected. The Canucks also got some good results from their depth players with Suter posting a +3 on ice goal differential. Pettersson is getting a lot of negative attention for his poor results, but if he’s healthy he should bounce back, along with Hoglander – his most common linemate in the first round. Both players finished the regular season with some of the best on-ice numbers among the Canucks forwards. The Canucks bottom pair defencemen appear to be the weak links – something the Oilers depth needs to take advantage of. I’m also not convinced about Zadorov, as he posted pretty poor on-ice numbers to close the regular season.
Here’s the Canucks skaters performed over the final twenty five games of the season.
Should be an interesting matchup. Plenty of skill among both teams and potential for a higher-paced series.
With the Edmonton Oilers set to face off against the Vancouver Canucks in the second round, I wanted to get a sense of how each team’s special teams have performed in the regular season and this year’s postseason. Both teams finished at the top of Pacific Division table in the regular season, largely due to their dominance at even-strength (5v5). The Canucks posted the second-best goal-share in the league (57.89 percent, +51 goal differential), while the Oilers ranked fifth (55.78 goals for percentage, +40 goal differential). So the difference in this upcoming series could come down to how well each team executes on special teams.
So far in the playoffs, the Oilers have been absolutely dominant on the penalty kill. They didn’t allow a single goal in the 24 minutes they were short-handed against the Los Angeles Kings in their five-game series. This was largely because they limited the Kings to only 16 shots in total. That translates to a rate of 40.20 shots per hour, which ranked 13th in the playoffs. The Kings weren’t great at generating powerplay shots during the regular season – ranking 27th in the league with 49.05 shots per hour – so it wasn’t overly surprising to see them struggle against an Oilers club that allowed the sixth lowest rate of shots against and had league average goaltending. And this is an area where the Oilers might have an edge over the Canucks.
In their first-round series against the Nashville Predators, the Canucks powerplay generated only 10 shots in about 21 minutes (28.35 per hour) and scored twice. This wasn’t overly surprising, considering the Predators’ penalty kill allowed the tenth-lowest rate of shots against in the regular season (52.05) and really suffocated the Canucks in all aspects of the game. The Canucks powerplay has to be better to overcome the Oilers penalty kill. Still, it’s hard to have too much confidence in them when they generated a league-average rate of shots on the powerplay during the regular season. Not expecting the Oilers penalty kill to have another stretch where they allow zero goals – but they have a good chance of being a difference-maker against a Canucks powerplay that is struggling to create opportunities.
The Oilers’ powerplay should also continue to do well in the second round, but they might not post the same numbers that they did against the Kings. The Oilers’ powerplay really had their way in the first round, posting the highest rate of shots and leading the league with nine goals in 27 minutes. This wasn’t overly surprising since the Kings, while having excellent results on the penalty kill during the regular season, had some underlying issues that indicated their results weren’t sustainable. The reasons for the Oilers’ success are obvious: they’re running with the same cluster of players who are healthy and have had great results over a long time together. And there’s little reason to believe that the Oilers’ powerplay would stall in the second round.
The Canucks penalty kill, however, should put up a better fight against the Oilers than the Kings did. The Canucks posted the third-lowest rate of shots among the first-round teams and allowed only two goals . And while they hovered around league-average levels when it came to shots against and goals against during the regular season, the Canucks penalty kill really improved over the final twenty-five games before the playoffs.
Below is the Canucks rate of shots against on the penalty kill during the regular season, over rolling twenty-five game periods. The blue line across represents the league-average rate of shots against during the regular season (55.05 per hour).
While the Canucks hovered around league average rates of shots against for most of the year, they posted a rate of 44.91 in their final twenty five games – which was the sixth lowest rate in the league. The rate of shots against is something that the coaching staff can control through tactics and player deployment, so I’d be interested to know what adjustments’ they made that helped drive their performance. It’ll be interesting to see how they perform against an Oilers powerplay that’s red-hot, and if they’ll at least be able to limit the shots and chances against.
After four games, and the Edmonton Oilers up 3-1 in the series against the Los Angeles Kings, I wanted to get a sense of how the teams have compared and what each teams strengths and weaknesses have been across their respective rosters.
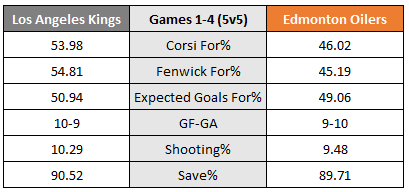
Let’s start with even-strength (5v5), where the Kings have the slight edge in results, outscoring the Oilers 10-9. And while the Kings have controlled the total share of shot attempts and unblocked shot attempts, things are a lot closer between the two teams when you factor in shot quality, type and location. The Kings are creating shots from anywhere and everywhere, posting a Corsi For percentage of 53.98 percent. But their expected goal-share of 50.94 percent is only slightly better than Edmonton’s. Maybe the Kings’ shot-volume approach eventually creates more havoc in the Oilers’ zone, puts more pressure on Skinner and the defencemen, and creates more high-danger chances. For now, the Oilers don’t seem to have a problem limiting the Kings and can hopefully put them away soon.
Special teams are where the games are currently being won, as the Oilers have scored eight powerplay goals and allowed zero on the penalty kill. The Kings have only mustered 15 shots in 22 powerplay minutes, while the Oilers have 35 powerplay shots in 19 minutes. The special team’s results haven’t been close, and it doesn’t appear the Kings will be able to turn it around based on their underlying shot metrics.
Below is a breakdown of each player’s on-ice numbers at even-strength in the first four games, sorted by time on ice. I’ve split the table into forwards and defencemen and added a simple heat map to show how each player compares relative to their teammates.
Starting with Edmonton, we see that the top line, featuring Connor McDavid and Zach Hyman, along with the pairing of Evan Bouchard and Mattias Ekholm, have been the drivers. The four have played 41 minutes together at even-strength so far and, as a group, have posted a 55.53 percent Corsi For percentage, a 74.88 (!) Expected Goals For percentage while outscoring the Kings 4-1.
Ekholm and Bouchard have been primarily with the McDavid line, while Darnell Nurse and Cody Ceci have been tied to Leon Draisaitl and whoever has been rotating through that second line. In 31 minutes together this series, Nurse, Ceci and Draisaitl have posted a 28.11 Corsi For percentage, a 16.39 Expected Goals For percentage and broken even in terms of goals (1-1). Those are some horrible shot-share numbers together, which makes me think Draisaitl should probably get some more minutes with Ekholm and Bouchard. And have Nurse and Ceci play a little more with McDavid.
Nugent-Hopkins is another player who is struggling at even-strength, posting the worst shots and expected goals differential on the team, and could be one of the reasons the second line is getting caved in so badly. I think it might benefit Draisaitl if he can have McLeod back on his wing to add some speed and puck-retrieval skills, along with Foegele. That trio performed really well in the regular season, and could improve the chances of them outscoring the Kings. But because McLeod is doing an excellent job shutting down the Kings as a center, we probably won’t see him move to wing.
Speaking of which, here’s how the Kings skaters have performed so far at even-strength.
Byfield is posting the best even-strength results in the series with a +6 goal differential. His line has been good at generating shots, but they’re having trouble sustaining pressure and creating better-quality chances. Kopitar is someone to watch, as he’s still looking dangerous after all these years. Kopitar is seeing a lot of the top two lines, but is really feasting on the Draisaitl line and posting an Expected Goals For percentage of 62.24 percent against him in 22 minutes head-to-head. The biggest disappointment for the Kings has to be Dubois, who the Kings spent significant assets to bring in and help get them over the first-round playoff hump. He’s posting the worst shot-share numbers among the Kings, and is a bit of a liability whenever he’s on the ice. What’s worth noting is that he’s spent the majority of his minutes against McLeod, who is again getting trusted by the coaching staff to play against top lines in the post-season and doing an excellent job containing good players.
Data: Natural Stat Trick
Also posted at Oilersnation.
The series between the Edmonton Oilers and Los Angeles Kings has featured a lot of offence so far, which is a little surprising considering both clubs posted pretty good defensive numbers during the regular season. In 2023/24, the Oilers allowed the fifth lowest rate of shots against per game (28.12, all situations) while the Kings ranked fourth, allowing 28.01 per game. This along with sound goaltending helped drive positive results, as the Kings allowed the third lowest rate of goals in the league (2.56 per game), while the Oilers ranked tenth (2.88 per game).
But it doesn’t appear as though either team’s defensive performance or results have transferred from the regular season to the post-season.
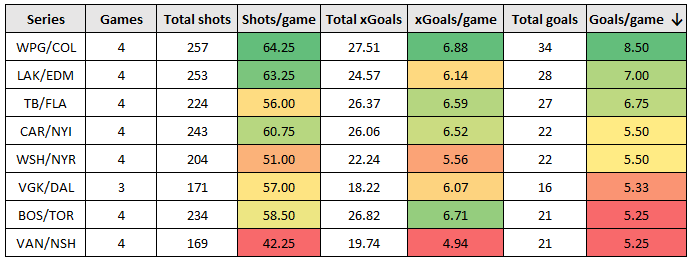
The Oilers and Kings have combined for 28 goals in four games, so an average of seven goals per game. That’s the second highest rate of goals per game among the eight first-round series, with the Colorado Avalanche and Winnipeg Jets averaging 8.5 goals per game. Those two teams have combined for 34 goals in four games.
The Oilers/Kings series has also seen the second highest rate of shots per game, due in large part to the Kings volume-shooting tactics from low-probability scoring areas. When you look at expected goals, the Oilers and Kings rank fifth among the eight playoff series. Regardless, it appears as though both teams are pushing heavily for offence, likely recognizing that the opposing goalies have played a lot of minutes this season and the defencemen have deficiencies.
In the first three games of their series against the Los Angeles Kings, the Edmonton Oilers have really had their way with their penalty kill. The Oilers have scored seven powerplay goals already by generating the highest rate of shots and scoring chances, and converting on 20.59 percent of their shots.
It shouldn’t be overly surprising to see the Oilers powerplay produce as the group has remained healthy and finished with the second highest rate of goals per hour during the regular season (10.53 per hour). Their success could be considered sustainable as their rate of unblocked shot attempts (or Fenwick, a proxy for scoring chances) and shots on goal were consistently one of the highest in the league. And thanks to the star power up front, and the chemistry they’ve built over the last few seasons together, the powerplay posted a team shooting percentage of 16.89 percent.
The Kings penalty kill was supposed to be one of their strengths heading into the playoffs, as the team allowed the second lowest rate of goals against during the regular season (5.37 per hour), second only to the Carolina Hurricanes. What might have been overlooked is the fact that their penalty kill results relied heavily on their goaltending, which ranked first in the league with a team save percentage of 90.65 percent. Among 70 goalies who played at least 75 minutes on the penalty kill, Cam Talbot ranked second with a 91.0 percent save percentage, while David Rittich ranked ninth with a save percentage of 89.5 percent.
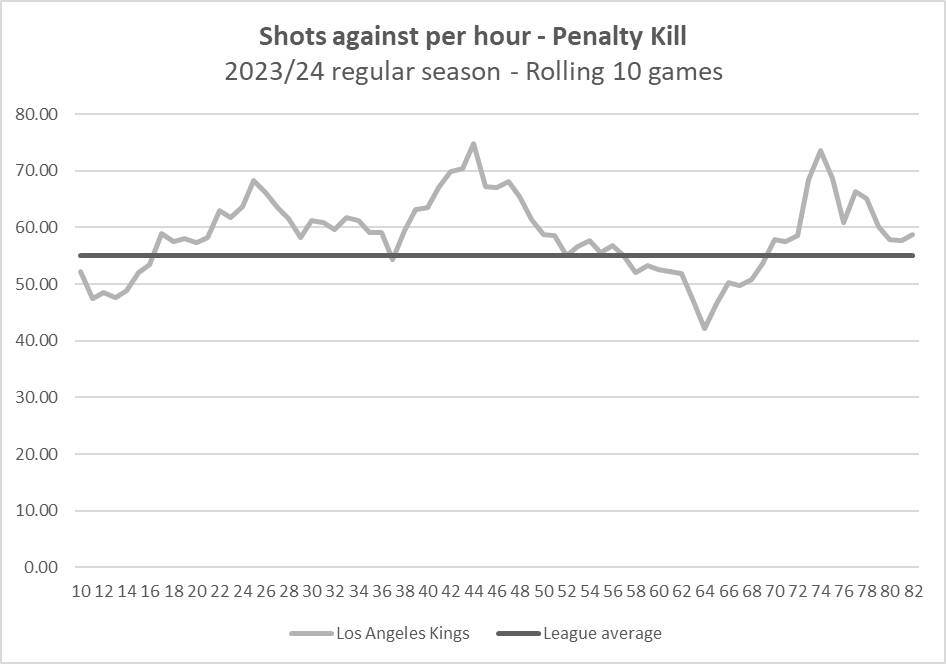
An underlying issue was that the Kings actually performed pretty poorly in front of their goaltending, allowing the tenth highest rate of shots against (57.46 per hour) and the twelfth highest rate of unblocked shot attempts per hour (83.36 per hour). So while the Kings penalty kill results were great, they weren’t exactly sustainable – and its falling apart at the worst time.
Here’s a quick look at the Kings rate of shots against per hour over the course of the regular season, broken out by rolling ten-game segments. The blue line across represents the league-average rate of shots against (55.05 per hour).
While the Kings did have some stretches where they were allowing a rate of shots that were below the league average, they were typically well above. At multiple points of the regular season, they were one of the worst teams in the league when it came to suppressing shots against, allowing over 70 shots against per hour. So it’s really not all that surprising to see their penalty kill results fall off a cliff in these first three games.
So far in the 2024 playoffs, the Kings penalty kill is allowing the highest rate of shots against and the second rate of unblocked shot attempts against in the league. Their goaltending, which was good during the regular season, has completely regressed – their team save percentage currently sits at 79.41 percent. Facing a lot of shots, playing a ton of minutes, and the general grind of the regular season can do that to you.
The other bad news for the Kings is that they should probably keep their expectations of their powerplay low as well.
They have yet to score with the man-advantage, going 0-for-10 in these first three games. And again, they might be looking at their regular season results for motivation, as they finished with the tenth highest rate of goals-for (8.40 per hour) in the league, and fourth highest in the west. But again, these results couldn’t be considered sustainable as they ranked 20th in terms of generating unblocked shot attempts per hour and 27th when it came to generating shots on goal. The Kings definitely have some talented forwards who can convert on their chances. The problem is that they’ve been terrible at consistently generating those chances. And again – things are falling off at the worst time.
The Kings’ special teams have some major underlying issues, and it’ll be up to the Oilers’ coaching staff and players to capitalize now.
Final check in on how each NHL team did in terms of clear victories, something I wrote about a few weeks ago and how it’s a good way to evaluate a team’s true talent level. From my last post:
One way to evaluate a team’s talent level is by looking into the number of clear victories they’ve posted. Clear Victories is a metric that Scott Reynolds analyzed and tracked over a decade ago over at The Copper & Blue and is defined as a win by two goals or more, excluding empty net goals. The key takeaway from Reynolds’ analysis is that clear victories were a better indicator of a team’s true talent level than the team’s overall record. And teams who more often win games by a larger margin tend to have better success in the future. Heading into the post-season this metric can really help identify the teams that have an edge over their competition and if any of the contenders might be considered outliers.
Clear Victories is defined as a win by two or more goals excluding empty net goals. One additional criterion is that the winning team has that goal differential of at least two with three minutes left in the game. This helps avoid the scenarios where an empty net goal is scored earlier in the period (as we know teams are pulling their goalies earlier), or when a penalty results in a goalie pull.
Included in the table below is each team’s Clear Victories Percentage (CV%), which is the number of clear victories divided by their total number of games, along with each team’s Clear Losses Percentage (CL%). I’ve also applied a basic heat map to each team’s points percentage and Clear Victories Percentage to see how teams compare with one another, and if there are teams who might be winning a lot but often by a smaller margin.
The Oilers had a great regular season, finishing with the ninth best points percentage. And 39.00 percent of their games were clear victories, which ranked sixth best in the league. Colorado (43.90), Winnipeg (43.90), Carolina (40.20), Florida (40.20) and Tampa Bay (40.20) were the top five teams for this metric. The league average clear victories percentage and the clear losses percentage was 29.9 percent.
What stands out for Edmonton is the percentage of their games were clear losses. Among the top end teams, in terms of results, Edmonton ranks fairly poorly and closer to league average levels with a clear loss percentage of 29.3 percent (15th in the league). The other contenders were excellent in limiting the frequency of clear losses.
We’ll see how this all correlates to playoff success.
A big thank you again to Ganesh Murdeshwar who was able to provide this data. It’s not readily available, so can’t thank him enough for his support.
Joined Jessica Ng and Min Dhariwal on CBC Radio Active this evening to preview game three between the Edmonton Oilers and the Los Angeles Kings. Full segment is here: CBC Radio Active (2024, April 26)
Other topics we discussed:
The first two games, what’s gone well and what the challenges have been.
Dylan Holloway’s performance in game two, his NHL journey so far, and the pressure of making an impact as a first round draft pick.
Stuart Skinner’s play, and the issues both teams are having playing defence.
The other series underway in the NHL.
Bob Cole’s passing, his impact to the game, and favorite memories. The Todd Marchant goal in 1997 will always be legendary for me, and Cole was a big part of that.
Couple other notes.
This series between the Oilers and Kings has been a pretty high-event one so far. Both teams had solid defensive numbers in the regular season, with the Oilers ranking fifth best in the league allowing 27.84 shots against per hour (all situations) and the Kings ranking fourth (27.70). But so far this post season, both clubs are allowing some of the highest rates among the playoff teams. Edmonton is at 30.95 shots against per hour and the Kings are at 37.34.
The Kings have scored all nine of their goals at even-strength (5v5). The Oilers only have six, with the other four coming on the powerplay. We know the referees gradually stop making calls as the series progresses, so the Oilers need to figure things out at even-strength.
Among the 19 goalies who have so far played this post-season, Skinner ranks 15th with an 0.857 save percentage (all situations) and Talbot ranks 13th with 0.867. Both goalies played a lot of minutes this regular season, so I wouldn’t be surprised to see them burnout and have their backups come in at some point. They’re good, NHL-caliber goalies, but they’re not going to steal you games in the playoffs.
Talbot has been the better goalie at even-strength so far. Skinner ranks dead last with a goals saved above average (GSAA) of -3.56.
I’m also not overly surprised that the Kings allowed four powerplay goals against in the first two games. While it’s true that they allowed the lowest rate of goals against during the regular season, it was largely driven by their goaltending. The Kings were allowing a higher-than-average rate of shots and scoring chances against all season, so it was a matter of time before they got burnt, especially if their goaltending slipped even slightly.