Thoughts on the Oilers: Current state, regulation wins, goaltending usage and the depth drop-off

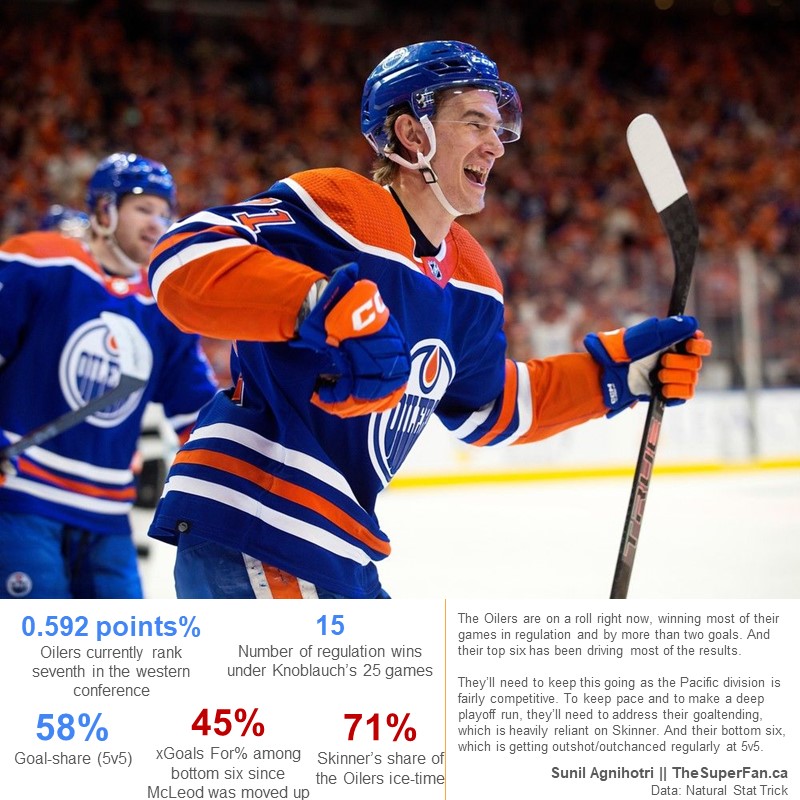
Pretty impressive turnaround for the Edmonton Oilers who are seventh in the western conference with a 0.592 points percentage, and fourth-best in the Pacific. They have the fifth best scoring rate in the league in all situations and sixth highest at even-strength (5v5). Their even-strength goal-share of 52.76% is eighth in the league and they’ll need to keep that going. Currently, six of the top ten teams in goal-share are in the western conference, four of which are in the Pacific division.

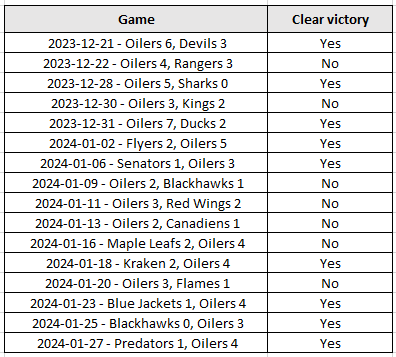
What’s especially impressive is the number of regulation wins the Oilers have posted since the coaching change. Since Kris Knoblauch took over behind the bench, the Oilers have won 19 games with 15 of them done without overtime or shootout. That’s the fifth highest number of regulation wins in the league since November 12th (when the coaching change happened). Worth noting that 12 of their wins (or 63%) have been by two goals or more – which is a better indicator of the team’s talent than one-goal games.

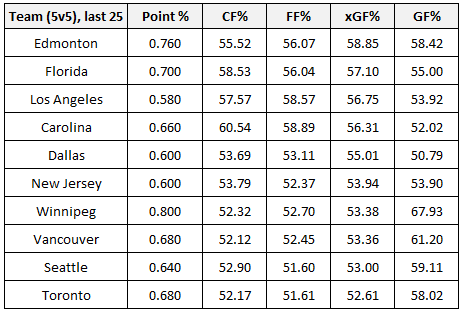
The Oilers even-strength (5v5) play has been solid, as they’ve outscored opponents 64-46 (58.18% goal-share, +18 goal differential) over the last 25 games since the coaching change. And their underlying numbers, like their 55.52 Corsi for percentage and 58.85 Expected goals-for percentage indicates that the 5v5 results are real and sustainable.

And while the Oilers are making the Pacific division standings interesting again, it’s worth noting that the rest of the teams in the Pacific are also posting some solid underlying numbers. In the last 25 games, the top ten teams in expected goals for percentage features four teams in the Pacific (table below is sorted by xGF%). The difference might come down to special teams, where some of the Pacific division teams are getting results on the powerplay or penalty kill. Covered that in my recent Pacific division check-in here.

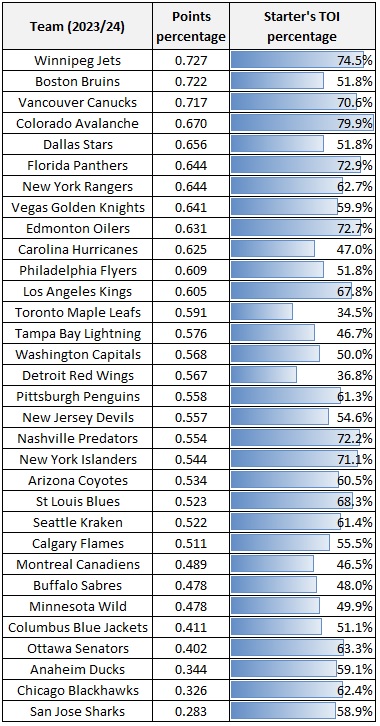
It’s also worth keeping tabs on goaltending deployment across the division, which is going to have an impact on their playoff runs. While most teams are going towards a 1B/1A split between goalies, with most starters playing 59.90 percent of the team’s minutes this season, the Oilers are really riding their starter. Stuart Skinner has now played 70.60 percent of the Oilers total minutes this season, which is seventh highest in the league. That’s just behind Thatcher Demko, who has played 70.80 percent of Vancouver’s total minutes, and (interestingly) Cam Talbot who has played 72.90 percent of Los Angeles minutes. May recall Todd McLellan consistently starting Talbot in Edmonton in the 2016/17 regular season, where he played 86.70 percent of the total minutes. And how that impacted the Oilers playoff run that season.

Back to Edmonton’s current situation. If Calvin Pickard isn’t going to get regular deployment to give Skinner a rest and keep him fresh for the playoff race and (hopefully a playoff run), then management needs to address this and get someone the coaching staff actually trusts. Even since the coaching change (and Campbell’s demotion to Bakersfield), it’s been all Skinner who has played 73 percent of the team’s total ice time in the last 25 games.

The top six forward group, now featuring Ryan McLeod and Warren Foegele, is also crushing it right now since the Oilers made adjustments during their game against New Jersey on December 21st. Here’s how the top two line have performed over the last nine games at even-strength.

What’s a little concerning is how the bottom six have played the last nine games, with them not creating much and not allowing much either. In 139 minutes over the last nine games, the third and fourth lines have combined for 4 goals for, 4 goals against. And that’s largely because their Corsi For percentage is only 48% and their Expected Goals-for percentage is 45%. A whole lot of nothing going on there, which is concerning considering how big of a role team depth has on long playoff runs. Definitely an area to address by management, especially if McLeod is going to be on the second line.

One last thought on the new second line. It does re-affirm my belief that Draisaitl’s success largely depends on having a linemate that can also play center. McDavid is the obvious example, and so is Nugent-Hopkins who formed a line with Draisaitl and Yamamoto in the past. But I also recall a couple seasons ago when Draisaitl was on a line with Ryan Strome and Jujhar Khaira (both of which played center in their careers on depth lines) and had some decent success with them. In 108 minutes together between 2017-2019 (when Strome was an Oiler), they posted an on-ice goal-share of 56% (5 GF, 4 GA), and had a Corsi for percentage of 52% and an Expected goals-for percentage of 55%. So I’m not totally surprised that Draisiatl has found some chemistry with McLeod.

Data: Natural Stat Trick, NHL.com

The resurgence of Connor McDavid

With Connor McDavid back to playing at the levels we expected him to be at, I thought it’d be worth revisiting an article I wrote in mid-November when the captain’s season was off to a rocky start. Latest post is up at Oilersnation.

Since his tenth game of the season, McDavid went on to put up 24 even-strength points in the next 23 games. And he currently sits third in the league with 28 even-strength points – only behind Nathan MacKinnon (31 points) and Nikita Kucherov (29 points). McDavid’s current full-season rate of 3.21 points per hour is currently the highest among all top six forwards (226 players who have played at least 400 minutes this season).

The other factor in all of this has been McDavid’s ability to drive play generate chances again, and help tilt the ice in the Oilers’ favour. With him on the ice, the Oilers have historically seen an increase in their share of expected goals (which factors in shot type and location to determine the probability of shots becoming goals), which isn’t at all surprising considering his talent level. But that wasn’t the case early on in the season. After his first ten games, the Oilers were posting an expected goal-share of 52.22 percent with McDavid on the ice and actually saw an increase of 8.29 without him on the ice. That’s the opposite of what’s happened in the last three seasons where McDavid’s on-ice numbers were consistently well ahead of his teammates. Between 2020 and 2023, the Oilers posted an expected goal share of 58.34 percent with McDavid on the ice, which was 9.41 higher than what the team posted without him on the ice.

Sunil Agnihotri/Oilersnation

Full article is at Oilersnation.

Tracking the Western conference – As of December 31, 2023

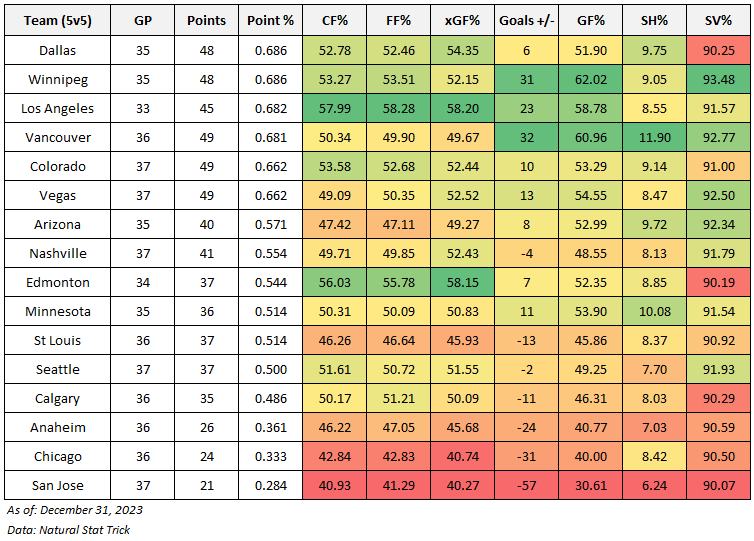
After 35 games into the regular season, the Edmonton Oilers are finally within striking distance of a wild-card spot in the western conference. A previous eight-game winning streak, and this current five-game winning game streak has pushed them to fourth in the Pacific division and ninth in the west (as of December 31st, 2023), having now accumulated 37 points and posting a 0.544 points percentage.

Below are the even-strength (5v5) numbers for each team in the western conference (sorted by points percentage), including goal-share results as well as the shot-share metrics that give us a sense of which teams have the right processes in place and if the results are sustainable or not. At the end of the table are each team’s shooting percentage and save percentage. I’ve also applied a basic heat map to each metric to show which teams are doing well or struggling relative to their conference foes (i.e., green is good, red is bad). You can also find a description of each metric at the end of this article. Please note that the shot-share metrics are score and venue-adjusted based on Natural Stat Trick’sTrick’s methodology.
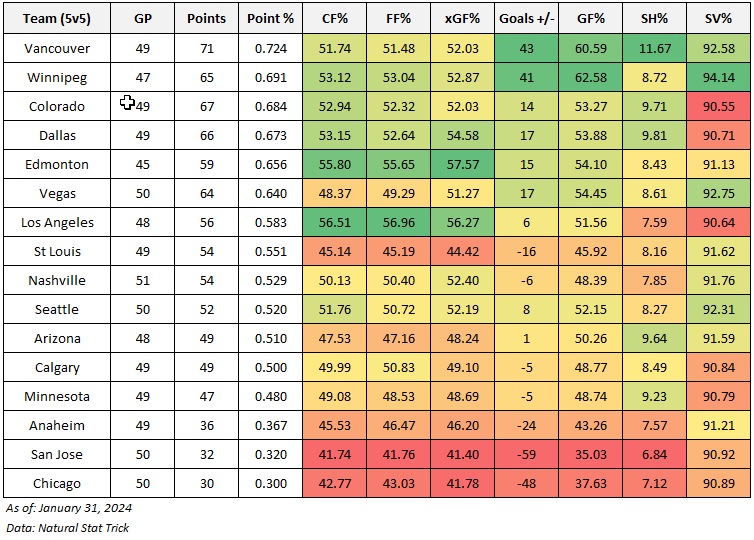
As mentioned at the last check-in, there were plenty of reasons to believe the Oilers would eventually climb up the standings. The team’s even-strength (5v5) performance has been strong all season, with the club continuing to post some of the strongest shot-share percentages and expected goal shares in the league. And not a lot of of teams have pulled away in the standings. As long as the Oilers can continue getting average goaltending and depth scoring at even-strength, they should be able to secure a spot.

Below is a high-level snapshot of how each player’s on-ice numbers have been at even-strength (5v5) this season, split between forwards and defencemen and sorted by total ice-time. Included are the metrics I use to assess a player’s performance (i.e., shots and expected goals) as well as their actual on-ice results (i.e., goal differential). I’ve also included each player’s PDO, which assesses how lucky/unlucky they’ve been, and if we can expect their results to improve over the course of the season. A basic heat map has been applied to show how each player compares to the rest of their squad. 

We know who the individual drivers have been this season and I’ve written enough about Kane’s season, so let’s focus on PDO and which players might see some improved results. Up front, I think Draisaitl’s and Foegele’s on-ice goal-differentials are bound to improve. They’re skating on a very effective second-line with McLeod, with the trio outscoring teams 9-2 in 48 minutes together. They might not be able to sustain this 82% goal-share, but their results should remain strong as they’re posting a 67% Corsi for percentage and expected goal share together. On the back-end, I think we’ll see Bouchard’s results improve as he continues to post strong on-ice shot-share numbers and skates with top-end players, but has one of the lowest PDO’s on the team.

Finally, here’s a quick look at how the western conference teams are doing on special teams, sorted by their points percentage. I’ve included the shots for and against to assess their performance and the goals for/against to assess the actual results.

Edmonton’s powerplay continues to be one of the best, no surprise. And their penalty kill results should gradually improve as they’re allowing one of the lowest rates of shots against. That’s a positive sign as the last thing they need in this playoff race is their special teams costing them wins as it’s done in the past. Looking at the teams Edmonton is competing with for playoff spots, Vegas and Colorado look like they have things figured out. As well as Nashville who should get better penalty kill results. I don’t see Arizona staying in the race as they’re even-strength performance numbers have been poor along with their penalty kill. And Minnesota is another team that could be sunk by their special teams.

Will be interesting to see how things play out over the next month with Edmonton playing a lot of the weaker teams in the league with no back-to-backs scheduled. If things go well, the Oilers could push for third in the Pacific. For now, it’ll be key to bank points and create some separation from the rest of the wild-card pack.

Data: Natural Stat Trick

Glossary:

  • Points-percentage (Point%) – The total points accumulated divided by the points that were available, including extra time.
  • Corsi for percentage (CF%) – The proportion of all the shot attempts the team generated and allowed that the team generated (i.e., corsi for/(corsi for + corsi against). This is used as a proxy for possession and is the best at predicting a team’steam’s future share of goals (GF%). (Source: Hockey Great Tapes – Draglikepull)
  • Fenwick for percentage (FF%) – The proportion of all the unblocked shot attempts the team generated and allowed that the team generated (i.e., Fenwick for/(Fenwick for + aenwick against). This is used as a proxy for shot quality and considers shot blocking a repeatable skill.
  • Expected goals for percentage (xGF%) – This is a weighting placed on every unblocked shot based on the probability of the shot becoming a goal. This depends on the type of shot, location and uses historical shot and goals data to come up with the probability for each unblocked shot.
  • Goals for percentage (GF%) – The proportion of all the goals that the team scored and allowed that the team generated (i.e., Goals for/(Goals for + goals against).
  • Shooting percentage (SH%) – The percentage of the team’steam’s shots on goal that became goals (i.e., total goals divided by the total shots on goal).
  • Save percentage (SV%) – The percentage of the team’steam’s shots on goal against that were saved (i.e., 1-(totals goals allowed divided by the total shots on goal against)).

CBC Radio Active: Edmonton Oilers season so far

I joined Jessica Ng on CBC Radio Active to talk about the Edmonton Oilers season and what they’ll need to push for a playoff spot.

Full segment is here: CBC Radio Active (2023, December 29)

Topics we covered:

  • The Oilers 5-0 win against the San Jose Sharks last night.
  • McDavid’s season and his return to form.
  • Ryan McLeod’s recent performance and his importance to the team.
  • The Oilers issues with drafting and developing players.
  • The Oilers push for a wild card spot.

Thanks again to the team at CBC Edmonton for putting it all together!

With Oilers forward Connor Brown scratched tonight, could Evander Kane be next?

With Connor Brown struggling and being a healthy scratch, I looked into another top six forward whose on-ice numbers at 5v5 have been just as poor. My latest post up at Oilersnation looks at Evander Kane’s season, his on-ice numbers and how they’ve been similar to Brown’s.

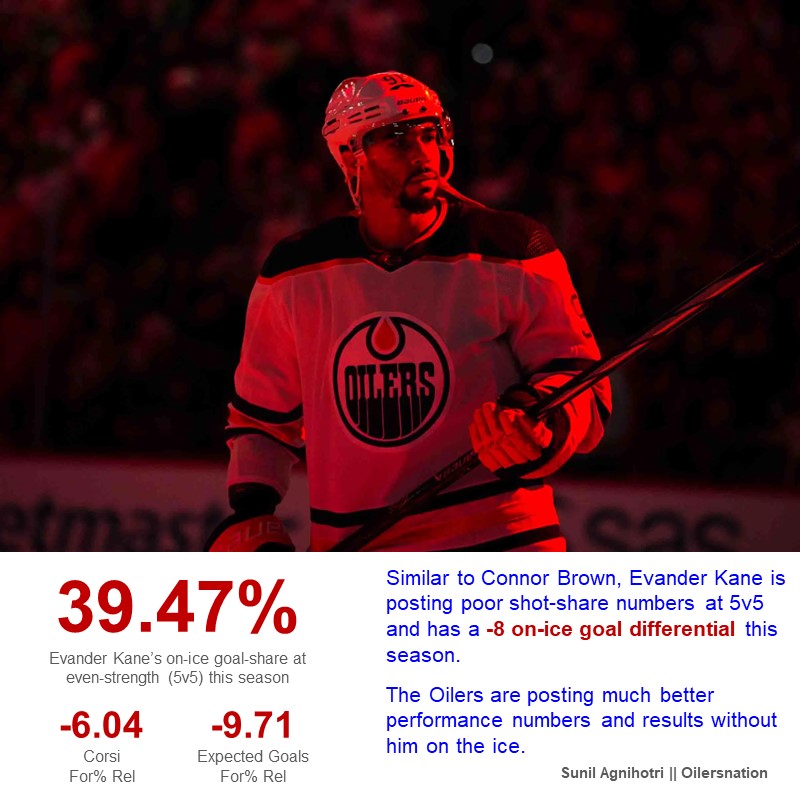
Like Brown, Kane has also had plenty of time in the top six, playing the third-highest number of minutes and getting to play alongside McDavid or Draisaitl (or both) for 66 percent of his total ice time. And while he has put up 13 even-strength points in 29 games this season, Kane also has an on-ice goal differential of -8 (15 goals for, 23 goals against) – which translates to an on-ice goal-share of only 39.47 percent. That’s one of the lowest on the team, and one of the worst among top six forwards league-wide.

When it comes to the underlying shot-share or performance numbers, the Oilers do a much better job controlling the flow of play and out-chancing opponents when Kane hasn’t been on the ice this season. Again, very similar to Brown, the Oilers see a drop of 6.04 Corsi For percentage points and 9.71 Expected Goals For percentage points with Kane deployed. Like Brown, removing Kane from the roster might improve their odds of outscoring opponents and winning games. And that’s a major issue considering the expectations for him and the Oilers this season.

Sunil Agnihotri/Oilersnation

Full article is at Oilersnation.

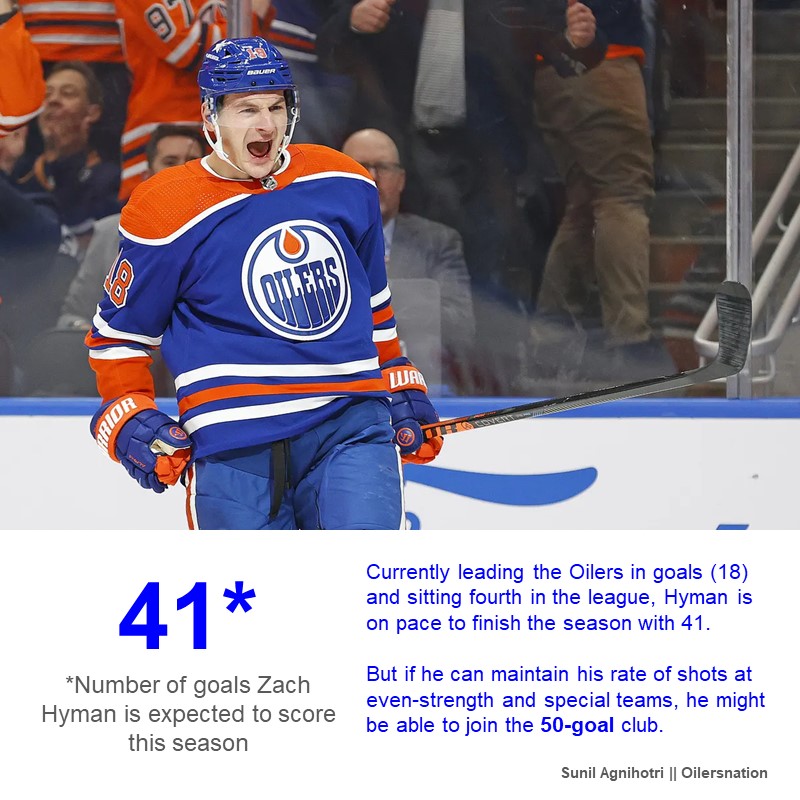
Can Zach Hyman score 50 goals this season?

In my latest post for Oilersnation, I looked into Zach Hyman’s scoring rate this season and how many goals we can reasonably expect him to finish the 2023/24 regular season with.

Considering how often Hyman gets to play with McDavid at both even-strength and the powerplay and how well the Oilers control the flow of play and scoring changes with them on the ice, it’s reasonable to expect Hyman to make a push for 50 goals. Reaching 40 would be great, no question. But with scoring continuing to grow across the league, it’s become even more important for the Oilers to have as much elite-level scoring in their top six, especially at a time when they need to find ways to improve their odds of clinching a playoff spot.

Sunil Agnihotri/Oilersnation

Full article is at Oilersnation.

What can we learn from how the Edmonton Oilers deploy forward lines and defensive pairings?

Over at Oilersnation, I looked into how defencemen and forwards have been deployed since Kris Knoblauch was hired as head coach of the Edmonton Oilers. I wanted to understand how the different forward lines have been deployed with the defence pairings, and how well they’ve performed in these last twelve games at even-strength.

Looking at the expected goal-shares of each combination of forward and defencemen, the one item that really stands out is the Oilers performance when Draisaitl has been deployed as the sole centerman with Nurse and Ceci on the blue line. In 68 minutes, the trio has posted a 24.01 percent expected goal-share – a horrendous number, indicating that the Oilers are at risk of getting outscored at a rate of 3-1 if this continues. Right now, the trio is lucky that they’ve only been outscored 2-0 in these 68 minutes. It’s worth noting, too, that Draisaitl is in a bit of a personal slump at even-strength as he’s only posted five even-strength points since the coaching change, and his 1.68 points per hour is well below his career levels (2.38 points per hour). Considering how much money is being spent on Draisaitl, Nurse and Ceci, and the expectations for them to outscore opponents and win games, this has to be a spot of bother for the coaching staff.

Sunil Agnihotri/Oilersnation

Full article is at Oilersnation.

Progression

In my latest article for Oilersnation, I looked into the drivers for the Oilers recent success under the new coach, and areas worth keeping an eye on.

If the Oilers can maintain their ability to control the flow of play at even-strength and perform well on their special teams, they’re giving themselves a very good shot at a wildcard spot in the Western Conference. But they’ll need to address their goaltending, which is lacking depth right now and putting their starter at risk of burnout as the season progresses. Up front it does appear with McDavid back in form, the club should be scoring at the rates they were at last season. But they need some of their secondary, depth players to contribute at the same level as last season. The top six have some players who are at risk of seeing their numbers decline, and it doesn’t appear as though management has prepared any youngsters to take on larger roles on the club.

It’ll be interesting to see over the next month if the Oilers can sustain their recent success and make some ground in the western conference. The teams ahead of them in the standings aren’t very strong, and don’t have the elite talent the Oilers have. But if goaltending slips or injuries occur, it’ll be a significant blow to their playoff aspirations.

Sunil Agnihotri/Oilersnation

Full article is at Oilersnation.

Tracking the Western conference – As of November 30, 2023

I usually do a monthly review of the Pacific division for at least the first half of the regular season. And then switch to a western conference review in the last few months of the season to predict which team could make a deep run in the playoffs. But since the Oilers have started so poorly and need to make some ground just to clinch a wild-card spot in the west, I’m already switching from a division review to a conference review. Just a wild season.

After 22 games, the Oilers currently rank sixth in the Pacific division with a points percentage of 0.432, ahead of only Anaheim and San Jose. They rank 27th in the league, while Los Angeles and Vegas are in the top five. The good news is that the Oilers have won their last three, having now gone 6-3 since the coaching change. And they have some strong underlying numbers over the course of the season. But they’re going to need to be posting a strong points percentage (at least 0.600) the rest of the way to compete for a playoff spot.

Below are the even-strength (5v5) numbers for each team in the western conference (sorted by points percentage), including goal-share results as well as the shot-share metrics that give us a sense of which teams have the right processes in place and if the results are sustainable or not. At the end of the table are each team’s shooting percentage and save percentage. I’ve also applied a basic heat map to each metric to show which teams are doing well or struggling relative to their conference foes (i.e., green is good, red is bad). You can also find a description of each metric at the end of this article. Please note that the shot-share metrics are score and venue-adjusted based on Natural Stat Trick’sTrick’s methodology.

While the results have been bad so far, there’s reasons for optimism.

First off, the team’s underlying shot-share numbers have been solid, with the Oilers posting a 56% Corsi For percentage and expected goal-share. But goaltending has been a major weakness. Had the Oilers received league average goaltending this season (91.55%), they would have allowed around 10 fewer goals and would be a couple spots higher in the standings. Skinner has been playing better recently, but there should be concern about his workload and the fatigue he will likely experience in the last stretch of the season and (hopefully) the playoffs. I’m just not sure if the general manager who has struggled to identify strong goaltending in the past should be trusted to make decisions.

The other positive for Edmonton is the improved health and performance of Connor McDavid. He’s been playing much better recently, albeit against some weaker teams. But it’s a significant improvement from earlier this season when he was producing at a third line rate.

Couple things worth monitoring once the Oilers get back from their mini-break:

  • Performance and results of the bottom six forwards at even-strength. There isn’t much going on there with McLeod struggling to produce. But he’s a prime candidate to break-out soon as his underlying numbers have been solid so far.
  • If the Oilers actually address their goaltending or go the path of least resistance – a go-to strategy for Ken Holland. This would include simply calling Jack Campbell back up and hoping that he can play every four games.
  • The Oilers special teams and if it become a factor again. The penalty kill was costing them wins early on in the season, but has been much better since the coaching change. The powerplay is showing signs of life as well.

If the Oilers continue to out-shoot and out-chance opponents, they have a decent chance of competing for a wild card spot. There’s a couple teams ahead of them that are likely to slip including St. Louis and Arizona. And the rest of the Pacific has been very mediocre.

Data: Natural Stat Trick

Glossary:

  • Points-percentage (Point%) – The total points accumulated divided by the points that were available, including extra time.
  • Corsi for percentage (CF%) – The proportion of all the shot attempts the team generated and allowed that the team generated (i.e., corsi for/(corsi for + corsi against). This is used as a proxy for possession and is the best at predicting a team’steam’s future share of goals (GF%). (Source: Hockey Great Tapes – Draglikepull)
  • Fenwick for percentage (FF%) – The proportion of all the unblocked shot attempts the team generated and allowed that the team generated (i.e., Fenwick for/(Fenwick for + aenwick against). This is used as a proxy for shot quality and considers shot blocking a repeatable skill.
  • Expected goals for percentage (xGF%) – This is a weighting placed on every unblocked shot based on the probability of the shot becoming a goal. This depends on the type of shot, location and uses historical shot and goals data to come up with the probability for each unblocked shot.
  • Goals for percentage (GF%) – The proportion of all the goals that the team scored and allowed that the team generated (i.e., Goals for/(Goals for + goals against).
  • Shooting percentage (SH%) – The percentage of the team’steam’s shots on goal that became goals (i.e., total goals divided by the total shots on goal).
  • Save percentage (SV%) – The percentage of the team’steam’s shots on goal against that were saved (i.e., 1-(totals goals allowed divided by the total shots on goal against)).
Caution flags appearing since the Oilers coaching change

The Edmonton Oilers are in a brutal spot having now lost three straight in regulation, and they really haven’t seen any benefits of the coaching change just yet. It’s only been five games with Kris Knoblauch behind the bench, but the results have been poor with the team getting outscored 18-21 in all situations (resulting in a 0.400 points percentage). And their underlying shot-share numbers at even-strength (5v5) that helps assess the team’s performance, and predicts future results, have also declined since Jay Woodcroft was dismissed.

Below is a quick comparison of how the Oilers have performed under the two coaches at even-strength. Under Woodcroft, the Oilers were consistently one of the better teams in the league when it came to puck possession and controlling scoring chances. But under Knoblauch, the team has seen around an 11% decline in these metrics, now hovering below league-average levels.

The actual results have also slipped slightly under Knoblauch, with the Oilers having posted a 38% goal-share at even-strength (8 goals for, 13 goals against). What’s especially alarming is that it’s on the defensive side of things where the Oilers have become worse since the coaching change. For instance, the rate of shot attempts (Corsi) against has increased by 28%, going from 48.58 per hour under Woodcroft to over 62 per hour under Knoblauch. The rate of expected goals against has had similar growth, increasing by 28% from 2.43 per hour to 3.13 per hour.

Offensively at even-strength, the Oilers have also downgraded, but not as significantly as they have on defence. The Oilers rate of shots on goal has dropped by 6.2%. But their rate of expected goals and actual goals remains around the same as before.

The powerplay has also been a mess, with the Oilers having only scored three goals since the coaching change. A big reason for that is their declining rate of unblocked shot attempts, which has been 66 per hour in the last five games – one of the lowest rates in the league and well below the 89 they generated per hour when Woodcroft was behind the bench this season and last season. Definitely something to keep an eye on.

The good news is that the Oilers penalty kill has been a bright spot in these last five games, allowing only three goals and actually scoring three goals. The Oilers have allowed around 62 unblocked shot attempts against per hour since the coaching chance, one of the lowest rates in the league and well below what previous coaching regimes posted.

It’s still early in Knoblauch’s coaching career with Edmonton, so hopefully he’ll be able to make the tactical and player deployment adjustments to get things on track again to get out of the western conference basement. For now, the performance numbers are indicating that we should temper our expectations of the team, especially if they continue to struggle with preventing chances against at even-strength.

Data: Natural Stat Trick