After watching Milan Lucic play only 11 minutes in all situations on Friday night against the Flyers, it’s become quite apparent that the winger is a fourth-line option for Ken Hitchcock.
Lucic has seen his ice time gradually decrease over the course of this season, and it’s largely his powerplay minutes that have been taken away since Hitchcock’s arrival. He’s still averaging the same minutes per game at even-strength as he did when McLellan was behind the bench, hovering around 11.5 minutes. But it’s on the powerplay where he’s seen his average minutes per game drop significantly from just over three minutes per game down to less than one.
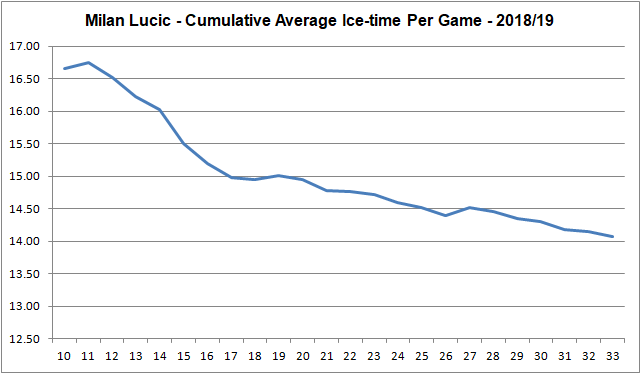
Quick note about the graph above: the cumulative average minutes per game at any given point factors in all of the previous games from that point. So at the 12-game mark, the average minutes per game factors in games 1 through to 12. At the 33-game mark, the average minutes per game factors in games 1 through to 33.
This had me wondering about who else has seen an increase or decrease in their average ice time per game since Hitchcock arrived compared to when McLellan was behind the bench. And in what situations (i.e., even-strength, powerplay or penalty kill) were the players seeing a difference. Ice time is the biggest influence a coach can have on the team – it is currency – and we can quickly get a sense of who the coach trusts and in which situations. Over the course of three seasons we learned a lot about McLellan – how he likes to manage his bench, who his go-to players are, but also where McLellan has his biases and blind spots. With a new coach, we get a fresh perspective on things, and a chance to see players placed in or removed from different situations.
For this analysis I only included players that were on the roster before and after November 20th, 2018 when the Oilers made the coaching change. So players like Evan Bouchard, Kailer Yamamoto, Ryan Strome (who were on the roster before Hitchcock) and Caleb Jones, Chris Wideman and Valentin Zykov (who weren’t on the roster before Hitchcock) were excluded from this analysis.
Below is a list of the Oilers skaters and their change in average ice time per game after Hitchcock became coach by game-state. This table is sorted by the players change in average ice time per game in all situations. I’ve applied a color scale to show which players have seen a positive change (green) and which players have seen a negative change (red) for each of the game-states.

Leading the way is winger Alex Chiasson who has had a very productive season so far, and is currently skating on the top line with McDavid and Draisaitl. Since Hitchcock’s arrival, Chiasson has seen a bump in his average ice time per game at even-strength and on the powerplay. And he’s also seeing about half a minute more per game on the penalty kill.
Brodziak and Kassian have also seen more ice time at even-strength, but also on the penalty kill along with Draisaitl. With Strome’s departure and Rieder being out with an injury, it’s not too surprising to see other forwards start filling in more on the penalty kill.
What’s most surprising to me in all of this is that McDavid hasn’t seen as big of a bump in total average ice time – only a minute more since McLellan was dismissed. Hitchcock has commented on how well McDavid recovered on the bench and I had assumed McDavid was seeing or was going to see significantly more ice time.
At the other end are more of the fringe players like Marody and Russell, but also forwards who at one point played regular minutes in the top six group of forwards like Rattie and Lucic. As mentioned earlier, Lucic’s minutes at even-strength (5v5) are about the same as before Hitchcock arrived, but his powerplay minutes are what took a significant hit.
One player whose ice time is worth watching is Nugent-Hopkins. He’s been a solid all-round player for the team this season, and was at one-point leading the team in penalty kill ice time, while at the same time playing significant minutes on the powerplay.
Among the defencemen, Larsson and Gravel have seen the biggest change in total average ice time per game. Both players are averaging more ice time at even-strength, with Larsson also receiving more time on the penalty kill. Nurse has also seen a bump, due in large part to receiving more ice time on the powerplay. And surprisingly, Klefbom has seen a decrease in his average ice time as he’s spending slightly less time on the powerplay and the penalty kill.
It’s only 13 games with Hitchcock behind the bench, but we’re starting to see a change in how things are run based on the average ice time players are receiving. Hard to say if it’ll be for the best – the team is riding some amazing goaltending numbers right now and getting better results, but they’re also posting similar shot-share numbers as before and generating and allowing around the same number of shots per game. It’ll be worth looking into what impact the changes in average player ice time are having on the results (i.e, goal-metrics) and also the underlying numbers to validate the sustainability.
Data: Natural Stat Trick
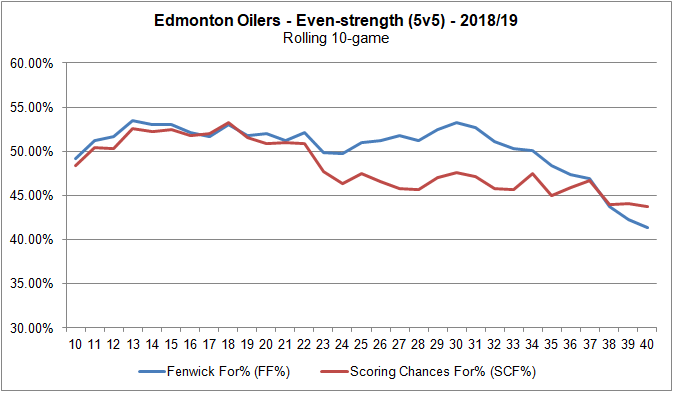
 One of the interesting underlying trends this season, aside from their rapidly declining shot-share numbers, is the Oilers rate of scoring chances for and against at even-strength. They currently rank 23rd in the league when it comes to their share of the total scoring chances (SCF%) with 47.76%, generating 25.01 scoring chances per hour (21st in the league) and allowing 27.35 per hour (22nd). Note that the scoring chance data used here is based on Natural Stat Trick’s definition of the metric, which you can read more about on their glossary page.