Quick follow up to an article I wrote a few weeks ago when I looked into Adam Henrique’s struggles this season. I had found that while his even-strength numbers and overall productivity have predictably declined, he was at the time having a positive influence on the team’s penalty kill. And I speculated that the Oilers penalty kill would struggle without him.
Turned out I was correct, but not for the exact reasons I had based my prediction on.
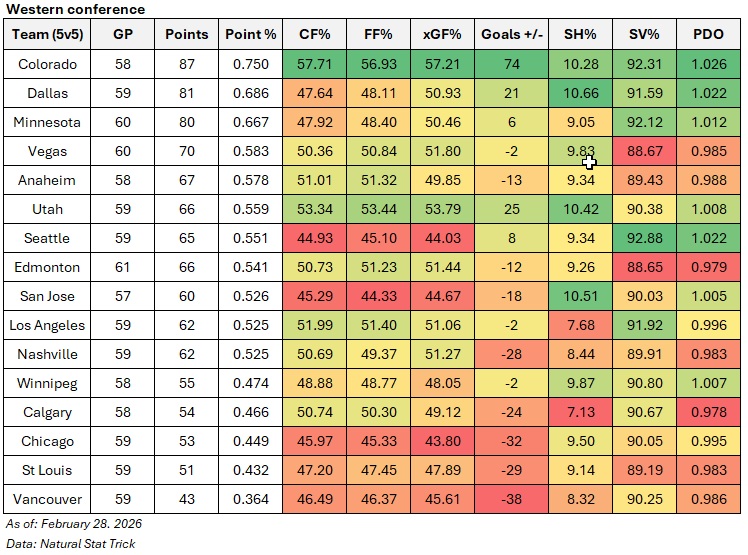
In the first 43 games of the season with Henrique healthy, the Oilers penalty kill was fairly mediocre. They were sitting 17th in the league, allowing 7.52 goals against per hour. They were allowing a lot of shots and chances against, and the goaltending was actually decent, ranking 10th with an 86 percent save percentage. But with Henrique deployed, which was the most often among forwards, the rate of shots and goals against plummeted.
So his absence was fairly substantial, and the Oilers did see their penalty kill struggle severely without him. In those 15 games with Henrique unavailable, the Oilers allowed 13 goals against per hour (12 goals in 55 minutes) – one of the highest rates in the league and a big reason why the team struggled to bank some points. What’s interesting is that the team did an okay job preventing shots against. It was actually the goaltending that completely fell apart, posting a 76 percent save percentage.
I was also curious to see how Knoblauch and the coaching staff would spread Henrique’s penalty kill minutes among the forwards. Considering Knoblauch’s lack of overall creativity with deployment and tactics, I wasn’t expecting much.
The table here lists all of the penalty killing forwards this season, sorted by their share of the total penalty kill time in the first term (the first 43 games when Henrique was healthy). Term two is the 15-game segment when Henrique was injured and unavailable. I’ve also added a column to capture the change in each players proportion in the second term compared to the first term.
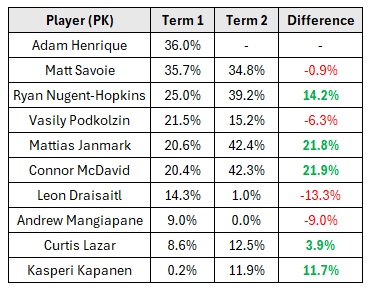
So for example, Master Savoie played in 35.7 percent of the Oilers total penalty killing time when Henrique was healthy. In the second term, his total proportion slid slightly to 34.8 percent. There really was no reason to reduce his minutes considering the team does see fewer shots against when he’s out there – a great sign for the kid’s development.
The two forwards Knoblauch relied more on for the penalty kill was Janmark and McDavid. Janmark made sense as he has a lot of experience on the penalty kill and a safe bet for a risk-averse coach (even though the team sees way more shots and chances against with him on the ice). The significant increase in McDavid’s proportion of PK ice time is a little weird. Having him play the last bit of the penalty kill when the other team’s best forwards are getting a rest makes sense. But this many minutes at a real time of need reeks of panic and a lack of planning by the coaching staff. Would have preferred Podkolzin or Lazar getting more reps. Or even Mangiapane, but he’s clearly fallen out of favor with the coach.
Thankfully Henrique is back now and should help stabilize the penalty kill (and really that’s all he can do at this stage of his career). But the coaching staff, and the front office, should really have a plan in place just in case they need to move Henrique to improve the team’s depth’s performance at equal-strength.
Data: Natural Stat Trick