I usually do a monthly review of the Pacific division for at least the first half of the regular season. And then switch to a western conference review in the last few months of the season to predict which team could make a deep run in the playoffs. But since the Oilers have started so poorly and need to make some ground just to clinch a wild-card spot in the west, I’m already switching from a division review to a conference review. Just a wild season.
After 22 games, the Oilers currently rank sixth in the Pacific division with a points percentage of 0.432, ahead of only Anaheim and San Jose. They rank 27th in the league, while Los Angeles and Vegas are in the top five. The good news is that the Oilers have won their last three, having now gone 6-3 since the coaching change. And they have some strong underlying numbers over the course of the season. But they’re going to need to be posting a strong points percentage (at least 0.600) the rest of the way to compete for a playoff spot.
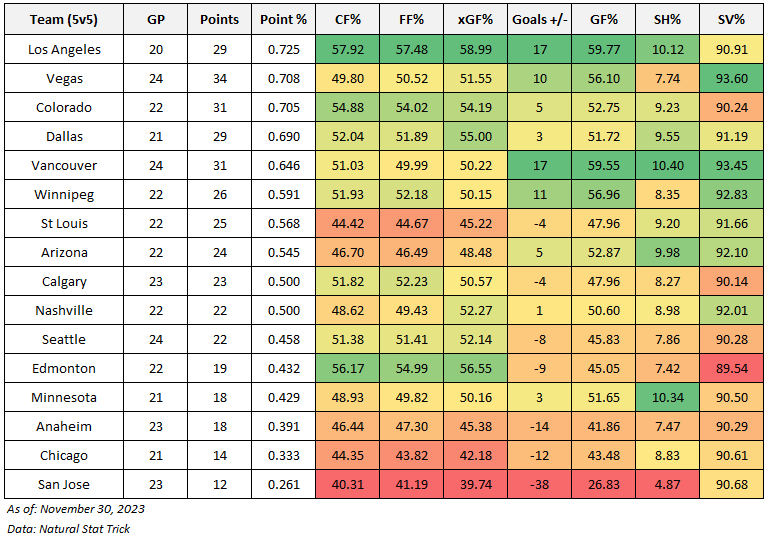
Below are the even-strength (5v5) numbers for each team in the western conference (sorted by points percentage), including goal-share results as well as the shot-share metrics that give us a sense of which teams have the right processes in place and if the results are sustainable or not. At the end of the table are each team’s shooting percentage and save percentage. I’ve also applied a basic heat map to each metric to show which teams are doing well or struggling relative to their conference foes (i.e., green is good, red is bad). You can also find a description of each metric at the end of this article. Please note that the shot-share metrics are score and venue-adjusted based on Natural Stat Trick’sTrick’s methodology.
While the results have been bad so far, there’s reasons for optimism.
First off, the team’s underlying shot-share numbers have been solid, with the Oilers posting a 56% Corsi For percentage and expected goal-share. But goaltending has been a major weakness. Had the Oilers received league average goaltending this season (91.55%), they would have allowed around 10 fewer goals and would be a couple spots higher in the standings. Skinner has been playing better recently, but there should be concern about his workload and the fatigue he will likely experience in the last stretch of the season and (hopefully) the playoffs. I’m just not sure if the general manager who has struggled to identify strong goaltending in the past should be trusted to make decisions.
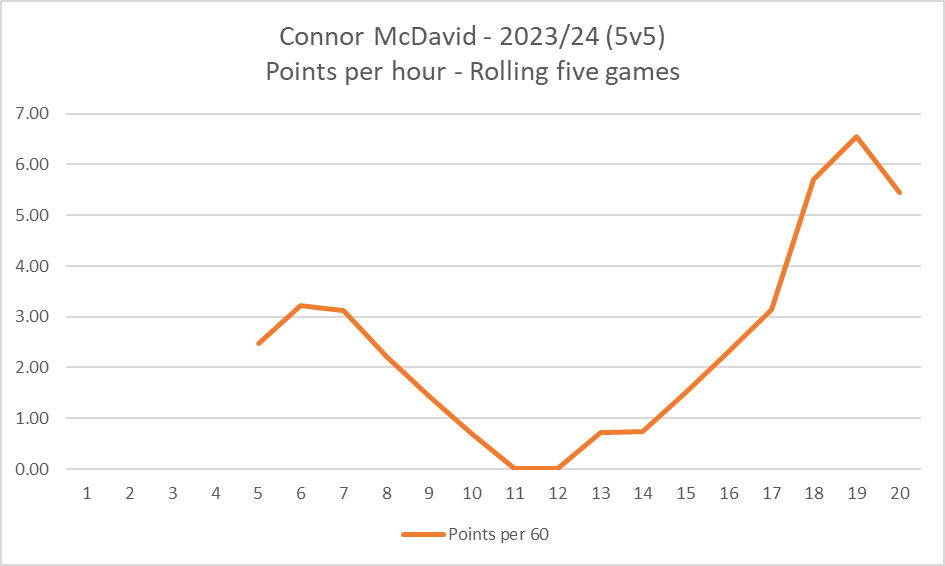
The other positive for Edmonton is the improved health and performance of Connor McDavid. He’s been playing much better recently, albeit against some weaker teams. But it’s a significant improvement from earlier this season when he was producing at a third line rate.
Couple things worth monitoring once the Oilers get back from their mini-break:
- Performance and results of the bottom six forwards at even-strength. There isn’t much going on there with McLeod struggling to produce. But he’s a prime candidate to break-out soon as his underlying numbers have been solid so far.
- If the Oilers actually address their goaltending or go the path of least resistance – a go-to strategy for Ken Holland. This would include simply calling Jack Campbell back up and hoping that he can play every four games.
- The Oilers special teams and if it become a factor again. The penalty kill was costing them wins early on in the season, but has been much better since the coaching change. The powerplay is showing signs of life as well.
If the Oilers continue to out-shoot and out-chance opponents, they have a decent chance of competing for a wild card spot. There’s a couple teams ahead of them that are likely to slip including St. Louis and Arizona. And the rest of the Pacific has been very mediocre.
Data: Natural Stat Trick
Glossary:
- Points-percentage (Point%) – The total points accumulated divided by the points that were available, including extra time.
- Corsi for percentage (CF%) – The proportion of all the shot attempts the team generated and allowed that the team generated (i.e., corsi for/(corsi for + corsi against). This is used as a proxy for possession and is the best at predicting a team’steam’s future share of goals (GF%). (Source: Hockey Great Tapes – Draglikepull)
- Fenwick for percentage (FF%) – The proportion of all the unblocked shot attempts the team generated and allowed that the team generated (i.e., Fenwick for/(Fenwick for + aenwick against). This is used as a proxy for shot quality and considers shot blocking a repeatable skill.
- Expected goals for percentage (xGF%) – This is a weighting placed on every unblocked shot based on the probability of the shot becoming a goal. This depends on the type of shot, location and uses historical shot and goals data to come up with the probability for each unblocked shot.
- Goals for percentage (GF%) – The proportion of all the goals that the team scored and allowed that the team generated (i.e., Goals for/(Goals for + goals against).
- Shooting percentage (SH%) – The percentage of the team’steam’s shots on goal that became goals (i.e., total goals divided by the total shots on goal).
- Save percentage (SV%) – The percentage of the team’steam’s shots on goal against that were saved (i.e., 1-(totals goals allowed divided by the total shots on goal against)).

Pingback: Progression | The SuperFan
Pingback: Tracking the Western conference – As of December 31, 2023 | The SuperFan