What’s going on with Leon? – Part 2

The last time we checked in on Leon Draisaitl a few weeks ago, he was getting lots of points on the powerplay but really struggling to produce at even-strength. His rate of points per hour was well below his career levels, and he was posting some of the worst on-ice numbers on the team with the Oilers getting badly outshot when he would be on the ice.

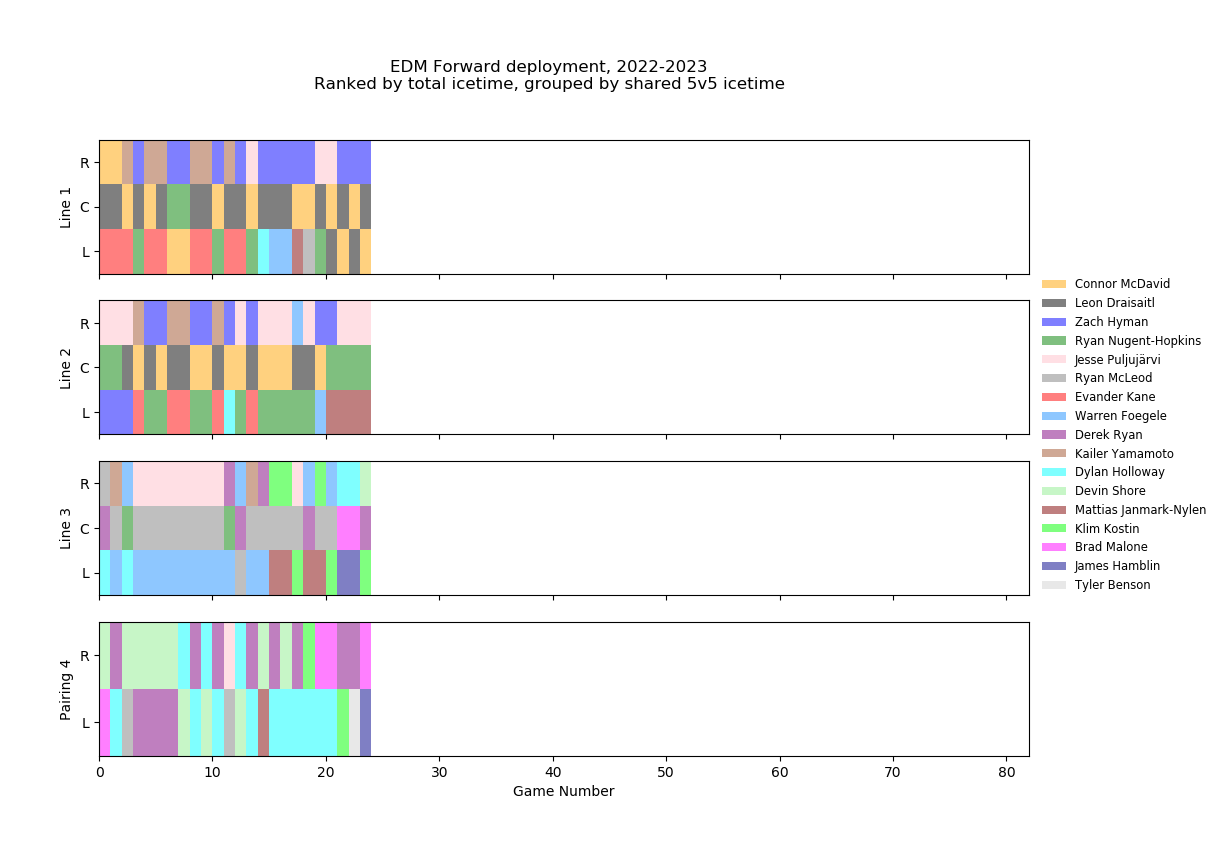
Likely recognizing Draisaitl’s issues at even-strength and the negative impact it was having on the team’s overall results, the coaching staff made some adjustments to get the forward’s even-strength production back on track. The solution: give Draisaitl more ice time with Connor McDavid.

Over the last ten games, the coaching staff has deployed the two on a line together at even-strength more consistently and it’s done wonders for Draisaitl. In these ten games since November 26th, Draisaitl has posted nine points in 166 minutes of ice time – a points per hour rate of 3.25. That’s a significant improvement from the first 20 games of the season when he had nine points in 306 minutes – a points rate of 1.76 and well below his previous three year average of 2.68.

The table below breaks down Draisaitl’s individual and on-ice numbers in the first twenty games of the season where he spent about 20% of his ice time with McDavid, and the last 10 games where he’s been McDavid’s regular wing man, spending 98% of his ice time with the captain.

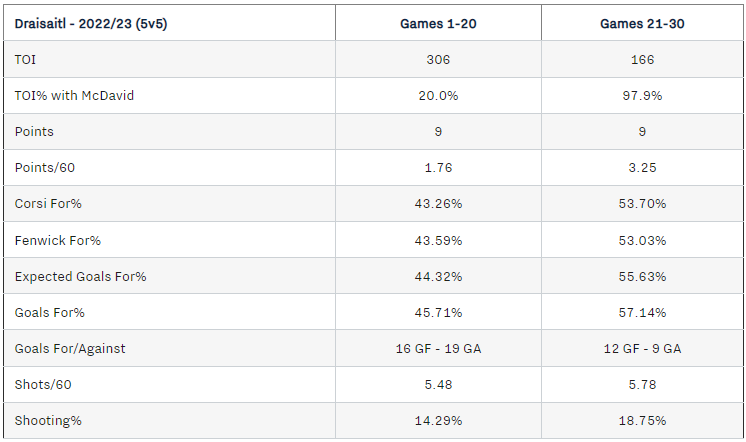
A big reason why Draisaitl has been so much more productive is the significant improvement in his on-ice shot-share numbers. Playing alongside McDavid, Draisaitl has seen his on-ice possession numbers (i.e., Corsi) and share of scoring chances (i.e., Fenwick) improve by about ten percentage points, going from around 43% all the way to 53% – levels you would expect from high-end talent. The team is spending far more time playing with the puck when Draisaitl has been on the ice in the last ten games, and the results have been much better as well. Prior to being McDavid’s regular winger, Draisaitl was posting an on-ice goal-share of 45% (a -3 goal differential). Since then, he’s posted a goal-share of 57%, a +3 goal differential in these ten games.

With Draisaitl needing to play with McDavid more often to remain productive, it does make the Oilers more vulnerable to getting outshot and outscored when the two aren’t on the ice. Instead of playing around 18 even-strength minutes per game without one of the two being deployed, the Oilers are now playing about 29 minutes per game without them. The Oilers play about 47 minutes per game at even-strength this season, meaning they won’t have one of their two star players on the ice for about 61.7% of their 5v5 time. Ideally, coaches are spreading out their offence and Draisaitl is a scoring threat on his own line, giving the coaching staff an advantage when it comes to even-strength matchups and overwhelming opponents. But if Draisaitl can’t put up even-strength points and becomes a defensive liability without McDavid, the Oilers coaching staff will need to figure out deployment and tactical strategies for the other three lines to ensure they’re not getting out-shot, out-chanced and out-scored without the two star forwards. This might also require some tweaks to the roster construction, something Oilers management has often struggled with.

Up until this point of the season (30 games in), the Oilers are posting a 49% Corsi for percentage and a 47% Expected goals for percentage when McDavid and Draisaitl haven’t been on the ice. These below-average shot-share numbers have lead to a 47% goal-share, or a -2 goal differential – a major issue for the team that has high playoff aspirations. And while the results without McDavid or Draisaitl on the ice have been better over the last ten games, it doesn’t appear to be sustainable considering they continue to get out-chanced regularly without their star players.

So while it’s great to see Draisaitl produce at even-strength again, it does come at a significant cost – one that could impact the Oilers chances of being a legitimate contender.

Data: Natural Stat Trick

Also posted at The Copper & Blue.

Dispirit

With the Edmonton Oilers currently struggling to break even at even-strength (5v5) this season, they desperately need their special teams to keep them afloat and competitive in a fairly mediocre Pacific division. And while the Oilers powerplay continues to dominate and remain one of the best in the league, the penalty kill is struggling mightily allowing one of the highest rates of goals against in the league, completely nullifying everything that their high-octane powerplay has produced.

Over the first 25 games of the season, the Oilers penalty kill has allowed 26 cumulative goals against (3 GF, 29 GA) – a rate of 12.60 goals against per hour, which is fourth highest in the league. One of the main drivers for their poor results is the team’s defensive play, as the club struggles defending the blue line for zone entries and keeping chances outside the high danger scoring areas. And this is reflected in the team’s rate of unblocked shot attempts against (a proxy for scoring chances), which is ninth highest in the league (82.98 per hour) and the rate of shots on goal against which is sixth highest (61.69 per hour).

The team’s defensive play is an issue that’s carried over from last season when they were posting similar numbers, but were being bailed out by the goaltending which posted the 10th best save percentage in the league (87.53%). This year, they’re not getting the same rate of saves on the penalty kill as the current Campbell-Skinner tandem has thus far posted a combined save percentage of 79.58% – which ranks 29th in the league. Campbell is especially struggling on a high-event penalty kill, something that was somewhat expected considering his previous team in Toronto allowed some of the lowest rate of shots against when shorthanded. Among 42 goalies who have played at least 45 minutes on the penalty kill this season, Campbell ranks 39th with a 78.90% save percentage and a -4.73 goals saved above average. Skinner isn’t faring much better, as he ranks 36th in the same pool of goalies with a 80.30% save percentage and 37th when it comes to goals saved above average with -3.21.

These results are especially frustrating when you consider the fact that everything the Oilers powerplay has done for the team has been completely offset by the defensive play and goaltending on the penalty kill. Consider the talent on the powerplay, the cost of these players, the practice time, and the chemistry that’s been developed for them to be one of the best units in the league. It’s all been washed away by a penalty kill that surrenders so many shots, chances and goals against – and preventing the powerplay from being an actual asset. Especially at a time when the Oilers are struggling at even-strength, posting a negative goal differential and below-average shot-share numbers, the Oilers can’t afford deficiencies of this scale.

The Pacific division is wide-open at this point with six of the eight teams currently posting negative goal differentials (in all situations). Fixing the penalty kill, either through tactical or deployment adjustments, has to be a top priority for the coaching staff if they intend on locking down one of the top three playoff spots.

Data: Natural Stat Trick

Also posted at The Copper & Blue.

Tracking the Pacific division – As of November 30, 2022

While the Edmonton Oilers aren’t having the greatest season, the good news is that most of the Pacific division is struggling as well. Six of the eight teams have a negative goal-differential at this point, with only Vegas and Seattle leading the pack. Worth noting too that four of the eight teams in the Central division are also posting negative goal-differentials, with only Dallas, Winnipeg and Colorado having solid seasons so far.

Team Record Points Point % Goal differential
Vegas 17-6-1 35 0.729 +20
Seattle 14-5-3 31 0.705 +16
Edmonton 13-10-0 26 0.565 -3
Los Angeles 12-9-4 28 0.560 -5
Calgary 10-9-3 23 0.523 -3
Vancouver 9-11-3 21 0.457 -8
San Jose 8-14-4 20 0.385 -15
Anaheim 6-15-2 14 0.304 -37

Despite their issues, the Oilers are still posting the third best points percentage in their division, largely driven by their powerplay which generates the third highest rates of goals per hour in the league. Everything else – even-strength play and results, their penalty kill, their goaltending – it all needs work if they want to qualify for the playoffs.

Below are the even-strength (5v5) numbers for each team in the Pacific division (sorted by points percentage) including goal-share results as well as the shot-share metrics that gives us a sense of which teams have the right processes in place and if the results are sustainable or not. I’ve also applied a basic heat-map to show which teams are doing well or struggling relative to their division foes. You can find a description of each metric at the end of this article. Also note that the shot-share metrics are score and venue adjusted based on Natural Stat Trick’s methodology.

Not much has changed for the Oilers since the last check-in at the end of October other than the goal-share dropping significantly, something that was expected considering their shot-share numbers and expected goal-share had been below average and some of the lowest in the division. And these numbers are still poor after 23 games, putting the Oilers at risk of losing ground to the Los Angeles and Calgary who are both posting some of the strongest Corsi for percentages and expected goal shares in the league. Issue for both teams is currently goaltending, which has somehow been worse than Edmonton’s, and it could sink their playoff chances if it doesn’t get sorted out. I’m also curious to see if Seattle’s powerplay, which currently ranks 7th in the league in terms of goals per hour, can continue to drive their overall results. They currently generate some of the lowest rates of shots and scoring chances on the powerplay, so I’m expecting things to cool off.

Back to the Oilers – it seems like the best idea that the coaching staff could think of to improve their 5v5 results (and to get Draisaitl going) is just putting McDavid and Draisaitl together on the ice as much as possible. In the first 19 games of the season, the duo only played 60 minutes together – or about 6.5% of the team’s total ice time. That’s still higher than what I was expecting considering they rarely played together after Woodcroft took over last season, but lower nonetheless. Over the last five games, however, McDavid and Draisaitl have played 69 minutes together – or about 29% of the team’s total ice time. In that time, the Oilers have posted a Corsi for percentage and expected goals for percentages closer to 60% and outscored opponents 5-3. Not sure how sustainable this is with both players averaging more total ice time per game, but it feels like the coaching staff is out of ideas and doing what they know will work. The concern of course will be the rest of the roster and if they can post positive shot-share metrics and goal differentials at 5v5 without their star players on the ice. Definitely something worth monitoring over the next month.

Data: Natural Stat Trick, Hockey Viz

Glossary:

  • Points-percentage (Point%) – The total points accumulated divided by the points that were available, including extra time.
  • Corsi For percentage (CF%) – The proportion of all the shot attempts the team generated and allowed that the team generated (i.e., Corsi For/(Corsi For + Corsi Against). This is used as a proxy for possession and is the best at predicting a team’s future share of goals (GF%). (Source: Hockey Great Tapes – Draglikepull)
  • Fenwick For percentage (FF%) – The proportion of all the unblocked shot attempts the team generated and allowed that the team generated (i.e., Fenwick For/(Fenwick For + Fenwick Against). This is used as a proxy for shot quality and considers shot blocking a repeatable skill.
  • Expected Goals For percentage (xGF%) – This is a weighting placed on every unblocked shot based on the probability of the shot becoming a goal. This depends on the type of shot, location and uses historical shot and goals data to come up with the probability for each unblocked shot.
  • Goals For percentage (GF%) – The proportion of all the goals that the team scored and allowed that the team generated (i.e., Goals For/(Goals For + Goals Against).
  • Shooting percentage (SH%) – The percentage of the team’s shots on goal that became goals (i.e., total goals divided by the total shots on goal).
  • Save percentage (SV%) – The percentage of the team’s shots on goal against that were saved (i.e., 1-(totals goals allowed divided by the total shots on goal against).