Before they look for goaltending again, Oilers management needs to review their previous evaluation and decision-making methods.
One of the most important parts about decision-making, especially when you’re spending significant money or assets to achieve a specific goal, is the evaluation that follows it. It’s standard business practice in the corporate world when CEO’s work to maximize the value of an entity and try to find any sort edge over their competition. Scrutinizing internal processes, finding strengths and deficiencies and re-calibrating things is a critical component when building a sustainable product.
The same approach to evaluating decision-making has to apply in professional hockey. When every corner of the roster needs to be optimized for maximum value under a salary cap system, it’s critical that teams know if their roster decisions led to positive outcomes and, just as importantly, know if their methods behind the decision process was adequate and how it can be improved going forward. With a large pool of players and a limited number of roster spots, teams are faced with recurring decisions regarding their roster construction – so refining their decision-making methods has to be top of mind.
The Edmonton Oilers are facing one of those recurring decisions, that many teams are facing this off-season, as they’ll be searching for a goaltender to potentially start a significant number of games in the upcoming year. The Oilers goalie depth chart features Mikko Koskinen, a 32 year old with 101 NHL games on his resume, and under contract for two more seasons at $4.5 million per year, along with a group of goalie prospects that have a range of potential. This list currently includes Ilya Konovalov (age 22), Olivier Rodrigue (20), Stuart Skinner (21) and Dylan Wells (22).
Koskinen has shown reasonably well as a starter at the NHL level, having now played 93 regular season games and four playoff games for the Oilers since transitioning from the KHL and SM-liiga in 2018. Among 53 goaltenders who have played at least 70 games over the last three seasons (approximately 3,000 minutes between 2017/18 and 2019/20), Koskinen’s even-strength (5v5) save percentage of 91.9% ranks 36th overall, while his goals-saved above average of -2.52 ranks 35th. The average team save percentage at even-strength over the same time period has been 92.04%, so it’s safe to say Koskinen has been a league-average goalie for the Oilers.
Considering how teams, especially in the west where travel is onerous, are moving away from a starter-backup approach to deploying goalies to more of a tandem where they can split ice-time more evenly, it’s important for the Oilers to continue doing the same. While Koskinen has provided decent netminding for the team, we know from a 2014 research article at Hockey Graphs that goaltender performance declines with age, especially after age 30 – and it’s beneficial for both Koskinen and the team if he has more time to rest between starts.
When the Oilers looked for a goalie last summer to split time with Koskinen, they signed Mike Smith, a 37 year old netminder at the time with 571 games of experience. How much time and effort was put into the analysis that led to this decision is unknown. But what we do know is that their approach to finding an NHL-caliber goaltender this off-season has to be considerably better.
Smith’s results as an Oiler were poor, which wasn’t surprising as the probability of goalies posting save percentages below league average levels increases after age 30 and accelerates after age 35. For more details about goalie aging curves, I’d recommend checking out this 2014 research article from Hockey Graphs.
This past season, Smith posted one of the worst save percentages in the league at even-strength (90.0%), ranking 52nd out of 54 goalies who played at least 1,000 minutes, or about 24 games, and allowed the fourth highest rate of goals against per hour (2.92). His individual performance was a big reason why the Oilers overall team save perentage was 25th in the league with 91.23%, allowing the sixth highest rate of goals-against, 2.72 per hour. That rate is slightly worse than what the Oilers allowed in 2017/18 when they allowed the eighth highest rate of goals (2.60 per hour) and and 2018/19 when they allowed the ninth highest rate (2.65 per hour). For context, the league average rate of goals against per hour over the last three seasons has been 2.45.
What management should hopefully be aware of is the fact that the Oilers allowed close to the league average rate of expected goals against. Expected goals measures the quality of the unblocked shots taken, and assigns a value to it depending on the probability of it becoming a goal. Key variables include the type of shot taken, where it was taken from and compares it to historical shot and goal data to determine the value. So while the actual rate of goals against the Oilers was 2.72 this past season, based on the variables from the shot data, the expected rate of goals against was 2.36 – slightly above the league average rate of 2.30.
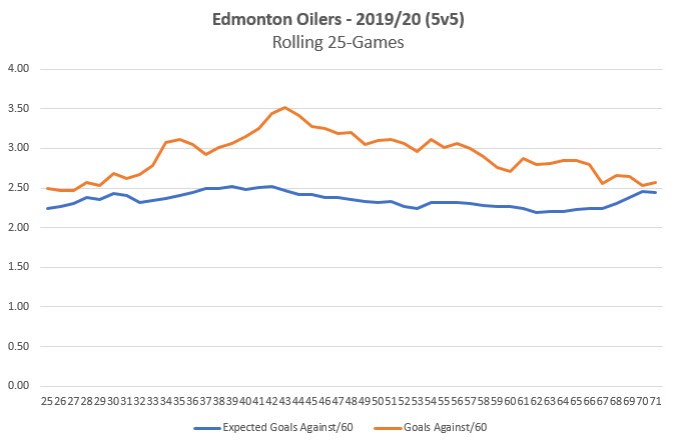
Put another way, had the Oilers allowed the same rate and quality of shots against and received league average goaltending, they would have allowed approximately 136 goals at even-strength this past season. That’s a significant improvement of about 21 goals, (they actually allowed 157), which would translate to approximately three additional wins in the standings. And a key reason why this occurred and cost the Oilers a better spot in the league rankings is squarely on the player that management brought in last summer to shore up the goaltending.
| 2019/20 (5v5) | Smith | Koskinen |
| GP | 39 | 38 |
| TOI | 1747.13 | 1702.87 |
| Shots Against/60 | 29.09 | 33.23 |
| Expected Goals Against/60 | 2.18 (19th) | 2.58 (51st) |
| Save% | 90.00% (52nd) | 92.40% (23rd) |
| High Danger Save% | 77.60% (52nd) | 85.10% (9th) |
| Goals Against/60 | 2.92 (51st) | 2.54 (34th) |
Above is a summary of how the two netminders did for the Oilers in 2019/20 at even-strength. Included for some of the metrics is each goaltenders ranking among the 54 goaltenders who played at least 1,000 minutes this past regular season. What I found interesting was that the team’s rate of expected goals against, which again measures the quality of unblocked shot attempts, was higher when Koskinen was in net than when Smith was. Thankfully Koskinen did reasonably well, ranking 23rd overall among his peers with a 92.40% save percentage, just slightly above league average levels.
Whatever methods that the Oilers management used to determine that Smith was going to improve the team’s chances of winning games has to be under immediate scrutiny by someone in the organization. The publicly available data and research into goaltending made it clear that the probability of Smith posting league average numbers was low, which begs the question: what data and information and process was the team basing such an important decision on? What metrics were used and how well do these metrics correlate with targeted outcomes? Did they set out benchmarks and key performance indicators to measure their decision? How did the Oilers evaluate the probability of the player’s performance? Whose opinions were involved?
There has to be some level of accountability and proper evaluation of these key decisions – and it should come from someone outside of the hockey operations department. Preferably, above the general manager’s office, if Bob Nicholson has the motivation and courage to do so, or even an external consultant to ensure whatever the findings are can be actioned upon. The reality is that the second place finish in the division could be masking Smith’s poor goaltending performance, as Holland stated in his end of season media availability that goaltending was a strength. And there doesn’t appear to be any motivation for the general manager to dissect the goaltending decision from the 2019 off-season, leaving the team at risk of repeating the same mistake.
To improve their chances of landing a reliable goaltender this off-season and contend for the playoffs, it’s imperative that the Oilers evaluate how the decision was made to sign Smith last summer. The methods that were used were clearly flawed and it’s critical that management explore new ways – using data analysis, scouting and possibly an outside perspective – to evaluate goaltenders.
Data: Natural Stat Trick, Hockey Reference
Glossary:
- Expected goals: Measures the quality of the unblocked shots taken, and assigns a value to it depending on the probability of it becoming a goal. Key variables include the type of shot taken, where it was taken from and compares it to historical shot and goal data to determine the value. (Natural Stat Trick)
- Goals saved above average – the goals this goalie prevented give his save percentage and shots faces vs. the league average save percentage on the same number of shots. Minimum four shots faced per team gamed needed to qualify (Hockey Reference)
Article also posted at The Copper & Blue.