Nugent-Hopkins on the Penalty Kill

Over the two seasons with Todd McLellan and his coaching staff behind the bench, the Oilers penalty kill remains pretty average. In the 2016/17 regular season, the Oilers finished 16th overall when it came to goals against/60 with 6.38, a slight improvement from the year prior when they finished 19th in the league with 6.53 goals against/60.

Looking at the rate of unblocked shot attempts against (i.e., Fenwick), which can tell us if a team’s penalty kill success is sustainable or not, the Oilers finished 15th in the league with 74.0 events against per hour in 2016/17. A lot of the Oilers success shorthanded has been thanks in large part to their goaltending, which for two years in a row now has been just above league average.

Season Goals Against/60 Fenwick Against/60 Save%
2015/16 6.53 (19th) 75.5 (23rd) 87.7 (13th)
2016/17 6.38 (16th) 74.0 (15th) 87.7 (14th)

Related: The Oilers Penalty Kill is Killing Penalties Again (2017, March 31)

Something that stands out when you dig into the most recent season is how poorly Ryan Nugent-Hopkins performed when the team was shorthanded. After six NHL seasons, and 395 regular season games, he’s developed a reputation as being a responsible centerman and capable of taking on tougher match-ups. He’s a smart, skilled player, skates well and does a great job of stripping the puck away from opponents, all of which should make him an ideal option when the team is shorthanded. So it’s surprising to see that when Nugent-Hopkins was on the ice this season on the penalty kill, the rate of unblocked shots actually increased considerably.

Below are the Oiler forwards who played at least 40 minutes shorthanded (4v5) this past season and their rate of unblocked shot attempts relative to the team average.

EDM - 4v5 - RelTM - Forwards

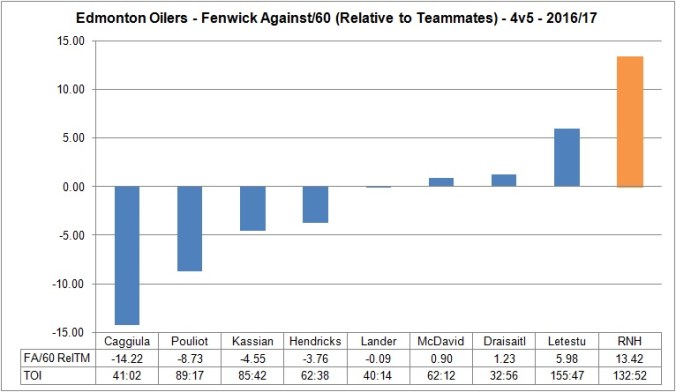
Here we see that when Nugent-Hopkins was on the ice, the rate of unblocked shot attempts was 82.19 per hour, and 13.42 higher than the team average. To put things into perspective, the worst team at suppressing shots against when shorthanded was Buffalo (90.4 per hour), followed by Arizona (81.9 per hour). And among the 101 NHL forwards who played at least 100 minutes shorthanded (4v5) this past season, Nugent-Hopkins had one of the worst rates of shot attempts against, relative to team average (97th out of 101).

What’s worth noting here is that heading into the 2016/17 season, Nugent-Hopkins had some decent success shorthanded. He didn’t get tasked with killing penalties until his third season, as the Oilers had experienced centermen like Shawn Horcoff, Eric Belaner and Boyd Gordon as regular options. But over the three seasons prior to 2016/17, he’d been pretty reliable when it came to suppressing unblocked shot attempts against.

Full article is at The Copper & Blue.

Thoughts on the Oilers’ post-season + Radio spot (TSN 1260)

handshake_Oilers_at_Ducks

I joined Lowetide on Monday morning on TSN 1260 to talk Oilers and their offseason plans. Clip is below and starts around the 20 minute mark.

Something I mentioned on air to Al which I should probably expand on is the disappointing post-season run.

Maybe I shouldn’t complain that we got to see playoff hockey after 11 years and 13 games in total. We did get some fantastic performances from Cam Talbot and Leon Draisaitl and Oscar Klefbom. And the club was one win away from the conference finals.

But make no mistake, this was a missed opportunity.

The western conference, in my mind, was wide open with no clear favorites all season. If there was a year to go all in, this was probably the one. Instead, the Oilers didn’t make any significant trades to improve their chances and I think some of their flaws, that were evident all season, cost them against the Ducks.

The defence in particular, while more experienced and healthier than years past, was an issue for the team, yet it wasn’t addressed going into the playoffs. Instead,  the Oilers gave away some of their depth to shore up their center position, which didn’t exactly work out either.

In their 13 playoff games, the Oilers were outscored 24-21 at 5v5, a pretty weak 46.67% goal-share. Their shot-shares were one of the worst among the playoff teams, with a score-adjusted Corsi For% of 48.73% and a Fenwick For% of 46.92%. Their 93.18% team save percentage at 5v5 was around league average, and was a big reason why, along with their powerplay, they won seven playoff games.

Now to get back into the same position, they’ll have to replicate the success they had in the regular season (i.e., two players in the top 10 league scoring, top 10 goaltending, +26 goal differential at 5v5) and hope that the roster stays as healthy as it did in 2016/17. We see how quickly championship windows can open and close because of injuries (Tampa Bay) and poor roster management (Dallas), so it’s crucial that the Oilers do everything possible to make the most of their opportunity with McDavid on the roster.

I want to remain optimistic that the Oilers can be in the same spot as they were this year. But losing four of their last five playoff games, allowing one of the highest rates of shots against and absolutely collapsing in game five is concerning. This off-season has to be about addressing their needs, especially on defence, and building a legitimate contender.

Data: Natural Stat Trick

Discussing the game seven loss and the Oilers off-season on the CBC Edmonton News (TV)

ANA115_Oilers_Ducks_Hockey

I joined Adrienne Pan on the CBC Edmonton News to talk about the game seven loss in Anaheim and what to expect from the Oilers this off-season. Clip is here and starts around the seven minute mark: CBC Edmonton News (2017, May 11)

Topics we covered:

  • Game seven, and how both teams did in terms of shot attempts (Data from HockeyStats.ca)
  • Which players stood out for good and bad reasons in the post-season
  • The play of Draisaitl and his upcoming contract
  • What areas of their roster the Oilers need to address in the off-season

And with the Oilers out of the playoffs, this was my last regular appearance on the news for the season. I had a lot of fun working with Adrienne and the production crew at CBC – they’re a talented group that does amazing work.

I might be on the CBC Edmonton News occasionally during the off-season, but will be back doing regular segments in the fall.

Couple thoughts on the Oilers-Ducks Series

NHL: Arizona Coyotes at Edmonton Oilers


Tonight should be fun.

If there’s any key takeaways so far, it’s that the post-season is a chaotic tournament where anything is possible. As long as you make it to the playoffs, you can do some damage. Injuries, hot streaks, cold streaks, bad bounces – these are all factors at play in the post-season and can derail any team.

This year’s playoffs is another reminder that the Oilers, even with McDavid at the helm, aren’t guaranteed a title. All we can ask for is for management to establish a proper window by building a strong roster, and put the team in a position to do well. From there, it’s anyone’s guess as to what happens in the playoffs.

A couple things that have stood out for me this series. First a quick breakdown of the 5v5 numbers over the six games.

Edmonton Even-strength (5v5) Anaheim
275 (44.3%) Shot attempts 346 (55.7%)
133 (40.7%) Shots 194 (59.3%)
141 Scoring Chances 170
13 Goals 14
92.8% Save percentage 90.2%
9.77% Shooting percentage 7.22%

A big reason why the Oilers are in a game seven has been the play of Cam Talbot. He’s had his moments, but as it sits today, the Oilers have the best team save percentage in the second round. Anaheim on the other hand hasn’t had as strong goaltending as they did in the regular season, ranking 7th among the eight teams. And it’s been their goaltender’s play on the penalty kill, which takes me to my next point.

The Oilers powerplay has been dynamite in the second round, scoring at a rate of 7.41 goals per 60, first among all the second round teams. They’re scoring around the same rate they were in the regular season (7.72 GF/60, 6th in the league), converting 15.2% of their powerplay shots against the Ducks into goals, which is only slightly higher than what they were converting in the regular season (14.4%).

They’ve also maintained a very good rate of unblocked shot attempts (i.e., Fenwicks) per hour. In the regular season, they finished 10th with 75.3 FF/60. Against the Ducks, they’re down slightly, sitting at a rate of 72.62. What this tells us is that their powerplay is good, and it’s success is sustainable.

Worth noting that the Ducks penalty kill in the regular season allowed the 10th highest rate of unblocked shot attempts against and relied heavily on their goaltending. Thanks to a 90.2% save percentage, the Ducks finished the regular season with the 4th best penalty kill unit. Now that their goaltending is sliding a bit, their penalty kill has been exposed for what it really is: mediocre.

Back to 5v5. Here’s how the Ducks forwards have done against the Oilers so far, ranked by Corsi For%.

Player TOI CF%
Antoine Vermette 70.32 60.00
Rickard Rakell 109.88 59.92
Corey Perry 85.13 59.78
Andrew Cogliano 74.25 59.38
Ryan Getzlaf 112.82 58.75
Jakob Silfverberg 87.08 58.29
Ondrej Kase 2.05 57.14
Ryan Kesler 90.70 56.44
Nick Ritchie 57.65 49.15
Patrick Eaves 44.15 47.73
Logan Shaw 40.78 47.50
Nicolas Kerdiles 18.45 45.95
Chris Wagner 49.90 44.83
Nate Thompson 44.87 42.25


Have to wonder if potentially losing Nate Thompson is really a big deal for the Ducks. While the team as a whole is crushing the Oilers in Corsi For%, the Ducks post a 42.25% share of shot attempts with him on the ice. This is also a really good reason why the Oilers need to have offence on all four lines, so that they can expose these types of weaknesses. Draisaitl is obviously a big part of the line combinations, but the depth players need to be better at 5v5.

Here’s how the Oilers forwards have done at 5v5, again ranked by CF%.

Player TOI CF%
Ryan Nugent-Hopkins 79.77 51.37
Benoit Pouliot 63.55 50.39
Jordan Eberle 68.67 47.37
Patrick Maroon 94.02 46.22
Connor McDavid 98.67 44.30
David Desharnais 55.72 43.75
Leon Draisaitl 94.82 43.46
Drake Caggiula 62.40 42.62
Anton Slepyshev 68.80 41.55
Milan Lucic 85.55 40.70
Mark Letestu 65.03 40.00
Zack Kassian 60.50 38.46

You’d think if RNH ever breaks out of his slump, it would be tonight. He’s done well by the shot and possession metrics, but just can’t buy a goal. And if you’re wondering why the Ducks were okay with moving Perry up to the top line, it’s because they really don’t have to worry about the Oilers depth players.

Data: Natural Stat Trick

Couple thoughts on Leon Draisaitl and overvaluing assets

leon-draisaitl

With Leon Draisaitl, there’s plenty to be excited about. He’s had a tremendous 2016/17 season, posting 77 points in 82 regular season games, 40 of which were at even-strength. And his 2.03 points per hour was third among Oiler forwards. In 12 playoff games, Draisaitl has a total of 16 points, 9 of which have come at even-strength, and a team leading rate of 3.09 points per hour.

This is obviously an asset that the team needs to have if they intend on building a championship.  Draisaitl has posted 128 points now in 154 regular season games over the past two regular seasons. Regardless if you think he’s a driver or a complementary winger, it’s clear he has NHL talent, which is incredibly encouraging considering he’s only 21 years old.

The issue for me is that the Oilers need to be careful not to overvalue him, or any other player for that matter. Managing the cap and allocating dollars efficiently is going to be critical. The last thing the Oilers want to do is limit their options when managing their roster, especially when a championship window is opening up for them. Flexibility is  going to be critical if the team wants to annually contend for a championship.

When it comes to Draisaitl, it’ll be important that the Oilers sign him long-term, but they should be trying to bring down his asking price. A few things worth noting when it’s negotiation time.

In the 2015/16 season, Draisaitl’s most common winger was Taylor Hall. In 878 minutes together at 5v5, the Oilers posted a Corsi For% of 51.6% (+3.88 rel), and more importantly a goal-share of 51.2% (+9.32 rel), as the Oilers outscored opponents 42-39. In the 159 minutes without Hall but with Draisaitl, the Oilers posted a Corsi For% of 53.55% (+4.43 rel) and a goal-share of 50% (+4.76 rel). Those are all well and good, but the fact is Draisaitl’s own offence disappeared without Hall as his winger. With Hall, Draisaitl put up 2.32 points per hour, but without him that scoring rate plummeted to 1.13. Worth noting that Draisaitl’s on-ice PDO was between 99 and 100 with and without Hall, so there weren’t any real percentages influencing the numbers. This was also Draisaitl’s first full season in the NHL, so it’s expected that this numbers would be influenced to some degree by other factors.


In the 2016/17 regular season, Draisaitl spent 670 minutes at even-strength with McDavid and absolutely killed it, as the Oilers posted a Corsi For% of 53.7% and a goal-share of 59.4%. But in over 500 minutes away from McDavid, the Oilers with Draisaitl on the ice posted a pretty weak Corsi For% of 47.9% and a goal-share of 44.2%, both numbers well below where the team needs to be. Draisaitl’s own rate of point production also took a hit going from 2.23 points per hour with McDavid on the ice with him to 1.80. That rate of point production without McDavid with him isn’t bad, but it’s worth noting that the team’s PDO was also at 105 in this scenario, meaning the Oilers may have been getting a little lucky.

The post-season has also been great for Draisaitl as he has continued playing the bulk of his minutes with McDavid. With Draisaitl on the ice, the Oilers have posted a 49.0% Corsi For%, and a goal-share of 70.6%, outscoring their opponents 12-5. What’s worth noting here is that Draisaitl’s on-ice shooting percentage is sitting at 14.0%, which is well above his regular season on-ice shooting percentage of 9.72%, and one of the highest among all forwards. The beauty of the playoffs is that there really isn’t enough time for a player’s on-ice percentages to regress towards their career averages, so I don’t expect Draisaitl’s numbers to crash. But when the team evaluates the player and the sustainability of offensive contributions, it’s important to look at things like PDO and confirm if a player’s numbers were real or not.

Signing Draisaitl to a long-term deal will be important for the Oilers as they build a championship contender. The concern should be whether or not Draisaitl can drive the secondary offence, and how the Oilers will build a roster around their young core.

Data: Hockey Analysis, Corsica Hockey

How the Ducks have done against Calgary and Edmonton in the post-season

Something I touched on last night was how the Ducks have dominated the Oilers at 5v5 this series, outscoring them 12-6, and posting a Corsi For% of 55.5%. A big reason why the Oilers are in the series and tied with the Ducks is their powerplay and Talbot’s performance in game two.

Here’s a breakdown of the goal and shot-share the Oilers have posted in their four games against Anaheim.

EDM vs ANA

What’s interesting is that while the Flames got swept in the first round by the Ducks, their event-shares were better than the Oilers over their four games.

The difference?

A shooting percentage of 1.94%(!), which is absurdly low (average is usually around 7-8% in the regular season), and some mediocre goaltending. They finished their series having been outscored 9-2. Side note: the Oilers currently have a 7.59% shooting percentage this series.

CGY vs ANA

The Oilers have generated 1.95 goals/60 against Anaheim, while the Flames only generated 0.64. What’s worth noting is that the Flames allowed 2.87 goals against/60, while the Oilers have allowed 3.9 goals/60. The Oilers team save percentage (88.9%) in the second round has actually been worse than Calgary’s was in the first round (90.3%).

In terms of generating and allowing events against the Ducks, the Flames were the better team compared to Edmonton. The metric that jumps out for me is the rate of shots on goal each team allowed. The Oilers are allowing 35 per hour, while the Flames allowed 29.

Events vs Ducks

The Oilers are fortunate to be in the series, considering their outputs. They’ll need a strong performance from their top line, and do a better job defending and suppressing shots.

And a friendly reminder: Anything can happen in the playoffs.

Data: Natural Stat Trick

Game four and How the Oilers have matched up against the Ducks on the CBC Edmonton News (TV)

hkn_ducks_oilers_20170503

I joined Adrienne Pan on the CBC Edmonton News this evening to talk about game four and how the Oilers have matched up against the Ducks in the series. Clip starts around the 18 minute mark: CBC Edmonton News (2017, May 4)

Topics we covered:

  • What happened after their great start in the first period
  • Missed calls and penalties
  • How the Oilers match up with the Ducks (Goals, shots, scoring chances, goaltending)
  • Eberle’s struggles
  • Potential changes for game five

ANA vs EDM - AFter four games - 20170504

Things to Consider Before Splitting up the Second Line

The line of Ryan Nugent-Hopkins, Jordan Eberle and Milan Lucic is taking some heat because of their lack of production, especially at even-strength (5v5). Over the nine games this post-season, Lucic and Eberle each have an assist, while Nugent-Hopkins has not registered any points at even-strength. As a trio, their on-ice goal-share is 25%, as they’ve been on the ice for one goal-for and three goals against. But before splitting them up, there are a couple things to consider.

  1. The trio have played the most minutes together this post-season for the Oilers (85.37 minutes) and have often been out against the other team’s top lines.
  2. In the previous series, they played the most minutes against Pavelski and Thornton. Currently, they’re playing the majority of their minutes against Ryan Getzlaf.
  3. There have been 45 different line combinations across the league this post-season that have played at least 30 minutes together. Among the 45, the trio rank 7th in terms of adjusted Corsi For% and Fenwick For%. They rank 13th when it comes to Expected Goals.
Metric (5v5) Share Rank
Corsi For% 58.40% 7th
Fenwick For% 59.08% 7th
Expected Goals For% 55.83% 13th


4. The underlying numbers they have posted together in the playoffs are consistent with their numbers from the regular season. Over 330 minutes, the second most on the Oilers, they finished the year with a goal-share of 50.0%.

5. The Oilers as a team have the following numbers this post-season: Corsi For% – 49.92%, Fenwick For% – 47.55% , Expected Goals For% – 48.06% , Goals For% – 42.86% (12 goals for, 16 goals against). The club overall is a better team when RNH, Eberle and Lucic are on the ice together. Their relative-to-team stats are solid.

Line TOI CF% FF% xGF% GF/GA
Lucic-RNH-Eberle 85.37 57.65 58.47 55.13 1-3
Maroon-McDavid-Draisaitl 57.60 48.82 41.38 43.53 4-2
Caggiula-McDavid-Draisaitl 33.15 58.23 54.55 66.22 1-0
Caggiula-Letestu-Kassian 44.64 40.00 39.39 37.35 0-1
Pouliot-Desharnais-Slepyshev 46.43 46.51 50.00 53.82 2-0

6. When RNH, Eberle and Lucic are on the ice together, the team has a penalty differential of +4, which is the best differential among the 45 different line combinations. The team has drawn 5, Eberle himself has drawn 3, and taken 1. Only three line combinations have not been on the ice for a penalty against their team. The Oilers powerplay is good and needs to get as many opportunities as possible.

7. This line is above average when it comes to generating shot attempts and unblocked shot attempts (per 60), ranking 13th among the different line combinations this post-season.

8. This line is above average when it comes to suppressing shot attempts and unblocked shot attempts (per 60), ranking near the top 10.

9. RNH, Eberle and Lucic finished the season with a shooting percentage of 6.13%. They’re currently at 2.13%.

Data: Corsica Hockey, Natural Stat Trick

Full article is at The Copper & Blue.