In case you missed it, Darcy McLeod and G-Money have developed WoodMoney, a new metric to evaluate how players have performed against different levels of competition. What they did was take every NHL player and classify them, using some pretty sound criteria (i.e., point production, ice time, Corsi Rel), into one of three categories: Elite, which are the top end players, Gritensity, which are lower end, replaceable-type players, and Middle, which are those that did not fall under the Elite or Gritensity group based on Darcy’s and G-Money’s criteria.
From there, they used the data available from NHL game sheets to determine how much time each player played against the different categories, and also how they performed when it came to possession and shot quality. The methodology and process to classify the players can be found at Because Oilers along with a link to the complete data-set. I highly recommend reading Darcy’s article to understand the duo’s rationale behind the new metric and why quality of competition is important. A couple links that explain G-Money’s Dangerous Fenwick metric, which measures shot quality, is also below.
Watching Oiler games and reviewing the deployment data available on great sites like Natural Stat Trick and Hockey Stats, we know that coaches try to find the match-ups they want and do everything they can to get specific players out against specific lines. Game-to-game, we can get a sense of which players are drawing the toughest opponents, which are getting time against the fourth liners, and how they perform. And with WoodMoney, we can start to aggregate each player’s outputs (i.e., shots, shot quality) against the different levels to add another layer of information to our analysis.
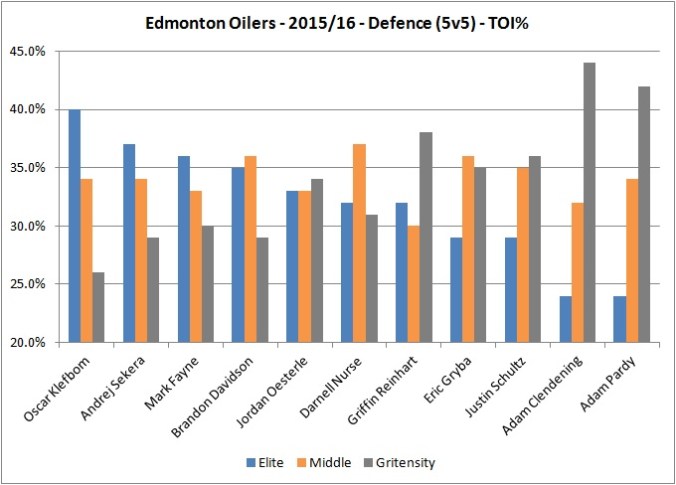
Two areas in particular that have been of interest to me since last summer when it comes to quality of competition are defencemen and bottom six forwards. In my opinion, neither area was addressed properly last summer by the Oilers, and it showed throughout the regular season. The team did add two experienced players in Lauri Korpikoski and Mark Letestu to their bottom six, but neither of them had a history of driving play or producing goals. As for the defence, the club added Andrej Sekera, who filled in admirably as a top pairing defenceman, and saw their faith in Brandon Davidson payoff very nicely. But the Oilers took a risk, an unnecessary one, starting the season with Griffin Reinhart, Eric Gryba and Andrew Ference.
Full article is at The Copper & Blue.
 With training camp a few weeks away, the discussion around potential line combinations will begin to ramp up. With Milan Lucic joining the forward group, and new prospects like Jesse Puljujärvi and Drake Caggiula entering the system, along with older prospects like Jujhar Khaira and Anton Slepyshevpushing for spots, the possibilities are endless.
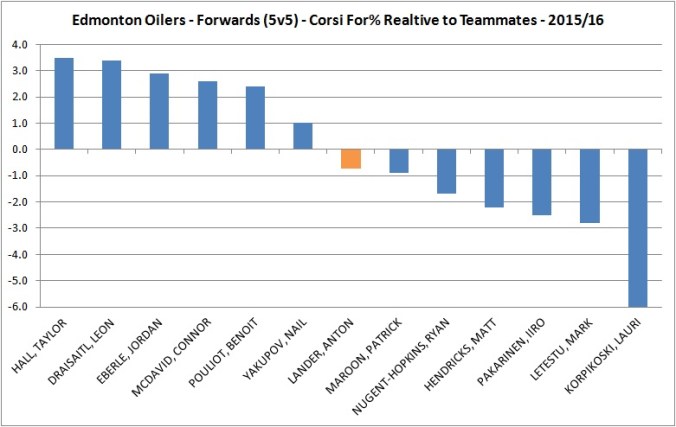
/cdn0.vox-cdn.com/uploads/chorus_asset/file/6754383/UsageChart_-_NJ-20152016.0.jpg)