Checking in on the Oilers Penalty Kill

Recently, I took a look at the Oilers powerplay to see if their goal production with the man advantage was sustainable, or if there were other issues at play here. My key takeaway from that review was that with their current rate of shot production, which ranks well below the league average, their goal scoring is likely to dry up. What was also interesting to me was that when the right-handed players were on the ice, the club did much better generating shots. Unfortunately, there aren’t enough of them on the team, which is something the team has not yet addressed.

I figured now would also be a good time to check in on the Oilers penalty kill, which ranks 4th in the league with 90.2% efficiency, and allowing 3.54 goals per hour, which has them 4th best in the league. But if we look at the total unblocked shots against, the team ranks well below average, sitting at 79.7 shots per hour, which is the 8th highest in the league. A big reason why the Oilers are doing so well shorthanded has been the stellar play of goaltender Cam Talbot, who has started all but one of the games. The team’s save percentage shorthanded sits at 93.55%, third best in the league. Talbot himself is posting a 94.92 save percentage, second in the league among goalies who have played at least 50 minutes on the penalty kill this season. Coming into the season, Talbot has posted a 90.52% save percentage shorthanded over the course of 113 games split between Edmonton and New York, so it’s likely his current numbers will eventually regress to his average. Worth mentioning here that the 90.52% ranks him second among all goalies over the previous three seasons who have played at least 500 minutes on the penalty kill.

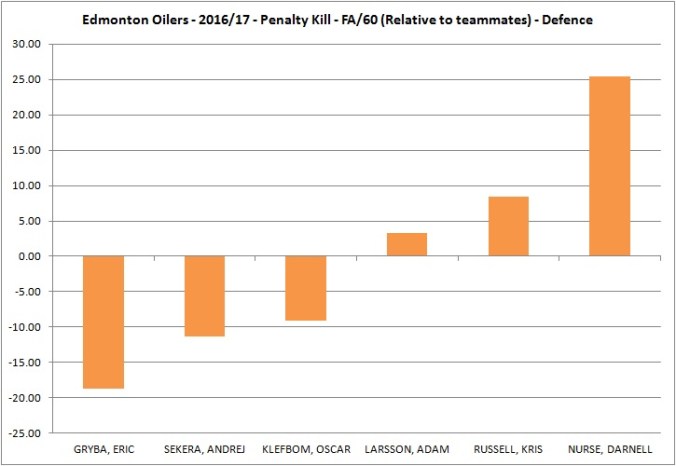
That’s all well and good and we can hope that Talbot maintains his performance. But the team would also be better off limiting those shots against in the first place. Below is the list of forwards and defencemen, ranked by ice time, who have played at least 10 minutes on the penalty kill this season. Included is the player’s ice time and the rate of shot attempts against that happen when they’re on the ice as well their shot attempts relative to their teammates. I’ve also included the ‘relative to teammates’ number to give a sense of how their teammates do with and without them. In this case, a negative number is a good thing.

PK - 20161110 - D.jpg

Full article is at The Copper & Blue.

Checking in on the Oilers Powerplay

After some early season struggles, the Oilers look to have improved their powerplay efficiency as the club currently ranks 9th overall at 89.5%. Worth noting that their shooting percentage with the man advantage is hovering around  14.8%, which is just slightly above the league average of 12.7%.

This is all well and good until you dig in a little deeper and examine their rate of shot generation. For powerplay analysis, I prefer using Fenwick For/60, or the unblocked shot attempts per hour (FF/60), for a couple of reasons. Assistant coach Jay Woodcroft, who manages the team powerplay,  emphasized last season, and again this past week, the importance of shots getting through and to break down the opposing team’s penalty kills by sustaining pressure (Source: Inside Sports, 630 CHED). Fenwick For/60 has also been shown to be a good predictor of future success with the man-advantage (Source: Objective NHL), with the majority of successful powerplay teams being able to maintain their rate of unblocked shot attempts through a season.

The Oilers currently rank 22nd in the league when it comes to FF/60 on the powerplay. Their 65.5 unblocked shot attempts per hour is below the league average of 73.2, and well behind Washington and Los Angeles who are generating more than 90 shot attempts per hour with the man advantage.

oilers_pp_-_20161108-0

Full article is at The Copper & Blue.

Corsi Percentage Combinations Between Forwards and Defencemen

Following the loss to the Rangers on Thursday night, the Oilers appear to be shaking up their forward line combinations. Prior to the game, I had looked into how the four most common lines have done thus far and found that three of the four lines have actually done reasonably well together when looking at possession and expected goals. Draisaitl’s line with Maroon and Puljujarvi was the one that I thought would show poorly in my analysis, but it appears that they have had some bad luck finishing their chances and should be expected to bounce back. Looks like the team is making changes regardless.

One thing I like to do periodically through a season is see how each defenceman has done with each of the forwards when it comes to their share of total shot attempts (i.e., Corsi For percentage, CF%). This is just a quick way to see if there are any patterns and any areas for concern when it comes to player deployment.

cb-20161105

Full article is at The Copper & Blue.

Oilers Looking Better Than Last Season

Originally part of the Good, Bad and Ugly post over at The Copper & Blue.

Coming off of a shootout win against the Islanders, the Oilers have now collected 17 points (0.708 points percentage) and sit on top of the Pacific Division, five points ahead of the Sharks, Ducks and Kings. Their +8 goal differential (all situations), ranks them third in the Western Conference, only behind Chicago (+12) and Minnesota (+11). After scoring twice on the powerplay in three attempts, the Oilers now rank 15th in the league with the man-advantage with 19.4%. They also rank 2nd overall when it comes to the penalty kill, sitting at 91.7%. Special teams performance fluctuates throughout the season, but that’s a nice way to end the week.

This team might cool off over the course of the month, especially with a tougher schedule coming up, but up until this point the Oilers are actually posting some numbers that indicate that they might be contending for a playoff spot in March. The Oilers rank 16th in the league when it comes to score adjusted Corsi For percentage (CF%), at 49.27%. This is up by a 1.18% from last season, when it was 48.09%, 20th in the league. (Source: Natural Stat Trick)

Why is Corsi For percentage important this early in the season? Because, as Charlie O’Connor of Broad Street Hockey demonstrated recently, it’s a good predictor of rest-of-season Corsi For percentage. And Corsi For% over a number of games is a good predictor of goals, which I hear is important for winning games. Here’s a list of the top 10 teams from 2015/16, ranked by their adjusted Corsi For percentage.

TEAM CF%
Los Angeles Kings 56.85
Anaheim Ducks 53.07
Pittsburgh Penguins 52.92
Nashville Predators 52.73
Dallas Stars 52.66
Tampa Bay Lightning 52.65
St Louis Blues 52.38
San Jose Sharks 51.9
Detroit Red Wings 51.78
Washington Capitals 51.52

We can also have a little more confidence that we’re looking at the ‘real’ Edmonton Oilers now as their PDO sits at 100.3. Both their shooting percentage (7.87%, 15th) and team save percentage (92.41%, 14th) at even-strength is right around league average again.

Having a CF% of 49.27% puts them right around where some of the playoff bubble teams, like Boston, Philadelphia, New York Islanders and Florida, were sitting last season. This doesn’t guarantee teams anything, but it increases their chances of making the playoffs considerably by having good possession numbers. Carolina, for example, had a great possession numbers throughout last season, but they also had the second worst team save percentage. Toronto was in a similar situation as they did well possession-wise, but they were sunk by poor goaltending and the worst shooting percentage at even-strength. The Oilers are a in a good spot with good goaltending from Cam Talbot (as long as he stays healthy), and enough skill up front to finish their scoring chances. If they can maintain a good CF%, by using the right on-ice tactics and deploying players properly, they should be able to compete for a playoff spot.

Reviewing the common line combinations this season and if changes are required

With the OIlers in a two game losing streak, and the looming regression hovering over them, I thought it would be worth looking into the current line combinations up front and to see if any changes are needed. Outside of the top line of Lucic, McDavid and Eberle, there hasn’t been consistent production, especially from forwards Maroon, Draisaitl and Puljujaarvi. I’m giving Nugent-Hopkins, Pouliot and Kassian a bit of a pass as they’ve been taking on the opposing team’s best players, and are doing a nice job playing on both sides of the puck. But I’ve still included them in this analysis to see how they compare to the other line combinations.

After 10 games, the Oilers have played four combinations with regularity at even-strength. Below is each line’s adjusted possession numbers, their expected goals (xGF%), which is a weighted shot metric, as well as their actual share of goals at even-strength. I’ve also included the difference between the lines actual share of goals (GF%) and their expected share of goals (xGF%) to see how far they might be from their expected levels. I’ve also included each line’s PDO, which has been used to measure their overall luck as both shooting and save percentage can be somewhat unpredictable. The data and the methodology behind expected goals is from Corsica Hockey.

cb-20161103

Full article is at The Copper & Blue.

Checking in on the Pacific Division

The Oilers are in a nice spot right now with a record of 7-2-1, good for second in the league, and fifth in the league when it comes to goal differential with +9. Their points percentage, which is their total points divided by the maximum points available, is second in the league, only behind Montreal, with 0.750 (Source: Hockey Reference).

What’s worth looking at this point is not only where the Oilers rank in the league, but also where they rank in their division. Please note, all data is for even-strength situations only. I’ve included Corsi For% as a proxy for possession, expected goals (xGF%), which attaches a goal probability to each shot, the actual share of all of the goals (GF%), as well as the team shooting and team save percentage. (Source: Corsica Hockey)

Full article is at The Copper & Blue.

Keeping an eye on the shots against

Oilers head coach Todd McLellan talked about areas of improvement yesterday, focusing on the number of shots the team is currently allowing.

In my opinion we’re still giving up too many shots. It’s a catch-22. Because I’d like us to be a volume shooting team, which means you get some from bad angles, from really, non-scoring areas, but it keeps the other team on its toes. I think we’ve been giving up some of those perimeter shots. We’ve also been giving up a lot of shots on our penalty kill, which has to get better in certain areas. A lot of shot  attempts are from face off losses, which is an area of concern. So I think there are three or four areas that we can tighten up and bring that shot total down. (Source: Inside Sports, 630 CHED)

First, let’s verify McLellan’s claims.

If we look at all situations over the first seven games, the Oilers have allowed 61.28 shot attempts per hour, which is the fourth highest in the league only behind  Long Island, Columbus and Dallas (Source: Corsica Hockey). Of the 420 minutes they’ve played, they’ve played 47 minutes killing penalties, which is the 5th most in the league. And when it comes to shot attempts on the penalty kill, they have the sixth highest rate of shot attempts against. The Oilers are also 19th in the league when it comes to faceoffs in all situations.

Full article is at The Copper & Blue.

Who’s Ready to Kill Some Penalties?

An area that the Oilers have struggled with in pre-season has been the penalty kill. And that was on full display in their recent game against Winnipeg, who scored four powerplay goals on their way to a 5-1 win over Edmonton. Yes it’s only pre-season, but if we look at what options the Oilers have for their penalty kill once they start playing meaningful games, it’s not looking pretty.

Last season, the Oilers finished 18th in the league when it came to killing penalties, with an 81.1% success rate (Source: Sporting Charts). And when it came to limiting unblocked shot attempts against (i.e., Fenwick), which is a good predictor of future success on special teams, the Oilers ranked 23rd in the league with 74.5 (Source: Hockey Analysis).

Full article is at The Copper & Blue.

Looking into how the Oilers can best utilize Maroon this coming season

One thing worth watching in training camp is where forward Patrick Maroon will slot in among the group of forwards. The 28 year old was brought in to bring in size and versatility, and has also shown the ability to put up points, typically when on a line with offensive players. Maroon will cost the Oilers $3.0 million over the next two seasons, a fairly reasonable price point, before becoming an unrestricted free agent in the summer of 2018.

Following his arrival to Edmonton from Anaheim on trade deadline day, Maroon played in 16 games and produced very well playing mostly with Connor McDavid and Jordan Eberle,  notching 14 points (8 goals, 6 assists). His points per 60 shot up to 2.84 at even-strength, highest among all Oiler forwards, up from the paltry 1.00 points per 60 he posted last season with Anaheim.

Without a doubt, Maroon benefited from playing alongside McDavid, as the rookie typically had a positive impact on any of his linemates when it came to possession and production. The two along with Eberle played a total of 119 minutes at even-strength near the end of the season, finishing with a Corsi For percentage of 47.49%, an Expected Goals For percentage, which measures shot quality, of 53.27%, and a Goals For percentage of 69.23%, good for second among all line combinations that played at least 50 minutes together. The trio scored 17 goals together, which translates into a Goals For/60 of 4.51, good for 24th in the league. Their success however seems to be driven largely by a higher than team average shooting percentage and save percentage, as their PDO was at 107.33. (Source: Corsica Hockey).

Full article is at The Copper & Blue.

The Gryba and Davidson Partnership

I didn’t think I’d ever say this, but I’m okay with the Oilers signing Eric Gryba to a Professional Tryout (PTO) agreement. The 28 year old, right shooting defencemen is expected at training camp, with a pretty good shot at making the team. It’s a low risk move that creates competition for one of the depth spots on the roster. And it should, in my opinion, make it harder for both Darnell Nurse and Griffin Reinhart to make the opening night lineup I have no hesitation in saying that both Nurse and Reinhart, who I think are good prospects, need extended time to develop at in the AHL. There is no harm in having these two play top pairing minutes, in all situations, against AHL-level competition in Bakersfield, until they’re ready to contribute on a consistent basis.

Back to Gryba, the things that he has going in his favor are his performance numbers from last season playing with young Brandon Davidson. They were one another’s most common defence partner, having played a total 279 minutes together at even-strength, predominantly as the third pairing on most nights, but did move up into the top four on occasion. Their 53.48 CF% at even-strength was second best among all Oiler defence pairings that played more than 50 minutes together (18 defence pairs in total). Source: Corsica Hockey.

Full article is at The Copper & Blue.