Priming Game: How much does Evan Bouchard mean to the Oilers?

One of the most common questions I got from hockey fans and even non-hockey fans this past summer was whether or not defenceman Evan Bouchard is worth his new four-year, $42 million contract.

It’s obviously a significant sum of money for a player who has often been picked on for his defensive lapses. But there’s also enough evidence to indicate that he’s a solid contributor to the team, and not just with the points he’s consistently put up. Whatever the case, Bouchard is going to serve as yet another good example of how defencemen are often evaluated incorrectly.

In this exercise, we’ll just focus on the player and try to answer a rather simple question: “Is this guy good?”

I’ve learned over the many years that I’ve been covering professional hockey is to try and lay out your criteria before answering open-ended questions like this. It makes it significantly easier as a writer to put together a (hopefully) influential piece. And it can help drive a discussion if people know where the original goal posts are.  “Good” means different things to different people. And the criteria will depend on the player’s role and can also be impacted by key contextual information like the team’s current state and where they are in their path to a championship.

When evaluating defencemen who are on heavier contracts like Bouchard, I have some pretty straight-forward criteria – all of which align with teams winning games.

  • The player must be playing regular minutes against the other team’s top competition at even-strength (5v5).
  • The player must have a positive impact on the team’s shot and scoring chance differentials at even-strength (5v5).
  • The player must have a positive impact when playing with their own team’s depth players, as in when superstar players like McDavid and Draisaitl are on the bench.

What’s missing from here is actual point production. Regarding defencemen, a smart guy once said, “points aren’t offence”. To measure a defenceman’s offensive contributions, it’s better to look at the actions of the player that helped increase the team’s odds of outscoring opponents. And part of that can be captured by reviewing the team’s ability to control the flow of play and scoring chances, which is captured in the criteria above. Points are the by-product and can always be influenced by a team’s shooting percentage and save percentage, making it somewhat difficult to predict as it’s not a repeatable skill. If you’re paying for talent, always pay for their performance, not the results. Pardon the slight digression.

Time on Ice

Evan Bouchard has gradually seen his minutes climb since entering the national league, now averaging 23.5 minutes (all situations) per game as a 25-year-old and establishing himself as a top pairing defenceman. He finished 25th in the league in average ice time per game among defencemen in the 2024/25 regular season.

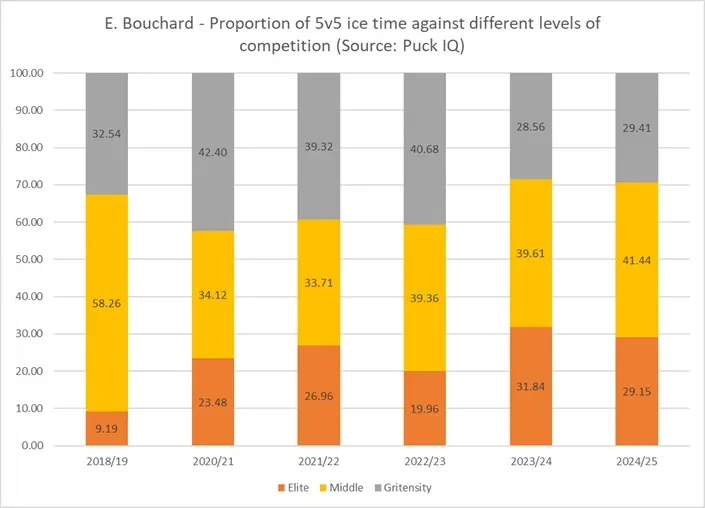
What’s most impressive has been the gradual increase in his proportion of even-strength minutes against the opposing team’s best players.

.

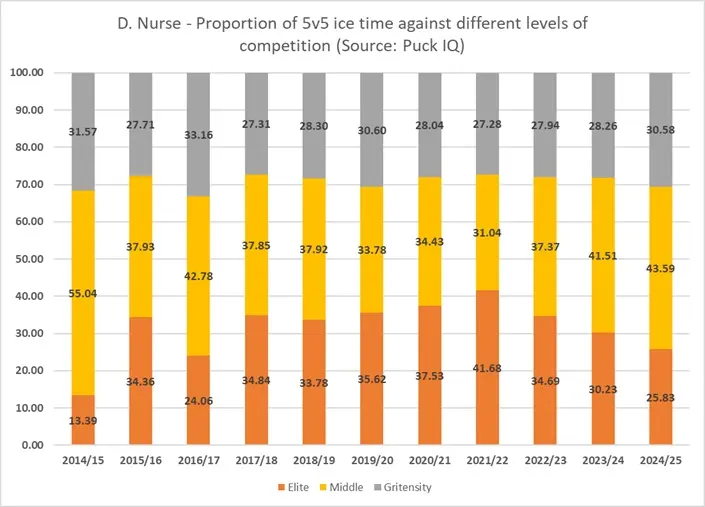
Based on PuckIQ’s data, Bouchard played just over 29 percent of his total even-strength minutes against elite-level competition last year and almost 32 percent the year before. That has him second on the team behind Matias Ekholm, with whom he regularly partnered on the top pairing, and among the other top pairing defencemen in the league. Bouchard has clearly gained the trust of the coaching staff and has taken these critical minutes away from other struggling players like Nurse, who has seen his share of minutes against elite players drop drastically over the last few years.

The added bonus to all of this is the fact that Bouchard’s on-ice numbers against elite players have been excellent. He posted an on-ice Corsi For percentage of 57 percent this past season against elite competition and 59 percent the season before. Not sure what else you can ask for from a defenceman when they’re helping control the flow of play and keeping the puck away from the opposing team’s best players.

Driving Offence

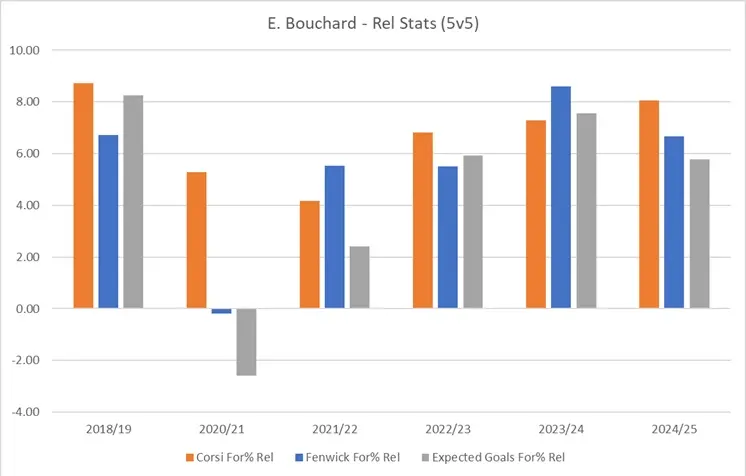
What we’ve also seen from Bouchard, pretty much every year now, is that when he’s on the ice, the Oilers improve their ability to out-shoot and out-chance opponents. Last season, the Oilers posted an Expected Goal-share of 54.46 percent at even-strength, which was fourth best in the league. Without Bouchard on the ice, this number dropped to 52 percent. But with him, it jumped to about 58 percent. So relative to the team, Bouchard’s on-ice expected goals for percentage was a +5.79.

What’s especially impressive is that this has been the case since he started getting regular minutes, and it doesn’t appear to be slowing down. Whether it’s shot attempts, unblocked shot attempts, or scoring chances, the team sees their numbers consistently improve when he hits the ice.

Have to point out here as well that in those limited games early on his career in the 2018/19 season, Bouchard was showing glimpses of his potential impact. Definitely one of the many missed opportunities by the previous management regimes.

.

Supporting the Depth Players

Now, the obvious rebuttal to these strong on-ice numbers posted by Bouchard is that he gets to play prime minutes with guys like McDavid and Draisaitl, who have their own magic fairy dust. But what’s impressive is that even when Bouchard doesn’t have one or both Glimmer Twins with him, the Oilers’ on-ice numbers are still better than 50 percent.

Last season, when Bouchard was on the ice with the depth forwards (so without McDavid or Draisaitl), the team posted a Corsi For percentage of 56 percent and an Expected Goals For percentage of 50 percent. When the depth players didn’t have Bouchard on the ice with them, these numbers fell below 48 percent. In previous seasons, these numbers were even worse. Bouchard is a big reason why the team has been able to outscore opponents when McDavid and/or Draisaitl are on the bench – an issue that plagued the team for years because of the incompetence of the front office and their inability to build an optimal roster.

Final Thoughts

While the cost to sign Bouchard was high, I would argue that it’s well worth it. He plays, and thrives, against elite opponents. The team consistently does better with him than without him when it comes to controlling the flow of play and scoring chances. And Bouchard has played a significant role in improving the team’s depth scoring.

Obviously, it would have been ideal to bring the cost of the contract down, but that would have required previous management regimes to identify his talents earlier on in his career and take on some risk. But that didn’t happen.

The good news is that Bouchard has a proven track record of being a positive influence on his team’s overall performance – helping drive offence on one end of the rink and keeping the puck away from the other end. He’s going to have his blunders that end up in the back of the net. But you have to remember the real, tangible impacts this player has on the team. And how difficult it would be to replace his exceptional attributes.

Bouchard is going to be a big part of the Oilers’ priming group that’s pushing for a Stanley Cup.

Data: PuckIQNatural Stat Trick

Also posted at Oilersnation.

Losing the end game

Disappointing end for the Edmonton Oilers who were defeated soundly by the Florida Panthers. After rolling through the western conference, dominating territorial play, and getting production from across the roster, the Oilers could not keep up with the Panthers. While there were some reasons for optimism after the first four games of the series, all of that was put to rest with the Panthers outscoring Edmonton 10-3 in games five and six. Florida had more high-quality players than Edmonton and controlled every facet of the game.

Here’s how the two teams compared in the final series at even-strength (5v5). The Panthers out-scored Edmonton 16-10 (a 62 percent goal-share), which aligned well with their underlying shot-share numbers. The Panthers titled the ice consistently, pouncing on the Oilers blunders, taking smart risks, sustaining pressure, and generating chances. And it was reflected in their Corsi for percentage (55 percent) and expected goals for percentage (57 percent) – just outstanding numbers which aligned with how they had performed in their first three rounds in the eastern conference.

The only time the Oilers were a threat against the Panthers at even-strength was when McDavid and Draisaitl were on the ice together. They played 70 minutes (about 20 percent of the Oilers total time) and posted a Corsi For percentage of 59 percent and an Expected Goals for percentage of 57 percent – indicating that the Oilers controlled the flow of play and scoring chances. The issue was that they could not finish their chances, scoring only one goal and allowing five against (a goal-share of 16 percent). That’s far below the results we would expect from the top two players in the world, but that’s how things can go in a short tournament.

When the two stars were playing apart from one another (about 80 minutes of ice time), the team could not control the flow of play or scoring chances. And when neither player was on the ice (174 minutes, or 53 percent of the team’s total time), the Oilers were absolutely dreadful. Their Corsi For percentage and Expected goals for percentage were below 40 percent. Florida’s middle order and depth players completely dominated the Oilers and they were lucky to break even in goals. Again, Edmonton did not have enough high-quality players and by the end of the series the club looked gassed. While it was important to add experience to the roster, you could tell throughout the series that the team lacked speed and quick decision-making to handle the Panthers forecheck.

Here’s how the Oilers skaters performed at even-strength in the six games against the Panthers. Only a handful of players posted on-ice shot-share numbers above 50 percent – just a dismal showing.

.

Losing Hyman and having Nugent-Hopkins and Ekholm injured played a big role in the Oilers overall performance and results. But there were a lot of self-inflicted problems as well. In goal, Edmonton knew what they had in Stuart Skinner as he has struggled to provide league-average goaltending for a few seasons now. On the back end, Edmonton knew what they had in Nurse and the negative impact he consistently has on his teammates and their on-ice numbers. And up front, Edmonton knew that more than a few depth players were posting negative on-ice shot-share numbers late in the regular season and in the first few rounds.

Begs the question – was the Oilers general manager ignorant to this information or just negligent?  And knowing that players like Nurse and Kane were struggling and making poor decisions and reads all over the ice, why was the coaching staff giving them more minutes at even-strength?

There are some very fundamental roster-construction strategies that the Oilers need to review this off-season. With a lot of inefficient contracts, aging players and major roster deficiencies, the Oilers have plenty of work to do. But they can’t approach it the same way they’ve done in the past. There has to be a focus on getting younger and quicker and being shrewder with contracts – especially for replacement-level players or those who struggle to have a positive impact on the team’s performance. While there’s a reputational risk of behaving this way, the Oilers have to be more focused on finding better players – not just those with personal connections to management or team personnel. The league is only getting more competitive, and the Oilers haven’t exactly loaded up on impactful prospects to keep pace. So, they’ll need a new approach to roster construction starting this off-season.

Data: Natural Stat Trick

How the Oilers and Panthers compare after the first four games of the finals

It’s been a competitive series so far between the Edmonton Oilers and Florida Panthers, and I don’t think it’d be surprising to see this go to seven games. It’s really going to come down to who makes the most blunders, the timing, and who does a better job at capitalizing on them.

Edmonton has a path to securing a championship here if they can stop taking thoughtless penalties and get some saves on the penalty kill. Over the four games, they’ve done a good job adjusting the lineup and combinations at even-strength, handling Florida’s tactics and getting decent production. Based on their performance and results, they have a good shot at getting to sixteen wins this post-season.

Florida has so far outscored Edmonton 18-14, thanks in large part to their powerplay success. Florida has done slightly better at even-strength (5v5), outscoring Edmonton 9-8. But if you factor in 4v4 time, the goals are even at 10 goals each. On the powerplay, it’s not as though the Panthers are generating a ton of high-quality chances. Their rate of shots has improved in the finals compared to earlier in the post-season, but it’s nothing spectacular. Based on expected goals, they should have only four power play goals. But because of the Oilers shaky goaltending shorthanded, Florida has seven (or three more than expected). And the Oilers powerplay is underperforming slightly based on expected goal models. They should have five powerplay goals, but only have four (and they also allowed a short-handed goal). In summary: the Oilers need their special teams to be better.

Here’s a quick snapshot of how the two teams have performed at even-strength (5v5) after four games. Note that the shot-share metrics are score-adjusted.

Florida is doing a better job at controlling the flow of play, as measured by the Corsi For percentage. But when it comes to scoring chances, it’s a lot closer with Florida having an edge. Edmonton’s lower-than-normal shooting percentage has cost them a goal or two. But their goaltending has saved them a few more than expected at even-strength. The Oilers expected goals against is 11, but they’ve only allowed nine. It’s just on the penalty kill where the Oilers goaltending has been poor. More on that in a minute.

.

And here’s how the Oilers skaters have performed in the final series so far, and what their results have been. The skaters are split between forwards and defencemen, sorted by time on ice and have a heat map applied to show they compare with their teammates.

.

One really encouraging sign is that McDavid and Draisaitl’s results are likely due for a market correction – which would be perfect timing. Both currently have a negative goal-differential despite driving play and spending more time in the offensive zone. Along with Perry and Nugent-Hopkins in the top six, they should be able to convert on more of their chances just based on the skill level they have and the results they’ve posted all season. The middle order of the forwards does need tweaking, and I think the coaching staff has something to work with Henrique and Frederic. They along with J. Skinner could be the right mix, as others like Brown, Janmark and Arvidsson have struggled playing against Florida’s middle order and their systems. I’d also strongly consider fading Kane’s minutes as he’s been a bit of a liability with the penalties he takes and the lack of positive input he’s had on the game. Florida seems to have figured the Oilers depth out, so it doesn’t hurt to make adjustments, especially when a lot of the Oilers forwards have experience playing with one another over the course of the regular season.

On the back end, Bouchard continues to shine with whoever he plays with. Walman and Klingberg have also performed well, but Klingberg’s on-ice results are difficult to ignore. I would expect him back in the lineup after a game-off, especially with Stecher not being able gain the coaching staff’s trust in game four. And not much to add about Nurse as he remains a liability and shouldn’t see top pairing minutes. He’s better suited in a depth role at this point as he tends to drag down the numbers of every Oilers player he’s on the ice with.

And here’s how the Panthers skaters have performed over the four games.

.

The Oilers are doing a decent job at limiting the chances generated by the top line players like Reinhart and Verhaege, as well as Barkov whose performance numbers and results have been poor compared to what we’d expect from him. The Panthers second and third lines, which play a lot against Brown and Kane, as well as Nurse, have really taken advantage to control the flow of play and scoring chances. It’s clear that they’re using this middle order to target the Oilers weakest players. On the back-end, the Oilers should continue to target Forsling and Ekblad, as they tend to be on the ice for a lot of chances against. The Panthers are distributing the ice time quite well amongst the defencemen, but I do wonder if this group will wear out first as they take a lot of hits and haven’t rotated in a seventh defenceman yet.

Here’s how the goalies have performed this series, split by even-strength (5v5) and penalty kill and sorted by goals-saved-above-average. Pickard is giving the Oilers decent/average goaltending, which is more than what Skinner can provide at this point. As mentioned above, the Oilers goaltending has been fine at even-strength. It’s really on the penalty kill where they’ve struggled, with Pickard giving the team a better chance at winning games.

We’ll see what the Oilers coaching staff comes back with in game five in terms of lineup decisions and tactics.

Data: Natural Stat Trick

Bearing off

This has to be it, right? The Edmonton Oilers get a second chance to win the Stanley Cup starting on Wednesday night against the Florida Panthers, which should be a very entertaining series. Both clubs have been dominant this post-season, and it felt kind of inevitable that they’d be going at it again. Pip count is near identical, now it comes down to the rolls – and hopefully things swing the Oilers way.

Here’s how the two clubs have done at even-strength this post-season. Both have dominated the scoresheets, each hovering around a near identical 62 percent goal-share. And their success has been supported by strong shot-share numbers – no surprise there.

What stands out here is the fact that the Oilers goaltending has been slightly better at even-strength this post-season, with the Panthers hovering closer to league average levels. Bobrovsky had a solid regular season, ranking 15th among 58 goalies who played at least 1,000 minutes in the regular season with a 91.9 percent save percentage. And a +8.53 goals-saved-above-average. Skinner, meanwhile, ranked 46th in save percentage (90.2 percent) and 48th in GSAA (-8.80). What that tells me is that Bobrovsky put together longer stretches of success in the regular season than Skinner – but it remains to be seen which one can do it first in the finals.

Both teams are also getting good results from across their rosters – scoring goals with and without their star players on the ice. Without one or both of McDavid or Draisaitl at even-strength, so about 50 percent of the team’s total time, the Oilers have posted a goal-share of 67.74 percent (21 goals for, 10 goals against). And on the other side, without one or both of Barkov or Tkachuk, about 46 percent of the team’s total time, the Panthers have also posted an exceptional goal-share of 66.67 percent (20 goals for, 10 against).

Where the Panthers depth players have an edge over Edmonton is their possession numbers, as measured by the Corsi For percentage (i.e., unblocked shot attempts). Edmonton tends to struggle controlling the overall flow of play, especially with Nurse on the ice with the depth players. In those situations (i.e., Nurse without one or both of McDavid or Draisaitl), the results have been good (9 GF/5 GA), but the team’s shot share metrics like Corsi and Expected Goals hover around 45 percent.

Here’s how the Panthers skaters have fared this post-season at even-strength, sorted by ice time, with a basic heat map applied to show how each player compares to their teammates.

While there are some players riding the PDO wave, like the Lundell/Marchand/Luostarinen line (who have been excellent), there are others like Reinhart who have the potential to see their scoring pop at evens. Reinhart’s on-ice shot-share numbers have been excellent, but he has only broken-even in terms of goals. Suspect the Panthers coaching staff will heavily target Darnell Nurse, as well as Henrique, Brown and Janmark. As I wrote recently, the Oilers tend to allow a lot of shots with these players on the ice – a trend that has continued since the regular season.

Should also note that the Panthers powerplay has only been alright. They’ve scored at a rate of 8.47 goals per hour, which is close to what they had in the regular season. They’re struggling to generate shots, sitting at a rate of 38 shots per hour, which is one of the lowest among all teams this post-season, and well below where they were in the regular season. The Panthers penalty kill on the other hand has been excellent. They’ve only allowed seven this post-season (a rate of 3.90 goals against per hour), which is one of the best in the league and half of what they allowed in the regular season. They’ve done an excellent job suppressing shots and making life easier for their goaltender – something the Oilers powerplay will have to figure out right away.

As I said at the top, both clubs have moved into their home boards and are in excellent position to win the game – but it’ll come down to the rolls. A bounce here and there, and hopefully someone getting the hot hand should allow Edmonton to bear off and win their first championship since 1990.

Data: Natural Stat Trick

Racing

Couple notes from the first four games of the western conference finals. Ahead in the race to the finals, the Oilers have a massive opportunity tonight to close things off.

  • The Oilers results have been excellent at even-strength, outscoring the Stars 9-3. Shooting percentage is close to 11 percent and the team save percentage is over 96 percent – both well above normal levels for the league and for the team.
  • The Oilers underlying shot-share numbers at even-strength have been fine. While their adjusted Corsi For percentage is at 49 percent and their Expected Goals for percentage has been 47 percent, it’s largely due to the fact that they’ve been leading for about 69 percent of the total time at even-strength.
  • When the score has been within one goal (about 132 minutes of 192 total), the Oilers have posted a Corsi For percentage of just under 53 percent, and an Expected Goals For percentage of 51 percent.
  • Stuart Skinner has arguably been the best player for Edmonton. After a shaky start, and posting shorthanded numbers similar to his career levels, he’s significantly improved. Question remains if he can maintain this level, or if he fades off – similar to what’s happened in the past when he’s playing too many minutes.
  • Oilers powerplay has been great – five goals in about 20 minutes translates to a scoring rate of 14.42 goals per hour. That’s well above what they finished with in the regular season (8.90 per hour) and higher than the best powerplay (Winnipeg had 11.06 goals per hour). The Oilers rate of shots is slightly higher than where they were in the regular season, so it’s too early to panic about their powerplay falling off.
  • The penalty kill results are much better now that the goalie is making saves. Who knew.

Below is how the Oilers skaters have performed at even-strength against the Stars so far.

Couple more notes:

  • It makes a lot of sense to have Stecher take a break. He’s getting a lot of attention for stabilizing Nurse and being a “gamer”. But he’s been on the ice for a lot of shots against relative to his teammates. Nurse has also struggled, but continues to see a lot of ice time. Not sure if Nurse playing with Kulak, which is expected today with Ekholm returning, makes a lot of sense. Their on-ice shot share numbers have been poor in the regular season and in the playoffs.
  • Losing Hyman is massive. The team tends to perform well with him on the ice, regardless of who’s on the ice with him – a rare driver in the league. Kane is going to get more minutes, but I wouldn’t expect him to last long, especially if he’s playing against better competition.
  • That entire bottom six has not been good this round. While the Oilers have outscored the Stars 3-1 at even-strength without McDavid or Draisaitl, their underlying shot share numbers have been dreadful. The team’s Corsi For percentage without one or both of the glimmer twins is at 40 percent and the Expected Goals percentage is at 37 percent.
  • Adding J. Skinner to the forward group would be recommended. Or perhaps moving Nugent-Hopkins to a third line to see if he can help others. In about 15 minutes away from Draisaitl and McDavid this round, RNH’s on-ice shot share numbers have been over 55 percent – he’s been excellent this series.

Data: Natural Stat Trick

Direct range: Oilers heading into the playoffs in poor form

The Edmonton Oilers are heading into the playoffs in not-so-great shape.

Over the final twenty-five games of the season (so since around late February), the Oilers had a record of 14-10-1, a points percentage of 0.580 that ranked 14th in the league. Their even-strength (5v5) goal-share of 43 percent (43 goals for, 57 goals against) ranked 27th in the league, only ahead of New Jersey, San Jose, Chicago, Nashville, and Minnesota.

Injuries were obviously an issue and played a role in the team’s shooting percentage, which ranked 30th during this period, and save percentage, which ranked 27th. But it’s important to note that even before this final stretch the Oilers weren’t too great in either of those categories as they were below league average pretty much all season. And because of this, the Oilers are heading into the playoffs with one of the worst goal differentials at even-strength (-3) among playoff teams.

The good news is that despite the injuries, the Oilers posted decent shot-share numbers with their Corsi For percentage and Expected Goals for percentage ranking higher up in the league. So, there’s reasons to believe that their goal-share could improve. But it’s important to note that their shot-share numbers were largely star driven, as the team could only post a 48 percent Corsi For percentage and a 46 percent Expected Goals for percentage when McDavid and Draisaitl were not on the ice. So it’s hard to have confidence in the depth players being real drivers at evens. Should note here that that I excluded the games when the glimmer twins were not in the lineup.

The other major issue heading into the playoffs is the Oilers goaltending, which has been inconsistent all season and below league average levels. And it’s where the Kings have a significant edge.

Among the 62 goalies who played at least 1000 minutes this season, or at about 20 games (all situations), Darcy Kuemper ranked fourth overall in terms of save percentage (0.921) and goals-saved above average (GSAA, +26.76), only behind Connor Hellebuyck and Andrei Vasilevskiy. Stuart Skinner on the other hand ranked 39th with a 0.897 save percentage and 42nd with a GSAA of -4.44. Among the true regular goalies (ones who played at least 50 games this year) Skinner ranks near the bottom of the list. And for those wondering, Pickard ranks 24th in terms of save percentage (in the list of 62 goalies) and 26th in GSAA.

Should note that both Los Angeles and Edmonton were very good at limiting shots and chances against at even-strength and the penalty kill this season. One team had goaltending and had a shot at the division title. The other one had Stuart Skinner. It’s a major weak spot for the roster, and a position that Oilers management chose not to address last off-season or at the trade deadline.

Data: Natural Stat Trick

Covering Blots: Digging into whether Darnell Nurse has been good enough for the Oilers this season

Defenceman Darnell Nurse has had a lot of highs and lows throughout his season (and career) with the Edmonton Oilers.

Early in the campaign, he posted some of the team’s worst on-ice shot-share numbers and goal-differentials. But by early December we saw his performance and results turn around after the coaching staff played him more often with Leon Draisaitl, who has had an MVP-level season. As the year progressed, Nurse made some great plays and contributed on the score sheet. But that would again be followed up with blunders in his own zone, leading to opponents sustaining pressure and generating scoring chances. His game has recently improved, which is great considering the playoffs are coming up. But it remains to be seen if he can continue playing at this level.

This all led me to a pretty straightforward question: is Darnell Nurse having a good season?

To determine if he meets the threshold of “good”, I produced some basic criteria for a defenceman that is being paid $9 million per year:

  • Must be playing regular minutes against the other team’s top competition at even-strength (5v5), and top minutes on the penalty kill.
  • Must have a positive impact on the team’s shot and scoring chance differentials at even-strength (5v5).
  • Must have a positive impact when playing with the team’s depth players, as in when McDavid and Draisaitl are on the bench.

There could be other criteria, but what I have above are things that correlate to scoring goals and winning games. It’s basically the bare minimum.

Ice-time and Usage

Nurse is currently averaging just under 23 minutes a game this season (in all situations), which ranks third among Oilers defencemen. And he ranks first in the average number of even-strength minutes (19 minutes a game). What’s interesting is that 25 percent of his even-strength minutes this season are against elite competition, according to the methodology used by Puck IQ. This is a drop from last season when Nurse played 30 percent of his minutes against top competition.

The table below shows a steady decline in Nurse’s proportion of ice time against elite-level competition (orange bars) throughout his career, as he was over 40 percent just three seasons ago. The 25 percent proportion he has this season would be one of the lowest in his career, indicating that the coaching staff is well aware of his deficiencies, and are actively trying to put him in a position to succeed.

.

Another thing worth considering is the steady decline in Nurse’s minutes on the penalty kill. Nurse is averaging below two minutes a game this season, which is a significant drop off from the last four seasons when he was regularly on the top penalty-kill unit. The graph below shows his average ice time per season over the course of his career, and is a good indicator of the trust the coaching staff has in the player.

.

Nurse’s Impact at 5v5

Below are Nurse’s relative-to-team shot-differential numbers by season. I tend to use Corsi, a proxy for puck possession, and Fenwick and Expected goals as a proxy for scoring chances.

.

This is going to be the third straight season where the Edmonton Oilers have seen their shot and scoring chances numbers take a hit when Nurse has been on the ice.

Yes, he does play a lot of minutes and sees top competition. But as we saw above, those hard minutes are being reduced. He’s clearly not a player that can be relied on to drive play, and he’ll need to be with a strong defensive partner and high-end forwards as much as possible for him to provide value to the team at even-strength. Which leads to the next criteria.

Impact when playing with depth players

When the Oilers have Nurse on the ice with the depth players, so no McDavid or Draisaitl on the ice, the Oilers have posted some pretty poor performance numbers and results. Their Corsi For percentage and Expected Goals For percentage both drop down to 46 percent when the depth players are playing with Nurse, which, as mentioned above, is why the coaching staff was okay with getting Nurse away from them earlier in the season.

The good news is that the results have been good, with a goal differential of plus-four (goal share of 55 percent), but that’s been largely luck-driven. The team tends to play less often with the puck when Nurse is out there with depth players, so it’s hard to have confidence in these results over the long run.

Final Thoughts

While we sometimes see some great plays from Nurse and his name on the scoresheet, it’s hard to ignore his usage, performance and results over the course of the full season. Expectations are rightfully high for the player, and unfortunately, he’s not meeting some basic criteria that correlates with winning games. The hope is that he can play well into the playoffs, but it’s hard to have confidence when we look at the data over a full season.

Based on his salary and role on the team, you would expect Darnell Nurse to be one of the best defencemen in the league, though you could make the argument that he might not even be the third-best defenceman on the Oilers. That’s a problem for management to address this off-season.

Data: Natural Stat TrickPuckIQ

Also posted at Oilersnation.

The Oilers have gone from red hot to a hot mess

The Edmonton Oilers have been very poor since the 4 Nations Face-Off. In 10 games since the break, they have three wins and seven losses, having been outscored 27-40 in all situations.

Even-strength (5v5) has especially been awful as the club went from a +14 goal differential heading into the break to now sitting at even. Put another way, it took them 55 games to have a goal-share of 53 percent, which was eighth best in the league. And all of that progress, especially what they did in January, has been wiped out in the last ten games. They now rank 18th in the league with a goal share of 50 percent. Not exactly looking like a playoff threat. A graph showing the Oilers cumulative goal differential this season at even-strength is below.

.

The drop-off in results has been driven by their inability to control the flow and their spending less and less time with the puck. Prior to the break, the Oilers had some of the best shot-share numbers in the league, hovering around the 55 percent mark when it came to Corsi percentage (which is a proxy for puck possession) and Expected Goals (which is a proxy for scoring chances). But since the break, these numbers have fallen to league average levels, with their Expected Goals percentage even dropping below 50 percent.

For context, below is the Oilers underlying shot-share metrics in rolling 10-game segments. I’ve added a marker at the 55 game mark, which is the first game after the Four Nations Faceoff tournament. The other low point came around the game 34 mark, which was in late December when the team was struggling. In January, the team turned things around and started playing closer to what was expected. But things appear to have fallen off again. The recent numbers are well below where they were prior to the break and an indication that the tactics and process the coaching staff has in place for even-strength play isn’t working. The results are suffering because of it, and it has to be addressed as soon as possible.

.

There are two issues to consider when trying to understand why these numbers are falling off.

The first is that the team’s goaltending has been a weak spot for the team for a long time now, and hasn’t at any point this season been at or above league average levels. Because of this weakness in net, the team seems to be playing a little too safe now and not pushing for offence as frequently. Instead of taking chances and really leveraging the offensive talent they have up front, there are a few too many conservative plays happening, especially in this recent stretch of games.

The switch to playing more conservatively at even-strength is reflected in the team’s declining rate of generating shot attempts. Before the tournament break, the Oilers were generating 62.6 shot attempts per hour — one of the highest in the league. In the last ten games, that rate has dropped by 8.8 percent to 57.04 shot attempts per hour — which is slightly below league average.  Worth mentioning that the team’s rate of shot attempts against has remained steady all season.

.

And as I wrote about a month ago, the team has also been getting a lot more shots from their defencemen, which isn’t ideal considering the probability of scoring drops off the further you’re away from the net. There appears to be more hesitancy to make plays and take some risks to get the puck moving into high danger scoring areas. Instead, the team is taking shot attempts from distance, and hoping the best for rebounds. This is a weird tactical issue that various coaching staffs have tried in Edmonton, and it just doesn’t work well.

Considering the team’s championship aspirations, and the importance of home-ice, it’s critical that the Oilers coaching staff recognize the issues and make the necessary adjustments. The chase for a division title is slowly slipping away, but there is still time to make some ground.

Data: Natural Stat Trick

Also posted at Oilersnation.

Blot placement

With the NHL regular season to re-start this weekend and with the trade deadline coming up, I wanted to take a quick look at the Oilers roster to see where the weaknesses are and what should be addressed by the management group. The reality of operating in a cap system is that you have to pick and choose where you want your strengths and weaknesses to be, and managers have to try to mitigate their risks as much as possible.

My approach is to take a look at each individual player’s actual results (their on-ice goal-share) as well as their underlying number such as their on-ice shot differentials and expected goals differentials. Combining this with their on-ice shooting and save percentage, you can start to gauge whose results are sustainable or not. And which players are more likely to have success.

Below are two tables showing the players on-ice numbers at even-strength (5v5) so far this season, with a basic heat map applied to show each player compares with their cohort. Tables are sorted by each player’s total ice time.

.

Thanks to Draisaitl and McDavid, the Oilers continue to have one of the best top-six forward groups in the league. The issue remains with the bottom six group. While they play an important role on the penalty kill, they tend to spend a lot of time without the puck and get out-chanced regularly at even-strength. What really stands out is how poorly McDavid’s on-ice goal differential has been. Despite posting some excellent on-ice shot differentials, he’s sitting at only +5  – and it’s largely driven by his on-ice save percentage. The Oilers team save percentage currently ranks 19th in the league.

On the defensive side, there’s definitely room for improvement, especially with the group’s depth. Not sure how confident I’d be if guys like Emberson, Stecher or Klingberg have to play more minutes as they haven’t done so well in their minutes.

I’d also be concerned about Nurse and ensuring that he has a partner who can make up for his deficiencies. Nurse is a player who needs to on the ice with top end players as his on-ice numbers often take a hit when he’s not with one of the glimmer twins. Interesting to note that when McDavid has been with Nurse on the ice (and away from Draisaitl), his goal differential is -4 at even-strength (4 goals for, 8 goals against). And that’s partially driven by the fact that the Oilers tend to get outshot and outchanced with Nurse on the ice. Even McDavid isn’t immune from Nurse’s impact.

Data: Natural Stat Trick

Tracking the Western conference – As of January 31, 2025

Below are the even-strength (5v5) numbers for each team in the western conference (sorted by points percentage), including goal-share results as well as the shot-share metrics that give us a sense of which teams have the right processes in place and if the results are sustainable or not. At the end of the table are each team’s shooting percentage and save percentage. I’ve also applied a basic heat map to each metric to show which teams are doing well or struggling relative to their conference foes (i.e., green is good, red is bad). You can also find a description of each metric at the end of this article. Please note that the shot-share metrics are score and venue adjusted based on Natural Stat Trick’s methodology.

.

And here’s how things are looking in the eastern conference.

Data: Natural Stat Trick