Pretty lame re-start to the season, with the Oilers losing two of their first three games since the Olympic break. This recent one against the Sharks was especially bad with the Oilers chasing the game quite a bit, posting a 41% Corsi For percentage in a 5-4 game. And please throw dirt on any end-of-road-trip excuses – contenders contend.
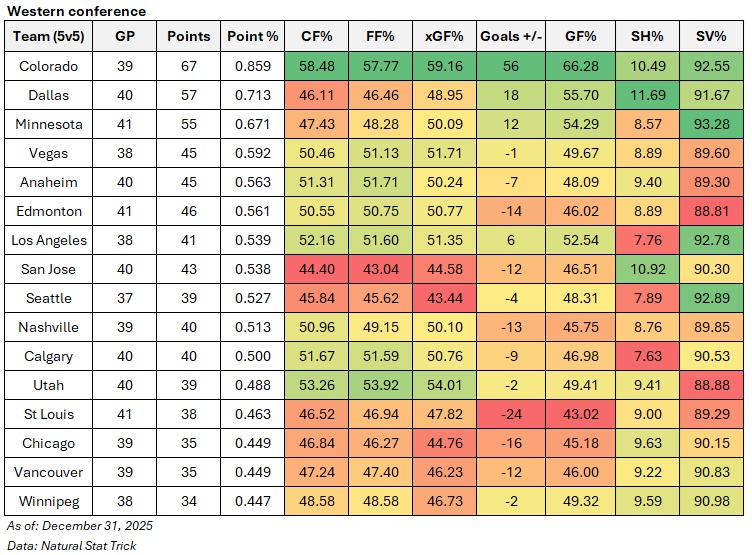
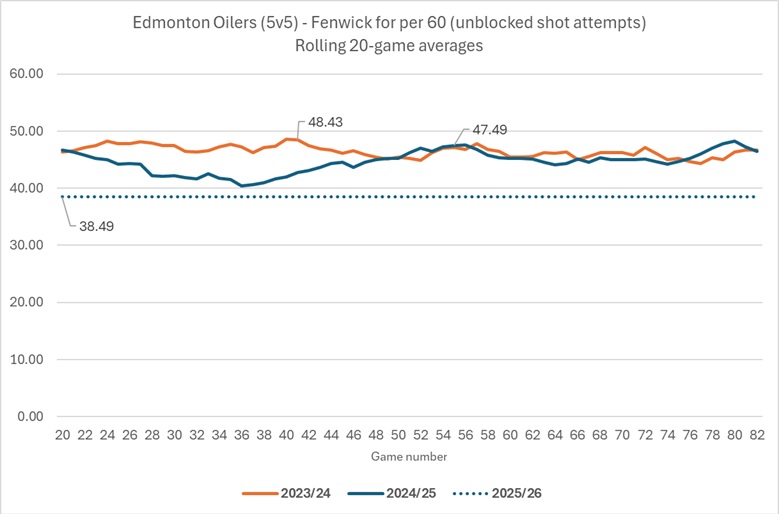
The Oilers are now rocking a -12 goal differential at equal strength (5v5), a 47 percent goal-share that ranks 20th in the NHL. And their underlying numbers continue to slide. In their last ten games now, the Oilers have barely broken even with shot attempts and unblocked shot attempts – and their expected goal-share is 48 percent.
There’s clearly some tactical and execution issues happening here, and a major spot of bother for the coaching staff. Adding Coffey reeks a little of desperation (and the owner wanting some straight answers about the current state), and it feels like a matter of time until more serious changes are made behind the bench.
There’s also the recurring personnel issues that haven’t been resolved all season.
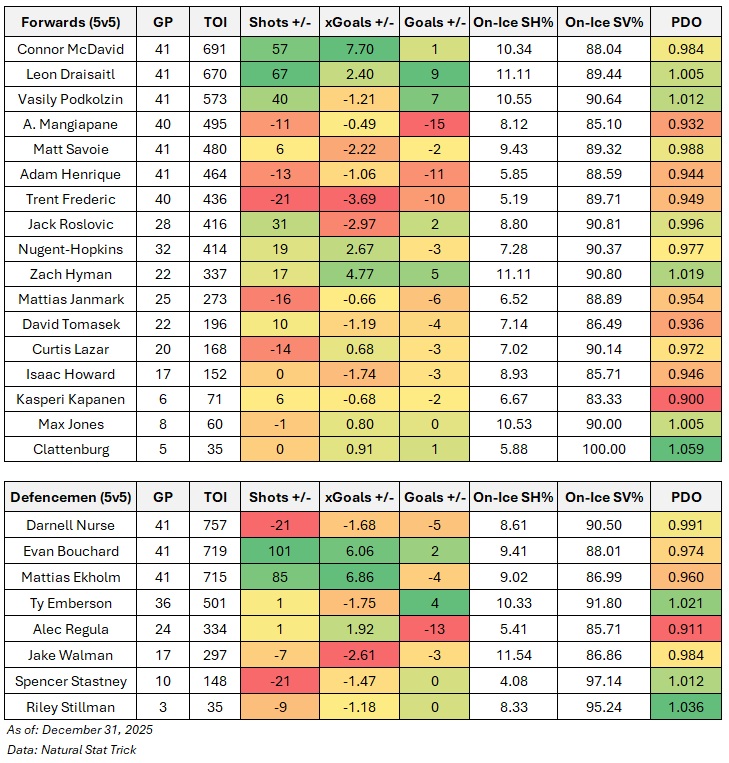
- The Oilers continue to get their teeth kicked without McDavid or Draisaitl deployed, consistently getting out-played, out-chanced and out-scored. All their on-ice shot-share metrics hover around 45 percent, while their actual goal-differential is at an abysmal -25 (!).
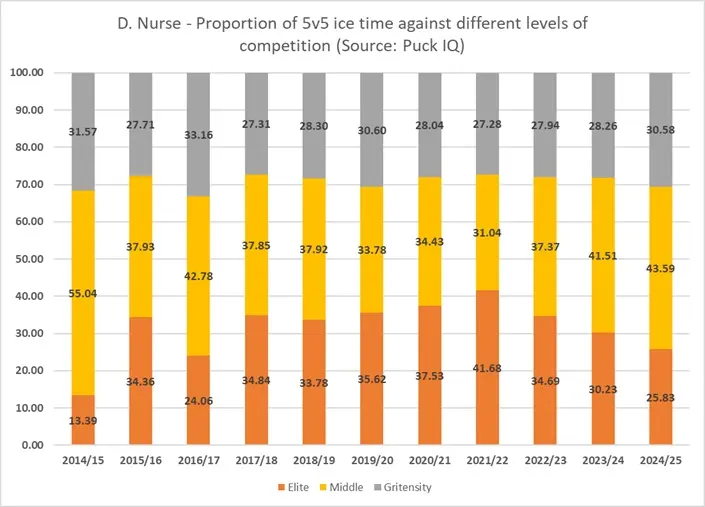
- Darnell Nurse continues to be a drag on the team’s performance and results, but continues to get plenty of playing time.
- The goaltending at even-strength currently ranks dead last in the league, with a team save percentage of 88.65 percent. Jarry has not been the answer for Edmonton (was never going to be), so hopefully Ingram can get his game together and play at a level we’ve seen him at before.
So while the coaching staff needs some tweaks, I do wonder how the Oilers front office is going to navigate the upcoming trade deadline. They clearly have to be in win-now mode, especially with McDavid and Draisaitl in their primes and with the Pacific being so weak. But there has to be a way to start addressing next season as well, and build a stronger contender than this one.
Discarding some of the older players is an obvious step. Mangiapane is pretty much done, but it’d be worth exploring what the market rate is for guys like Janmark or Lazar. They’re not difficult to replace, and the team does have some decent players in the AHL who could get a look and make a bigger impact.
There also has to be a clear directive to the coaching staff to let guys like Savoie take on bigger minutes down the stretch. It’s imperative to see what the team has in this player and to know which role(s) he’ll take on in 2026-27. Moving him out of the top six as quickly as the coaching staff has done isn’t helping.
If there’s a deadline acquisition, it has to be someone who can slide into that second pairing with Walman to stabilize things and to not be a drag on the team’s forward’s performance – from first line to fourth line. A medium-term plan to replace Nurse has to be in motion at this point. The issues with Nurse have gone on for way too long. And while I appreciate his draft pedigree and his leadership role on the team – it’s not translating to actual on-ice results.
Data: Natural Stat Trick