Looking into Patrick O’Sullivan’s 2009/10 Season

I came across an interesting article from Sportsnet last week regarding the plus/minus stat and really how useless it is. In my mind, it’s fine as a counting stat, but when people rely on it to make comparisons between two players and evaluate individual performances with it, it’s painful to watch.

Featured in the article was former Oiler Patrick O’Sullivan who had a brief stint with the club, arriving at the end of the 2008/09 season, and departing  the summer after the 2009/10 season. If you recall, the 2009/10 season was an absolute tank job by the Oilers, as they purposely dressed a weak roster, and failed to make any changes to improve their performance. O’Sullivan finished the season with 7 goals, and 14 assists at even-strength that season, good for 6th on the roster in total points. He played the fifth most minutes among forwards (which includes total ice time and ice time per game). His 1.38 points per 60 at evens ranked 9th among his peers, which was a drop from  his previous two seasons in Los Angeles. In 2007/08, he notched 33 points (1.87 points per 60, 4th among regular forwards) and in 2008/09, he notched 29 points (1.61 points per 60, 3rd among regular forwards). O’Sullivan finished the 2009/10 season with a -35, the worst in the league, and is something that the player was obviously impacted by.

He’s able to laugh about it now, but he still believes the distinction hurt his standing in the league.

“It was one of the things that really hurt me for the rest of my career,” O’Sullivan says. – Sportsnet Magazine

We know that plus/minus is a  terrible stat, but I wanted to see what some of the more modern metrics (i.e., possession, goal share, etc) can tell us about O’Sullivan’s 2009/10 season. What I’ve done below is show O’Sullivan’s relative-to-team stats when it comes to possession (Corsi For), shots on goal, expected goals (a measure of shot quality) and goals, season by season (Source: Corsica Hockey). I’ve also included O’Sullivan’s point totals in Appendix A.

POSULLIVAN - Rel

Here we see that O’Sullivan had a couple of good seasons prior to joining Edmonton, and across the board, his team typically did better when he was on the ice than when he was on the bench. When he got to Edmonton, things went south fast. In 2008/09, O’Sullivan dressed in the final 19 games of the season in Edmonton, but in that time we saw a decline in his performance. The Oilers’ share of goals (in green) when O’Sullivan hit the ice was terrible relative to his teammates, and was actually one of the worst in the league.

A simple way to find out why this was happening is by looking at the individual player’s PDO, which sums up the on-ice save percentage with the on-ice shooting percentage, and measures the luck. In O’Sulivan’s two seasons in LA, his PDO was just slightly below 100, meaning that he wasn’t riding any sort of high on-ice save or shooting percentages. In Edmonton, his PDO was 96.13, one of the lowest in the league. This was caused by a slightly lower than team and league average shooting percentage (6.44%) and a significantly lower than average on-ice save percentage (89.68%).

The Oilers goaltending ranked fifth worst in the league when it came to save percentage at even-strength in 2009/10, with 90.93. And this save percentage dropped even further below from the league average when O’Sullivan was on the ice, which might explain that low proportion of goals. What’s interesting is that O’Sullivan was doing okay when it came to shot quality (i.e., scoring chances, rebounds, rush shots and shot distance), but the team’s goaltending couldn’t stop the scoring chances against on a regular basis.

What’s also worth noting are the linemates O’Sullivan spent the most time with in Edmonton that season. Below are the linemates he played at least 50 minutes with at even-strength, along with the breakdown of the different metrics, including PDO.

Horcoff & Jacques Penner & Gagner Potulny & Brule Potulny & Nilsson
TOI 91.80 60.02 55.29 53.47
CF% 41.50 41.23 43.43 51.59
Rel.CF% -7.23 -5.36 -5.22 4.00
SF% 42.86 41.07 44.83 50.00
Rel.SF% -6.27 -6.00 -5.69 1.25
xGF% 35.55 40.78 38.48 49.70
Rel.xGF% -13.79 -8.84 -9.51 3.22
GF% 20.00 57.14 20.00 25.00
Rel.GF% -34.72 9.42 -16.00 -19.12
PDO 86.67 108.30 91.35 93.55
Sh% 6.67 17.39 3.85 3.23
Sv% 80.00 90.91 87.50 90.32

Being paired with Horcoff meant O’Sullivan would play a more shut-down role, which he never did in LA and it showed. Along with a fringe player like Jacques, the trio mustered a 41.50% Corsi For%, well below the league average and far from their team average. What’s staggering is the on-ice save percentage when that trio was together, which fell from being bad to being garbage at 80.00%. And playing alongside Ryan Potulny, who only played a handful of games at the NHL level after contributing to the tank job, didn’t help much either. O’Sullivan saw the on-ice shooting percentage fall significantly when paired with Potulny, which makes sense considering his lack of NHL ability.

Thoughts

O’Sullivan should definitely be pissed about the -35 rating in 2009/10, and can probably thank the Oilers for orchestrating their epic tank job that season. But when we look past the dated stat of plus/minus, we see that O’Sullivan’s low share of goals and shots that season was thanks in large part to two things: garbage goaltending and terrible linemates. This isn’t to say that O’Sullivan should be off the hook here; he should still take some of the blame for his lines poor performance. But the fact is, he had the ability to contribute at the NHL level when he was acquired and was quickly put in a position to fail by management.

Appendix A: Patrick O’Sullivan’s point totals

Season Team Games G A PTS +/- PIM TOI/GM
2006-07 LAK 44 5 14 19 -6 14 14:04
2007-08 LAK 82 22 31 53 -8 36 18:42
2008-09 LAK 62 14 23 37 1 16 19:26
2008-09 EDM 19 2 4 6 -7 12 18:14
2009-10 EDM 73 11 23 34 -35 32 17:31
2010-11 CAR 10 1 0 1 -1 2 8:52
2010-11 MIN 21 1 6 7 -1 2 13:46
2011-12 PHX 23 2 2 4 -4 2 11:03
Career 334 58 103 161 -61 116 16:49

Source: Hockey Reference

.

Adding Center Depth This Summer

Heading into the summer, the Oilers appear to be set at center ice, with Connor McDavid, Leon Draisaitl and Ryan Nugent-Hopkins as the pivots. It’s been a long time since the club has had some semblance of depth at center, so it’d be unwise to tinker with it too much in the off season. The other factor to consider is Draisaitl possibly playing both center and wing, depending on the in-game situation, similar to how Todd McLellan deployed Joe Pavelski in San Jose. If Draisaitl is in fact used as a bit of a utility player, it’s imperative that the Oilers bolster the bottom six and acquire a centerman (or two) that can perform well and produce.

Both Anton Lander and Mark Letestu struggled mightily last year at even-strength, combining for a whopping four primary assists. I expect Letestu to be back as he did perform well on the powerplay, but Lander’s future is a little more murky, considering he was often scratched to make way for Hendricks, and at one point Pakarinen, to play the fouth line center role. All things considered, it’s hard to ignore the glaring weakness that was the bottom six last season.

Looking at the options for next season, the Oilers could potentially bring back Letestu as the fourth line center behind McDavid, RNH and Draisaitl. What I would highly recommend the Oilers do though is bring in additional centermen, preferably a right shot, on the cheap, have them play wing and fill in at center when needed. This might be overkill, but consider the fact that the Ducks and Penguins both dipped into the bargain bin last summer to have depth at center: Anaheim brought in Shawn Horcoff and Mike Santorelli, while Pittsburgh brought in Eric Fehr and Matt Cullen.

One player that’s worth looking into is 27 year old Riley Nash, who was not qualified by the Carolina Hurricanes and appears to be headed to free agency. Nash was selected by the Oilers in 2007, 22nd overall, and completed three years at Cornell before being traded to the Hurricanes for a second round pick. There appeared to have been some issues between the player and the Oilers at the time, with Nash likely headed to free agency after his college career.

Full article is at The Copper & Blue.

The Oilers Improvement in Possession Numbers and Expected Goals

The Oilers may have finished the 2015/16 season near the bottom of the league, but looking a little deeper into the stats we see that the club improved in a few areas that are critical for winning games. First, they improved their overall share of goals at even-strength, going from 40.46% last season, up to 45.38%. That’s a significant jump, and was the third biggest change from the season prior across all 30 teams, behind Arizona and Florida. Goal share is obviously important, but we know that there is a lot of luck involved in scoring goals, with some teams riding higher than average shooting or save percentages to pad their goal-share stats.

Knowing that, it’s important to look into a team’s share of total shot attempts (i.e. Corsi For%) which serves as a good proxy for possession,  as well as expected goals, which measures shot quality and scoring chances as determined by Corisca Hockey. When it came to possession, the Oilers finished with 48.71% of all shot attempts (adjusted for score, zone and venue), good for 20th in the league, and up from 46.98% last season (26th overall). When it came to their share of expected goals, the Oilers made a significant jump from last season, going from a 43.32% share (28th league wide), up to 49.24% (20th overall). Below is a graph of the Oilers share of shot attempts (i.e., Corsi For%) over the past nine seasons, as well as their share of expected goals (xGF%).

CF and xGF Analysis

Full article is at The Copper & Blue.

Sekera and Fayne

Since last summer, the Oilers have struggled to carve out a solid defence core that contained a balance of skill, size and experience. And heading into the draft and free agency, it’s become apparent to everyone that the OIlers will likely be making a move or two to enhance the blue line and hopefully push for a playoff spot this upcoming season.

One thing that has become lost in the discussion is the effectiveness of the Sekera-Fayne pairing this past season and why maintaining that tandem is critical for the Oilers. Sekera and Fayne played over 600 minutes together in 2015/16, the most among all pairings in Edmonton, and averaged over 23% of the team’s total ice time at even-strength when together, often leading the team on a nightly basis. Whatever your position is on these two players, they were the number one pairing for the OIlers last season and actually fared well when it came to possession metrics as well as expected goals (which factors in shot location and quality as defined by Corsica Hockey).

Below, I’ve listed every Oilers defence pairing that played at least 100 minutes together last season at even-strength, ranked the list by Corsi For% (adjusted) and included the expected goals measures as well.

Full article is at The Copper & Blue.

Shot attempts from the Oilers defencemen

20141209_davidsonPrior to the 2015/16 season starting, I spent some time re-watching San Jose games to get a sense of their style of play and their overall tactics with McLellan behind the bench. We knew historically the Sharks had been a very good team, one that was properly constructed with depth and balance across the roster, and had the ability to outshoot and outscore opponents on a fairly regular basis. But I was curious to see how certain types of players, mainly the ones on defence, were being utilized and what we could expect for the Oilers under a new coaching staff.

What stood out to me from re-watching these games was how often the Sharks would shoot the puck, and how quickly they would get a shot on goal soon after entering the zone. It was obvious that they would crash the net fairly quickly, getting opposing defencemen on their heels, and rely on their skilled forwards to create second and third chances from rebounds.

Defencemen were typically dumping in the puck, and could rely on their forwards to retrieve it. And if they crossed the blue line,  defencemen were very good at getting shots on goal, leading to second chances. To confirm what I was seeing, I looked into what proportion of the Sharks total shot attempts came from defencemen, and how they measured up to the rest of the league.

iCF analysis - EDM vs SJ.jpg

Here we see that under McLellan (2008/09 – 2014/15), the team saw the shot attempts from the defence core gradually increase to about 35-40% of the team total at even-strength. The Oilers on the other hand, were typically below league average (~30%) when it came to shot attempts from the blueline and saw a bump in their proportion in 2014/15 under Eakins and Nelson (Source: Corsica Hockey).


Now with McLellan behind the bench this past season, the Oilers defencemen generated about 35% of the team’s total shot attempts, well above the league average, and closer in line with what the Sharks have done in the past. If we break the proportion of shot attempts into rolling 25-game averages over the course of the 2015/16 season, the Oilers actually did get up to 40% at one point, which just happens to be around the time that the Oilers had a Corsi For percentage above 50% [Copper & Blue]. And when the defencemen started generating fewer shots closer to the end of the season, well that’s also when the team’s overall possession numbers went into the tank.

iCF analysis - Rolling Prop of iCF from D.jpg

iCF analysis - Rolling CF%.jpg

I can’t say for certain that there’s a direct correlation between the proportion of shot attempts from defencemen and the teams overall possession numbers. But it does appear that McLellan shifted away from his strategy of getting shots from defencemen and letting forwards crash the net for rebounds. Early on in the season, the coaching staff did emphasize volume shooting and the importance of getting shots from the blueline, but for whatever reason, McLellan appears to have relied on his defencemen less for shot attempts and relied more on his forwards to funnel shots towards the goal. My thought is that McLellan’s original strategy did a better job of sustaining pressure in the offensive zone, which would lead to better possession numbers (similar to the 25 game stretch this season).

Another thing to keep in mind is that the Oilers lost Brandon Davidson right around the 67 game mark, which is also when the Oilers started to crater when it came to possession numbers. As a depth defenceman, Davidson was quite effective at generating shot attempts, ranking near the top when it came to individual shot attempts per 60 this season.

Player Games iCF/60
ADAM CLENDENING 20 11.8
DARNELL NURSE 69 11.7
BRANDON DAVIDSON 51 10.9
ANDREJ SEKERA 81 10.7
ERIC GRYBA 53 10.6
OSCAR KLEFBOM 30 10.1
MARK FAYNE 69 7.8
JORDAN OESTERLE 17 7.5
JUSTIN SCHULTZ 45 7.5
GRIFFIN REINHART 29 7.4

Not suggesting here that losing Davidson is the reason why the team’s possession numbers took a hit. But it appears that after losing him, McLellan looked to his forwards to generate original shot attempts, moving away form his shot-from-the-blue strategy.

Take aways:

  • McLellan has historically had his defencemen generating a higher proportion of the teams total shot attempts compared to other teams. This forced the forwards to crash the net looking for rebounds and creating additional chances.
  • This past season, the Oilers did see a higher proportion of shot attempts from defencemen, but after the 67 game mark, the club saw fewer shot attempts coming from the blueline. The Oilers possession numbers also took a nosedive around this time.
  • Davidson’s absence may have been a factor in the fewer shots from the blueline, as he ranked higher among Oilers defencemen when it came to individual shot attempts/60.


Thoughts on the Oilers: Draft, Maroon, Identity


1297814459481_ORIGINALIt’s that time of year when really anything is possible, so speculation is rampant about how the Oilers could acquire and who should be dealt. With the draft coming up, there’s a ton of information on prospects with (at times) excessive discussion on which player might get drafted where. For the Oilers, my hope is that they trade the fourth overall pick as part of a package to acquire help on defence. I suspect that it won’t be a direct transaction and that the Oilers acquire a top six forward, and then move out one the current players to land that much needed defenceman. Having said that, if the Oilers keep the pick, they have to take the best player available (regardless of position) and let them stew at the right level until they’re ready to make the jump.

Couple other thoughts:

  • Definitely a fan of Patrick Maroon and the contract, but I’m reluctant to slot him in as a top six player next season. I see him as more of a complementary forward who would rotate around the lineup depending on match-ups and competition. McLellan builds his lines with an established pair, and I see McDavid having either Eberle or Pouliot as his most common linemate next season.
  • Should add that in his 16 games as an Oilers, Maroon played often with McDavid and Eberle, and notched 14 points (8 goals, 6 assists). Possession-wise, the trio had a Corsi For% of 48% (adjsuted), and a PDO of 107 (Source: Corsica Hockey). I think it’s safe to say that this type of productivity is unsustainable, and that the Oilers should hold off on any sort of contract extension with Maroon until they have a little more data/information to work with. And if it’s Maroon a team wants for a defenceman to save some cap space, the Oilers have to consider it.
  • With Hamonic off the market, it’s a good time to review the work done by Darcy McLeod where he reviewed a large group of right shot defencemen [Woodblog]. I like the fact that the Oilers don’t get an easy way out of this mess, so we’ll see what an experienced GM like Chiarelli can do in this situation.
  • This tweet is just bang-on during this playoff season, eh?

  • We know the Oilers are a long ways away from being a playoff team, but they’re even further away from having that 5-7 year window that the best teams are able to create. The playoffs are such a crap shoot sometimes that the best thing you can do is build a roster that can make the playoffs and have a chance at winning a series. That to me is sometimes a bigger feat than winning the cup.
  • When there are discussions about which team the Oilers should copy in terms of roster construction and on-ice play, I cringe at the thought of the Bruins being the perfect template. In my opinion, the only thing the Bruins did was make their identity explicit by signing/acquiring specific players and have observers build their narratives around that. It’s the off-season, so I understand why we have to hear about the Bruins. They did have an okay window and did win the cup. But I much rather prefer hearing about the Sharks style of play and roster construction (which we hear more about in-season as McLellan is behind a mic more often). Obviously the Oilers don’t have some of the specific players (Thornton, Marleau, etc), but I think the Sharks style of play is something more teams should try to emulate.

Shawn Horcoff’s 2015/16 Season

Shawn-Horcoff--Anaheim-Ducks-jpg
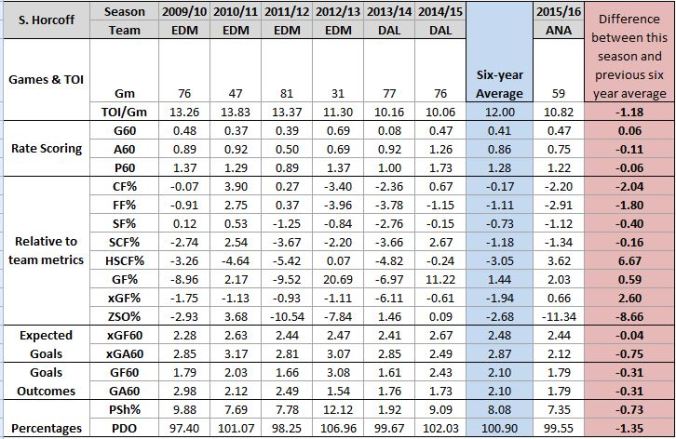
Last summer , I put together a case for the Oilers to bring back Shawn Horcoff as a way to solidify their depth and give support to the young forwards.  Obviously a long shot that he’d actually come back to Edmonton as a free agent. But he was worth a look as he put together two decent seasons in Dallas as a depth winger, and would’ve been a cheap signing.

Articles are here:

Bringing Back Horcoff
Bringing Back Horcoff (Part 2)
Brincing Back Horcoff (Part 3)

I was happy to see that Horcoff signed with the Ducks as it gave him a great chance to win the cup and cap off a great career. I didn’t expect him to play a whole lot to be honest, as I figured he would be a fill-in for Nate Thompson while he was recovering from surgery. But when I checked in in December, not only was Horcoff still playing at center even with Thompson back, but his ice-time had gradually increased from the start of the season.

Horcoff actually finished the season well scoring 13 even-strength points in 59 games (Source: War on Ice), good for 9th on team among forwards (over 250 minutes of ice time). And his 1.22 points/60 wasn’t too far off from his six year average of 1.28. Looking at his Relative to Team metrics, we see below that while the team did slightly better possession wise without Horcoff on the ice, the Ducks actually generated more high-danger scoring chances when Horcoff was on the ice (+3.62), ranking him 2nd on the team behind Ryan Getzlaf. This appears to have translated into more goals, as the team got a higher share of total goals at even-strength when Horcoff was out there (+2.03), ranking him 6th on the team this season. Worth noting that luck (i.e., PDO) does not appear to have been a factor as the team wasn’t getting a higher-than-normal shooting percentage (only 6.33%) with Horcoff on the ice, and his personal shooting percentage was lower than his six-year average.  I’ve also included expected goals, which captures shot quality and factors in the type and location of the shot (Source: Corsica Hockey).


Horcoff Profile 2

The key takeaway from this table is that comparing this season’s numbers with his six year average, things aren’t too far off and in some areas, he was better than his average. Considering Horcoff is turning 38 this fall, I figured we’d start to see a decline in productivity but that hasdn’t been the case this past season.

Unfortunately for him, the 20-game suspension for taking a banned substance is what will likely define his season. It’s also hard to overlook the fact that Horcoff is 38 soon and has been dealing with injuries and may even consider retiring. But seeing what he could do as a depth player this past season, I think more than a few teams could take a chance on him and sign him to a very reasonable contract. Horcoff is well past his prime now, but the fact that he can post numbers that are near his career averages indicates, to me at least, that he may just have something left in the tank.

Talking Draft Lottery Results and Summer Options on The Lowdown with Lowetide

Joined Lowetide this morning on TSN 1260 to talk about the draft lottery and what the Oilers should do with that 4th overall pick.

Couple things:

  • I’m awful with draft/prospect stuff. I don’t watch a lot of junior hockey, so I rely heavily on what guys like Bob McKenzie and others have to say as well as the data.
  • If I’m Chiarelli, I shop that pick and try to package it with players to acquire help on defence. My second option is to turn that pick into two, or three, picks in the first two rounds. The prospect pool needs a boost, so I’d try to spread the risk of that one pick across two more picks.
  • If all else fails, you take the best player available regardless of position. Honestly, my first take on the 4th pick was “okay good, the Oilers can draft for need now and take one of those defencemen”. But on second thought, the draft is the only time a team can take any player they want for free, no strings attached. You have to take the best player available at this point and rely on your scouts to uncover a prospect in the second and third rounds. If you’re drafting-for-need with the 4th pick, that shows a lack of confidence in your scouting staff.
  • And just a heads up that my colleague over at Copper & Blue, Scott Reynolds, will be posting his analysis of this draft class as he’s done in the past. Really looking forward to that.
  • In case you missed it, I joined the AIH 20416 podcast on Saturday night. Had a great chat with some Jets fans. Happy that they get to pick 2nd.