Twenty games into the season, it’s fairly obvious that Connor McDavid will be the Oilers prime driver for offence. Using his speed and skill to make quick plays in all three zones, McDavid can generate shots and scoring chances pretty much on his own. What the Oilers appear to be lacking now is consistent secondary offence, and at least one other offensive driver that can do some damage when McDavid is on the bench.
Last season, this role was held by Taylor Hall, who went on to score 65 points , and consistently enhanced the play of his linemates, including Leon Draisaitl. When Hall was on the ice at 5v5, the team got 51% of all of the goals the Oilers and the opponents scored. The vast majority of his teammates last season were below 50%. Losing a driver like Hall meant the Oilers were going to need to acquire help or hope that one of the young forwards like Draisaitl or Puljujarvi would develop into the role.
On the first day of free agency, the Oilers signed forward Milan Lucic, who does have good underlying numbers, and has a history of contributing to his team’s offence. Last season in Los Angeles, the team had a 61% share of the total goals scored at 5v5 when he was on the ice. In Boston the year prior, the team had a 57% share. He doesn’t have the speed and playmaking ability of Hall, and benefited from having some elite level linemates in the past. But nonetheless, his previous teams scored at a good rate when he was on the ice.
Unfortunately, what Lucic has produced for the Oilers isn’t close to what he’s done in the past. After 20 games, Lucic has two goals and two assists at 5v5, 0.83 points per hour that ranks him last among the 13 forwards who have played at least 100 minutes this season for the Oilers. The team’s share of the total goals at 5v5 when he’s on the ice is below 50%, which is troubling considering he has played a lot with McDavid and Eberle on the top line.
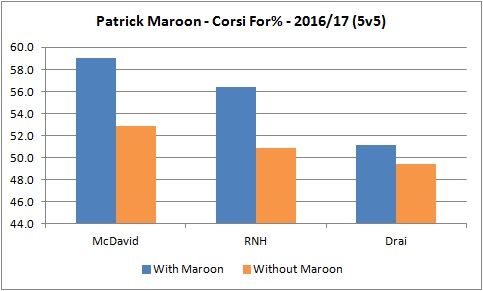
After 20 games, it appears that the driver of the offence outside of McDavid has been 28 year old winger Patrick Maroon, who was acquired by the Oilers from Anaheim at the 2016 trade deadline. Maroon is currently tied for the team lead in goals and sits 6th on the team with 1.77 points per hour. When he’s on the ice at 5v5, the Oilers get a much higher share of the total shot attempts (55.5%) taken by his team and the opponents, +5.3% relative to his teammates. And this has been done playing 125 minutes with Draisaitl, 114 minutes with McDavid, and 36 minutes with RNH. Each of the three centers has done better when it comes to the total share of shot attempts with him than without him.
Full article is at The Copper & Blue.
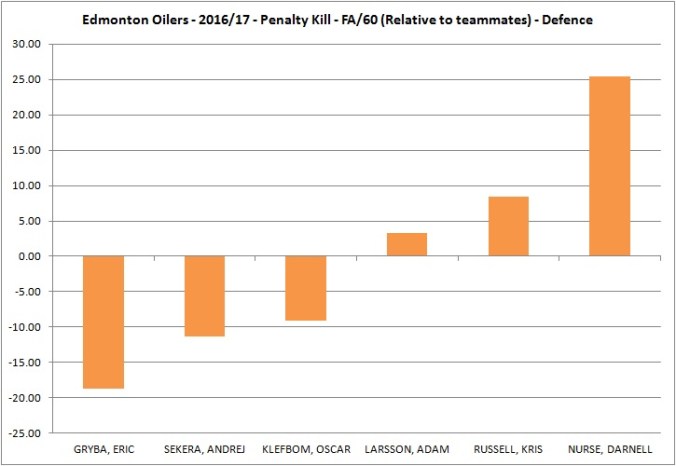
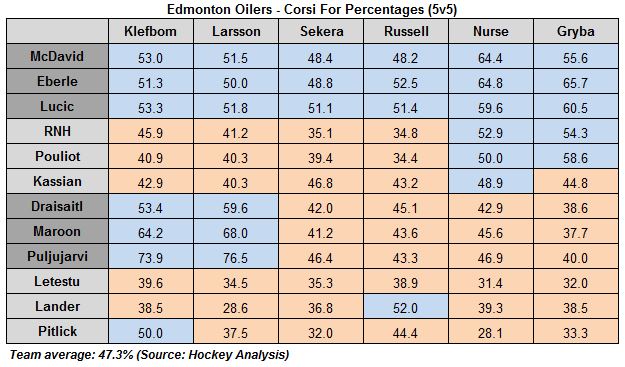
 Appears that we won’t be going a day without hearing how great defenceman Kris Russell is for the Oilers, or how bad his underlying numbers are.
 Had the opportunity to chat about the Oilers on the CBC News in Edmonton with Adrienne Pan this evening. We covered the current losing streak, what the potential solutions might be, and what to expect going forward.
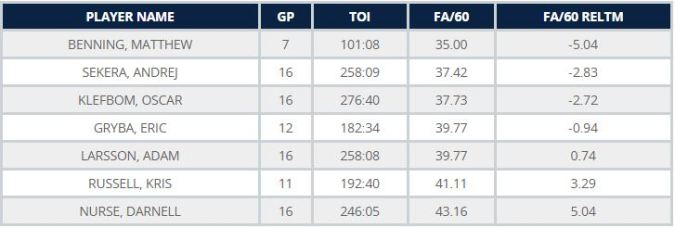

