Following a 29th place finish, the Oilers focused on their defence, and made significant changes in the off-season acquiring Adam Larsson for Taylor Hall, and signing Kris Russell. Adding experienced players allowed them to push Nurse further down the depth chart, at an appropriate level for a developing prospect. And it allowed for the Oilers to push down defencemen like Reinhart and Oesterle to the minors where they could continue to develop.
A quick look at the 2015/16 defence group that played at least 100 minutes at 5v5, compared to the 2016/17 group (sorted by TOI).
| 2015/16 |
GP |
TOI |
| ANDREJ.SEKERA |
81 |
1,353.24 |
| DARNELL.NURSE (R) |
69 |
1,166.12 |
| MARK.FAYNE |
69 |
1,002.99 |
| ERIC.GRYBA |
53 |
796.07 |
| BRANDON.DAVIDSON (R) |
51 |
777.24 |
| JUSTIN.SCHULTZ |
63 |
712.33 |
| OSCAR.KLEFBOM |
30 |
483.39 |
| GRIFFIN.REINHART (R) |
29 |
452.04 |
| JORDAN.OESTERLE (R) |
17 |
294.50 |
| ADAM.CLENDENING |
29 |
279.84 |
| NIKITA.NIKITIN |
11 |
155.30 |
| ADAM.PARDY |
23 |
153.45 |
| 2016/17 |
GP |
TOI |
| OSCAR.KLEFBOM |
79 |
1,339.57 |
| ADAM.LARSSON |
76 |
1,325.61 |
| ANDREJ.SEKERA |
77 |
1,248.21 |
| KRIS.RUSSELL |
65 |
1,142.57 |
| MATT.BENNING (R) |
59 |
877.38 |
| DARNELL.NURSE |
42 |
641.26 |
| ERIC.GRYBA |
39 |
564.52 |
| BRANDON.DAVIDSON |
36 |
389.26 |
Based on the group of defencemen, and the fact that they’ve been healthy for the most part, and the fact that the rate of goals against per 60 is down (goal differential of -36 to +22), my expectation was that the team improved this season in the following areas at even-strength (5v5):
- Fenwick against/60
- Shots against/60
- Expected goals against/60
- Scoring chances against/60
- Average shot distance against
Now these are all reflective of the things that teams probably want to be good at defensively and where teams would want to improve if they revamp their defence core. They want to limit the shots getting through (i.e., they block shots), they want to keep shots away from their net, keep pucks to the outside, they want to force low-probability shots and limit scoring chances.
Here’s a high-level summary, comparing the Oilers numbers from last season to this season. I’ve included their league ranking for each metric.
| Edmonton Oilers (5v5) |
2015/16 |
2016/17 |
| Fenwick Against/60 |
42.67 (24th) |
40.33 (9th) |
| Shots Against/60 |
30.64 (24th) |
29.46 (12th) |
| Scoring Chances Against/60 |
8.39 (19th) |
8.81 (26th) |
| xGoals Against |
2.55 (23rd) |
2.64 (24th) |
| Avg Shot Distance |
33.01 (27th) |
30.92 (30th) |
| Goals Against |
2.63 (30th) |
2.16 (9th) |
| Save% |
91.43 (29th) |
92.68 (8th) |
At first glance, it appears the Oilers have improved this season when it comes to the volume of shots against (Fenwick, Shots on goals). And when it comes to the quality of those shots (Scoring chances, expected goals), it appears they’re hasn’t been much of an improvement from last season. The key thing that jumps out is the team save percentage, which has been strong and consistent all year. But let’s take a look at each metric.
Fenwick Against/60
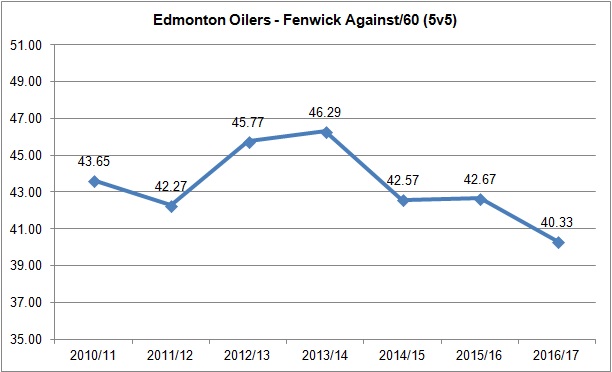
The Oilers saw their rate of unblocked shots against go down by 2 events per 60 minutes at 5v5 this season, which moved them from 24th overall to 9th. Below are the year-to-year numbers for the Oilers. Please note that in the graph below, the range (35 to 51) reflects the average league-wide range.
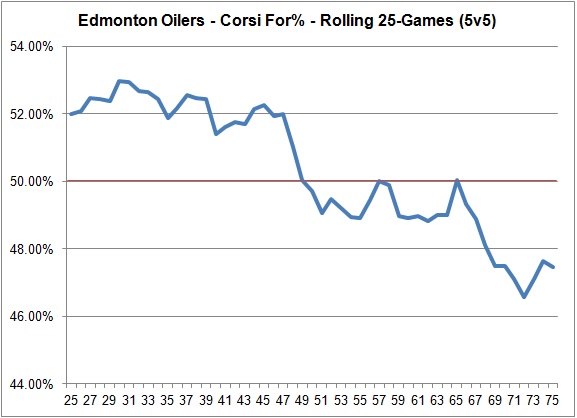
The Oilers have been much better at blocking shot attempts this season, blocking 28% (7th in the league) compared to 26% last season (15th in the league). What’s a little troubling is that the rate of unblocked shots against has gradually increased over the course of the 2016/17season, as the Oilers started off well, but have gradually been worse. Below is the rolling 25-game segments, with two lines: the 2015/16 season on the left and the 2016/17 season on the right.
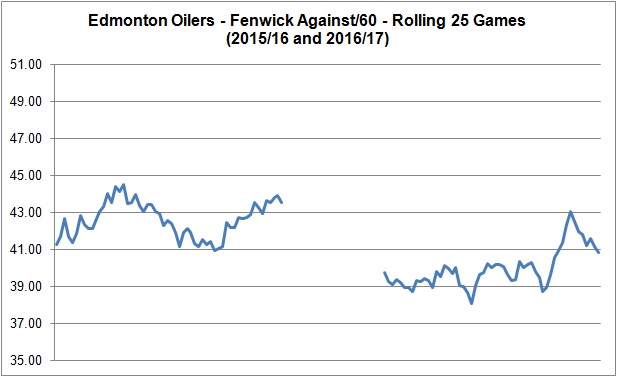
The team finished with a rate of 42.67 Fenwicks against/60 last season, and actually exceeded that rate for a 25-game stretch this season. I’d say the defence has been better, but they still haven’t ironed out some of the deficiencies from last season.
Shots Against/60
The Oilers saw their rate of shots on goals against per 60 drop by 1.18 this season. This doesn’t seem significant, but it moved the Oilers from being below league average to just around it.

But again, if we look at the rolling 25-game segments at 5v5, we see that the team is still having issues, especially in the most recent stretch where they’ve hovered around the same rate of shots against as last season. I find this pretty odd considering the Oilers defence core has been healthy all year, and the defence pairings have been consistent all year.

Scoring Chances Against/60
Now this I wasn’t expecting.
The rate of scoring chances against, as defined by Corsica, has actually increased this season, dropping them from 19th in the league to 26th.

It appears that last season, the club was a lot more consistent when it came to preventing scoring chances, hovering between 8 and 9 chances per 60. This season they’ve struggled, as they’ve shown signs of improvement, dropping from around 10 chances per hour down to 7. But this gradually got worse again, even surpassing last season’s worst stretch.

What’s worth noting here is that the average distance of the shots against has dropped, meaning the shots against are getting closer. The Oilers are 30th in league when it comes to this metric, meaning Talbot is getting shot at from a lot closer than past seasons. This leads us to our measure for shot quality.
Expected Goals Against/60
This is a weighting placed on every unblocked shot based on the probability of the shot becoming a goal. This depends on the type of shot, location and uses historical shot and goals data to come up with the probability for each unblocked shot. This captures a lot more data compared to scoring chances, as every unblocked shot against is included, and also does a good job of predicting future goals. (Detailed explanation can be found at Corsica Hockey).
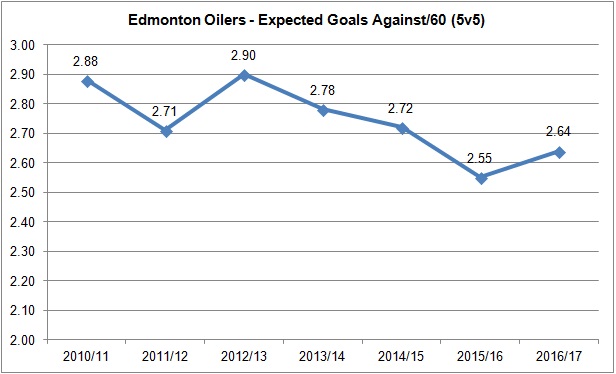
It appears that when it comes to expected goals against, the Oilers have been worse this season compared to last, dropping from 23rd to 24th in the league. So while the team is preventing more shots from getting through (i.e., they’re blocking more shots), the shots they allow are of the higher quality, and the ones more likely to becoming goals.
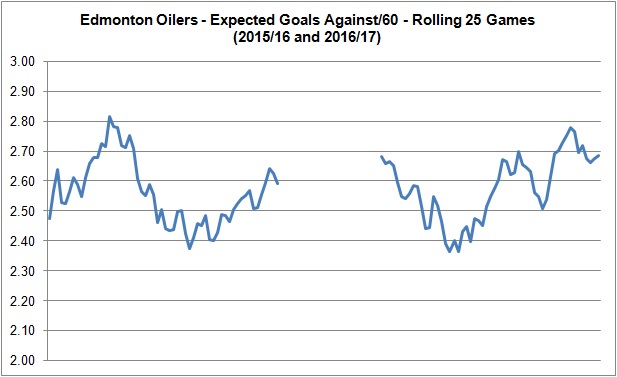
What’s worse is that the rate of expected goals against has gradually increased this season, again surpassing some of the worst stretches from last season.
Summary
My takeaway from this is that the team hasn’t really improved when it comes to the defensive side of the game, making only marginal progress when it comes to the rate of shots against, but actually getting worse when it comes to the quality of those shots against. This is pretty disappointing considering the cost of acquiring Larsson, and some of the narratives about this team being more balanced on the back-end and being harder to play against.
The biggest factor that has driven down the rate of goals against has been Cam Talbot, who has started the vast majority of games this season. First, a quick glance at the team’s save percentage year over year:

The club went from having the second worst team save percentage last season to the 9th best this season. What’s even better is that the save percentage has trended upwards over the course of this season, with the club even reaching 94% (!!) for a 25-game stretch.

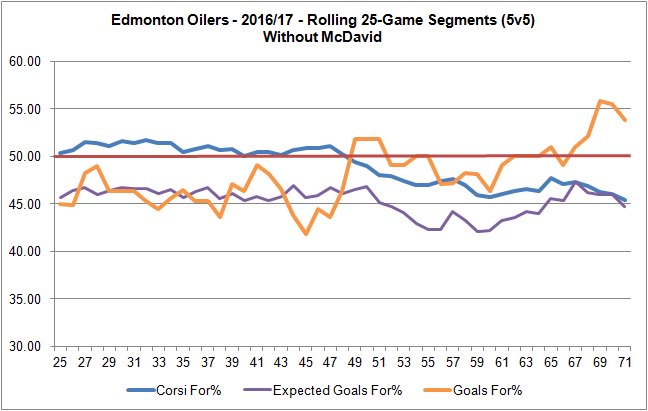
Without Talbot’s improved play from last season, there is no way this team would be contending for a division title. While the Oilers even-strength offence is relying heavily on McDavid, it appears that the drop in goals against is largely due to Talbot, and not the defence core.
Data: Corsica Hockey
/cdn0.vox-cdn.com/uploads/chorus_asset/file/8199815/20170321___McDavid___On_ice.jpg)
/cdn0.vox-cdn.com/uploads/chorus_asset/file/8202159/20170321___McDavid___With_Defence_pairings.jpg)
/cdn0.vox-cdn.com/uploads/chorus_asset/file/8188417/20170320___McDavid___Team_Stats.jpg)
/cdn0.vox-cdn.com/uploads/chorus_asset/file/8188431/20170320___McDavid___WOWY.jpg)