Thoughts on the Oilers Powerplay, Defence Pairings, Talbot + Radio spot (CBC Radio Active)

NHL: Arizona Coyotes at Edmonton Oilers

I joined Portia Clark on CBC Radio Active on Tuesday afternoon to talk Oilers, the playoff race and what areas the team needs to improve on. Full clip is here: CBC Radio Active (2017, March 14)

After 69 games, the Oilers are sitting in the first wild-card spot in the West with 81 points, four points ahead of St. Louis, who have the second wild-card spot, and eight (!) points up on Los Angeles. The Flames (2nd) and Anaheim (3rd) are only one point ahead. The Oilers rank 4th in the west when it comes to 5v5 goal-share with 52.96%, behind Minnesota, San Jose and Chicago. Calgary, Anaheim and St. Louis, the team’s the Oilers are battling with for playoff positioning, each have a goal-share of 50.6% this season

In terms of shot-share, the Oilers have slumped, especially over their last 25 games as they’ve posted a 48% Corsi For since mid January. Over the year, the Oilers have a Corsi For% of around 50%, right around league average, but it’s important to note that the final 25 games of a season can predict pretty accurately how a team does in the playoffs. The team is still getting results, but the underlying shot metrics paint a slightly different picture.

Powerplay

I think it’s worth emphasizing that the Oilers powerplay this season is good and it’s real. They rank 7th in the league when it comes to goals per hour with the man-advantage, which is second in the west, only behind the Blues. To measure sustainbility, it’s worth looking at their shot rates, which have been pretty good. They’re generating 53 shots per hour (that’s shots on goal) on the powerplay, which ranks 12th in the league, and 4th in the west.

The top three point producers at 5v4 are Draisaitl (6.82 points per hour), Lucic (6.35) and McDavid (5.59). And in terms of generating shots, the MVP on the powerplay has been Letestu, as the team sees a significant jump with him on the ice at 5v4. He has seven points on the powerplay, and ranks 9th in terms of points per hour with 1.90. But the team is much better, generating over 61 shots per hour, with him on the ice. Worth noting that when it comes shots per 60 relative to the team average, Letestu is a +9.76 which is 3rd best in the league, only behind Nazem Kadri (TOR) and Adam Lowry (WPG).
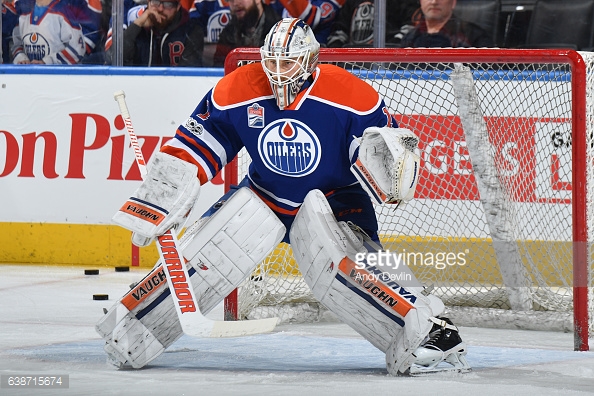
Talbot’s workload

After playing in his 62nd game last night, most among all goalies, there’s some understandable concern about Talbot’s workload and if this could impact his future performance.  Among the regular starters (>2,000 minutes), Talbot currently ranks 8th when it comes to 5v5 save percentage and is surrounded by some pretty decent net minders.

Player Team Games Sv% (5v5)
CAREY.PRICE MTL 53 93.81
BRADEN.HOLTBY WSH 53 93.74
DEVAN.DUBNYK MIN 55 93.57
SERGEI.BOBROVSKY CBJ 54 93.49
COREY.CRAWFORD CHI 46 93.20
JOHN.GIBSON ANA 49 93.19
CAM.TALBOT EDM 62 92.92
ROBIN.LEHNER BUF 50 92.89
PETER.BUDAJ L.A/T.B 55 92.66
RYAN.MILLER VAN 45 92.64

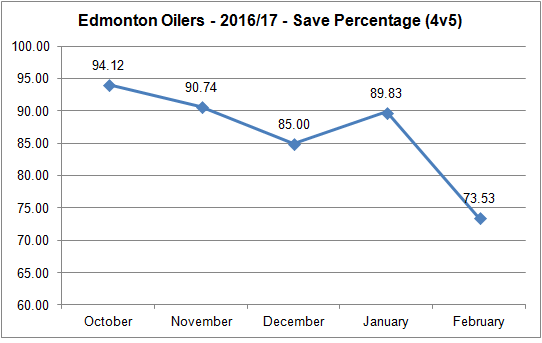
The good news here is that his 5v5 save percenateg hasn’t dipped as the season has wore on, as he has posted a 92.98 save percentage over his last 25 games.

03-15-2017 12-57-22 PM

Where his numbers have dipped is on the penalty kill, which I think has more to do with the team’s season-long issue of shots against per hour (7th highest in the league) and quality chances than it does his own stamina.

Talbot has not only bailed out the team on a number of occasions, but he’s also done a pretty nice solid for the GM. The Oilers completely botched their search for a backup goalie last summer and still need to address it in the off-season. For now, Talbot has remained healthy and has provided solid minutes.

Defence pairings

The tandem of Klefbom and Larsson has been good this season, providing quality minutes and playing well against the best competition. It’s a balanced pairing with Klefbom being the good, all-round defenceman who can move the puck well and contribute offensively, and Larsson excelling in his own zone. One thing I’ll do at the end of the season is see how they compare against similar tandems, in terms of offence and defence. I think they’ve been good in all areas of the ice, but it’s worth digging into the data to see if they’re real or not.

Data: Hockey Analysis, Corsica Hockey

Talking Oilers and the Playoff Race on the CBC Edmonton News (TV)

Sunil CBC - 20170314

I joined Adrienne Pan on the CBC Edmonton News on Tuesday evening to talk Oilers and the playoff race. Link is here, clip starts around the 21 minute mark: CBC Edmonton News (2017, March 14)

Topics we touched on:

  • Losses against Pittsburgh and Montreal and areas for concern
  • Potentially shaking up the line combinations
  • Could the Oilers miss the playoffs
  • Potential first round match-up if they do make it
  • Cam Talbot’s workload
  • Upcoming week and what to expect

A big thank you to the team at CBC for putting it all together! Always appreciate the work they do.


Talking Oilers and Playoff Race on The Lowdown with Lowetide (TSN 1260)

I joined Lowetide yesterday on TSN 1260 to talk all things Oilers. Clip is below, starting around the 20 minute mark.

Topics we touched on:

  • The Oilers struggles when it comes to Corsi For% over their last 25 games
  • Losses to Pittsburgh and Montreal; slow starts in both and against Montreal they played a little out of character when they had the lead.
  • Potentially shaking up the line combinations, adding a volume shooter like Slepyshev or Puljujaarvi to the top line
  • Playoff race and why the Oilers are in good spot
  • Upcoming week, games against Dallas, Boston and Vancouver.


McDavid vs Eichel

cut

A short piece popped up on ESPN yesterday with the headline: Is Jack Eichel having a better season than Connor McDavid?

Before I go on, I have to clarify that I have no issues with Eichel and hope he goes on to have a fantastic career. He’s a prospect that we’ll hear lots about, considering he went second in the draft after McDavid, and also because he has the potential to be one of the NHL’s elite forwards. Anyone who appreciates offence and skill is going to be a fan of his game.

But is Eichel really having a better season than McDavid? My first instinct is no, mainly because I’ve watched McDavid excel this year and he’s been in the top 5 league-wide when it comes to scoring. And to be honest, I hadn’t heard a lot of noise about Eichel up until this point. So I was quite surprised to see the graphic ESPN had published.

i

Source: ESPN

Appears that yes, both players are posting some great numbers since Eichel made his season debut on November 29th. But is Eichel really having a better season than McDavid? Let’s take a quick look.

First, let’s split out the even-strength (5v5) time to see how the two forwards have done when the game is in it’s natural state. Special teams play is assessed differently, which I’ll get to as well.

Here’s how both players have done since November 29, 2016.

Metrics (5v5) McDavid Eichel
Games 43 46
TOI 689.72 704.19
G/A/P 7-20-27 9-13-22
Points/60 2.35 1.87
Individual Shots For/60 8.35 10.91
Individual xGoals/60 0.96 0.75
Individual Scoring Chances For/60 3.57 1.70
Individual Shooting% 7.29 7.03
Penalty Differential +16 +8
On-ice Shooting% 9.33 7.97
On-ice Save% 92.26 92.10
PDO 101.59 100.07

First thing that jumps out is that while both players have scored 45 points, 60% of McDavid’s have come at even-strength (27). Eichel on the other hand appears to be getting a larger share (51%) of his points on the powerplay, which has been excellent for the Sabres this season. McDavid is ahead of Eichel when it comes to even-strength points per 60 over this stretch, and is also well ahead when it comes to the rate of individual scoring chances. Worth noting that when it comes to primary points (i.e., goals and primary assists), McDavid has the slight edge over Eichel, 20-17. Neither player appears to be riding a significant PDO wave, so I’m confident that what we’ve seen from both players at 5v5 reflects their true talent.

Another way to assess both players is by looking at how their team has done across different metrics when they’re on the ice, versus when they’re off the ice. These are the five team metrics I’ll use:

  • Corsi For% (CF%) – The proportion of all the shot attempts the team generated and allowed that the Oilers generated (i.e., Corsi For/(Corsi For + Corsi Against). This is used as a proxy for possession and can predict a team’s future share of goals.
  • Fenwick For% (FF%) – The proportion of all the unblocked shot attempts the team generated and allowed that the Oilers generated (i.e., Fenwick For/(Fenwick For + Fenwick Against). This is used as a proxy for shot quality and considers shot blocking a repeatable skill. It can also predict a team’s future share of goals, slightlty better than Corsi.
  • Scoring Chances For% (SCF%) – The proportion of all the scoring chances (as defined by Corsica Hockey) that the team generated and allowed that the Oilers generated (i.e., Scoring Chances For/(Scoring Chances For + Scoring Chances Against).
  • Expected Goals For% (xGF%) – This is a weighting placed on every unblocked shot based on the probability of the shot becoming a goal. This depends on the type of shot, location and uses historical shot and goals data to come up with the probability for each unblocked shot. This has been found to be a better predictor of future goals than Corsi and Fenwick. (Detailed explanation can be found at Corsica Hockey)
  • Goals For% (GF%) – The proportion of all the goals that the team scored and allowed that the Oilers generated (i.e., Goals For/(Goals For + Goals Against).

We know that McDavid has been lights out this season, and has really been the offensive driver for the Oilers. The team is one of the best in the league when McDavid is on the ice, but falls below average without him. The charts below reflect the games since November 29th.

McDavid - since Nov29

I wasn’t expecting the Sabres to post the same type of numbers when Eichel has been on the ice, but I figured they would at least post a 50% shot-share and goal-share with him. And I assumed their play would drop off by at least a few percentage points without him on the ice. Turns out, I was wrong.

Eichel

Across four of the five metrics, the Sabres have less than a 50% share with and without Eichel on the ice. And it appears based on the Scoring Chances and Expected Goals Share, that the Sabres get a slightly higher share without Eichel. There’s definitely more to the story, as we could assess who his linemates are, the competition he sees, what the defence pairings are like, etc. But for now, it’s difficult to convince me that Eichel is having a better season that McDavid.

Power Play

I wasn’t going to touch on special teams, but seeing that most of Eichel’s points this season are on the powerplay, it’s worth digging into to see how it has impacted the Sabres.

Since November 29th, at 5v4, the Sabres rank second (!) in the league when it comes to goals for per hour (7.82), while the Oilers rank fifth with 7.45. Both clubs have found success on the powerplay this season thanks in large part to their rate of shots per hour with the Oilers ranking fourth (53.95) and the Sabres ranking fifth (53.75).

And here’s how the two players compare at 5v4.

Metrics (5v4) McDavid Eichel
Games 41 44
TOI 106.13 143.75
G/A/P 2-7-9 8-9-17
Points/60 5.09 7.10
On-ice Shots For/60 60.49 62.19
On-ice Goals For/60 8.48 9.60
Individual Shots For/60 10.18 17.53
Individual Shooting% 11.11 19.05

Based on the numbers, it looks like the one area where Eichel is having more success than McDavid is on the powerplay. Eichel appears to be the shooter on his powerplay unit, getting a higher proportion of the shots he’s on the ice for, and generating 17.53 shots per hour himself. He’s also producing 7.10 points per hour, 3rd highest in the league among forwards, and is an increase from his previous season’s rate of 5.34. Impressive numbers, but we have to remember that McDavid plays a slightly different role for Edmonton, positioning himself on the ice as more of a playmaker. Regardless, both teams are benefiting from having their young stars on the ice at 5v4, and I think it’s safe to assume that it’ll continue.

Takeaway: While Eichel is putting together a pretty decent season, especially on the powerplay, it’s hard to argue that it’s been better than McDavid’s. This isn’t any sort of knock on Eichel; he’s a tremendous talent that will be an offensive driver for the Sabres. But until he posts better point rates at 5v5, and the Sabres post better shot and goal-shares with him on the ice, McDavid will remain the superior player.

Data: Corsica Hockey


Checking in on Jordan Eberle

The 2016/17 season has been a challenge for the 26-year old winger. Because of his cap hit and the fact that he played with McDavid early on in the season, and continues to play a top-six role, expectations are high. Unfortunately, Eberle’s goal and point production has been lower this season compared to his past season’s, which has drawn plenty of attention as the Oilers are desperate for secondary scoring.

Data: Corsica Hockey

While his 1.60 points per hour is lower than his career norms, it’s a slight improvement compared to where he was in late December after 37 games. At that point, Eberle had only 12 even-strength points, a rate of 1.40 points per 60, with only six of those points being primary (i.e., goals and primary assists).

When I dug into his numbers in late December, I had found that Eberle’s individual rate of shots per hour and his individual expected goals, which gives a weighting to each unblocked shot based on the type and distance, were in line with his past numbers. The Oilers were also a better team when it came to their share of total shot attempts (Corsi For%) and scoring chances when Eberle was on the ice. The main issue for Eberle at the time was that his individual shooting percentage was 4.55%, well below the 12%-13% shooting percentage he had posted in the past three seasons. Knowing that player’s tend to regress towards their career averages over time, my thought was that Eberle’s shooting percentage would improve over the rest of the season, and the points would (hopefully) start to pile up.

Fast forward to today, and it looks like things are getting back to normal for Eberle. Below is a table that breaks out Eberle’s season into two periods: games prior to December 30, 2016, and games from December 31, 2016 onwards.

Before December 30, 2016 Since December 31, 2016
Games 37 28
TOI/Game 13.89 13.69
G/A/P 3-9-12 6-6-12
Points/60 1.40 1.88
Corsi For% (Rel) 53.07 (+2.57) 51.26 (+2.71)
xGoals For% (Rel) 51.51 (+3.23) 49.91 (+0.35)
Goals For% (Rel) 47.22 (-6.46) 62.96 (+10.33)
Individual Shots For/60 7.70 7.99
Individual xGoals/60 0.74 0.90
Individual Shooting% 4.55 11.76
On-ice Shooting% 6.05 8.54
On-ice Save% 92.91 94.29
PDO 98.96 102.83

Full article is at The Copper & Blue.


Desharnais, Eberle and the Pacific Division + Radio spot (TSN 1260)

Joined Lowetide this morning on TSN 1260 to talk all things Oilers. We touched on David Desharnais’ debut against the Wings, the defence combinations and how things might shape up in the Pacific division. Audio clip is below.

Couple notes I wanted to add.

Desharnais

While I wasn’t fan of the trade, I still think Desharnais can bring value to the team. I’m always of the mindset that a team should load up on as many experienced centers as possible and stack their bottom six with them. The best teams tend to pick up experienced centers on the cheap in the off-season, and have no issues moving them to wing and deploy them on special teams as needed.

My issue with acquiring Desharnais was that I thought it was poor asset management losing a good young defenceman and not getting back a young forward worth protecting in the expansion draft. While it’s true Desharnais could play well enough and be signed by the team, which would slightly off-set the loss of Davidson. It still would’ve been smarter to acquire an asset that you wouldn’t have to overpay until further down the road. A younger  forward under team control for longer would have less of an impact on the cap over the long-run and would give the team more flexibility when constructing their roster.

One thing I want to highlight are some of the positive underlying numbers Desharnais has posted over his career in Montreal. First, a quick glance of his points per hour at even-strength and we do see that it’s been declining. Considering the time he has spent with Pacioretty up until the 2014/15 season, I thought the numbers would’ve been higher.

20170228-desharnais

Looking at the share of shot attempts with Desharnais on the ice, we see that for most of his career, he’s been a positive influence. What I think would catch the Oilers attention is the team goal-share when he’s been on the ice. In 2014/15, arguably his last good season, the Habs had a 63.1% goal-share when Desharnais was on the ice, and a 50.85% share when he was on the bench. In terms of shot-share, the club was just under 50% without him, but it jumped up by 3.50% when he was on the ice. The numbers haven’t been very strong over the last two seasons, but that’s mostly because he’s been playing further down the lineup.

Desharnais - RelStats

Keep in mind as well that a lot of his success has largely been because of Pacioretty. Over the course of his career, Desharnais has played over 3,000 minutes with Pacioretty, with the Habs posting a 57.8% goal-share and a 53.3% Corsi For%. And there’s a bigger drop in the team’s outputs when Desharnais is on the ice without Pacioretty. (Source: Hockey Analysis). Key takeaway here is that while Desharnais isn’t any sort of play driver, he can play with skilled players and has not been any sort of drag.

CF% GF%
Desharnais + Pacioretty 53.3 57.8
Desharnais Away 48.2 52.5
Pacioretty Away 52.8 51.0

Pacific division

One thing Al and I touched on was how the Pacific division might shake out, and who the Oilers might see in the first round.

20170306 - Pacific division

In my mind, if the playoffs started today, the two most dangerous teams would be San Jose and Calgary. Both have posted a Corsi For% (score and venue adjusted) of over 52% over their last 25 games (Source: Corsica Hockey). Edmonton, on the other hand, has posted a 49.7% share and Anaheim has had a 50.8% share over that same stretch. I expect the Oilers numbers to improve in March, and it’ll especially be critical that they post a better Corsi For% when McDavid isn’t on the ice. Right now the Oilers are a 54.0% CF% team with their captain, but that share drops down to 49.1% when he’s not on the ice.

Eberle

It’s nice to see that Eberle’s production is coming around, and that he’s slowly getting back to where we expect him to be. What’s worth mentioning is that his shooting percentage, something that I thought would eventually regress towards his career average, is now around an acceptable level.

20170306 - Eberle Shooting percentage

A big reason why I had remained optimistic about Eberle’s production improving back in December was that his overall shot-share and shots per hour rates were consistent around his career averages. The other issue was that historically his individual shooting percentages typically got worse before they got better as the season wore on, with this season being no different. The other issue for Eberle was that his shooting percentage dipped far below his career norms this season, but we know from past research that a player’s shooting percentage tends to eventually regress towards his career averages. Eberle isn’t old or injured, so I figured we’d see his production get better.

What do the Oilers have with Justin Fontaine?

fontaine

The Oilers made a minor league move on trade deadline day, moving out their top AHL scorer Taylor Beck to the Rangers for winger Justin Fontaine. The talk around Fontaine is that he’s a good skater, more likely to play in the NHL compared to Beck, so I figured it’d be a good time to dig into what exactly he’s done since breaking into the league in 2013/14 season and what value he could potentially bring to the Oilers.

First some background. Fontaine completed four years at  the University of Minnesota-Duluth in the NCAA, scoring 164 points in 159 games over that stretch, and was part of the championship team in 2011. At age 24, he signed a two year, $1.19 million entry-level deal with the Minnesota Wild in April 2011 and played the full two seasons in the AHL, scoring 111 points in 137 games with the Houston Aeros. He was second on his team in points in his first year, and led the Aeros in points in his second year. Fontaine was also suspended in his first season by the team for two games for using a gay slur (Source). As an RFA following  the completion of his entry-level deal in July 2013, the Wild extended him for one season at $600,000 and played him at the NHL level for 66 regular season games and 9 playoff games. As a UFA at the end of the 2013/14 season, at the age of 27, the Wild signed Fontaine to a one-way contract for two years worth $2 million. Over those two season, Fontaine played 131 regular season games and another 10 in the playoffs.

The Wild did not extend him at the end of his contract term, and in the 2016 off-season, Fontaine accepted a professional try-out deal with the Panthers. After failing to land a deal, Fontaine accepted a one year, two way deal with the Rangers who assigned him to their AHL team in Hartford for the 2016/17 season. At the time of the trade, Fontaine was tied for second on his AHL team in points with 30. At that point, younger players in the Rangers system had been the preferred call-ups to the NHL roster over Fontaine (Source: Blue Shirt Banter)

Numbers

So what the Oilers have acquired is someone who had a pretty successful college career, made a smooth transition to the AHL, and then played 197 regular season games (and 19 playoff games) as more of a depth winger. A quick glance at his even-strength numbers indicates that as a member of the Wild, he put up a decent rate of points, but didn’t have the underlying shot numbers that would indicate long-term success.

Season GP TOI G-A-P P/60 iSF/60 Avg.DIST
2013/14 66 722.69 11-7-18 1.49 5.98 28.17
2014/15 71 757.10 9-20-29 2.30 7.61 27.98
2015/16 60 618.85 5-10-15 1.45 4.56 32.29

Over the three seasons, Fontaine was a fairly productive player, playing predominantly in a secondary role. Fontaine’s points/60 ranked him just around the middle of the pack among forwards who played at least 50 minutes in his first season. In the second season, his 2.30 points/60 was the best on his team and in his third season, he was ranked 7th (just above average on the Wild). Really his best season was his second year (first year of the two-year deal he signed as an UFA), but his third season saw not only his points drop, but also the rate of his individual shots, which was one of the worst on the team.

Below I’ve graphed out the share of shot attempts, expected goals and goals when Fontaine was on the ice, relative to his team.

20170303-fontaine

Here we see that in his first year, when Fontaine was on the ice, the team had a 46.03% share of all of the shot attempts that happened, for and against. When Fontaine was off the ice, the team fared much better, getting a 49.66% share (a difference of 3.63). The team also did better in terms of expected goals, or a measure of shot quality, without Fontaine on the ice, getting a share of 54.68%. When Fontaine was on the ice, the Wild had 47.20% of the expected goals.

But when it came to actual goals, the team always got more than a 50% share of the total goals for and against when Fontaine was on the ice. In his first two seasons, the team’s goal share was 58.97% and 61.29%, respectively. Worth noting that Fontaine’s PDO was one of the highest on his teams, hovering around 103 in his first two seasons, as the on-ice shooting percentage was much higher than the team average. When the PDO was back down to normal in the 2015/16 season, his on-ice goal-share aligned better with his shot-share numbers. I think the real Fontaine is reflected in the 2015/16 numbers, which weren’t terrible, but was probably enough for the Wild to move on from him and find replacements.

Linemates

And here are the different line combinations Fontaine was a part of over his three seasons in Minnesota. You’ll notice he started off playing mostly with the dregs, but did move up and down the depth chart, getting opportunities with Parise, Coyle and Niedereitter. The issue for Fontaine was that he was mostly a drag on his linemates as most of the players did better in terms of shot share away from him.

2013/14

Linemates TOI CF% xGF% GF% PDO
Brodziak & Cooke 352.00 46.61 49.13 52.38 102.15
Koivu & Parise 51.00 47.06 48.01 50.00 101.83

2014/15

Linemates TOI CF% xGF% GF% PDO
Coyle & Vanek 133.23 45.57 49.59 73.33 115.77
Coyle & Niederreiter 65.60 56.82 68.23 50.00 98.99
Brodziak & Cooke 64.50 38.24 39.83 20.00 92.09
Brodziak & Carter 58.95 46.67 57.24 50.00

102.98

2015/16

Linemates TOI CF% xGF% GF% PDO
Coyle & Vanek 154.21 46.15 52.98 63.64 104.89
Coyle & Niederreiter 93.43 57.05 65.63 71.43 104.26
Stoll & Carter 72.53 32.77 57.12 25.00 94.36
Haula & Niederreiter 68.97 50.00 54.17 66.67 110.32

Only in two combinations over the three seasons was Fontaine on a line that posted a CF% above 50%. And in both cases, Niederrieter is with him to drive the offence.

Worth noting that in his three seasons, the team’s ability to generate shots always went down when Fontaine was on the ice. But the club did alright when it came to suppressing shots with him on the ice.

Season Rel Corsi For/60 Rel Corsi Against/60
2013/2014 -6.49 0.52
2014/2015 -4.51 -3.66
2015/2016 -8.2 0.54

Special Teams

With the Oilers struggling this season on the penalty kill, I thought adding a right handed depth forward might be what the team was focusing on with this trade. I’ve read that Fontaine had played on the powerplay and penalty kill in Minnesota, but I wanted to see how the team actually did in terms of unblocked shots against and goals with him on the ice.

Powerplay

Season TOI Rel.Fenwick For/60 Rel.Goals For/60
2013/14 76.48 -28.6 -1.12
2014/15 38.63 -26.53 -0.19
2015/16 16.16 -38.54 -2.83

Here we see that the Wild gave him plenty of opportunity in his first season on the powerplay, but clearly weren’t impressed. The rate of shots generated took a significant dive with him on the ice, and the team’s rate of goal-scoring slipped as well. Judging by the ice time, the Wild went in a different direction and transitioned Fontaine to the penalty kill, where things weren’t as bad for him.

Penalty Kill

Season TOI Rel.Fenwick Against/60 Rel.Goals Against/60
2013/14 3.47 -52.77 -7.22
2014/15 47.46 -6.51 1.79
2015/16 67.83 7.76 -0.19

The numbers in the first season can be ignored. But in his second season, Fontaine spent some time on the penalty kill and the team was better suppressing shots with him on the ice. The team bumped his ice time the following season, and actually got burned because of it. The rate of goals against was fine, but the team allowed a lot more shots with him on the ice.

What these numbers tell me is that while Fontaine has experience playing on the powerplay and penalty kill, his results trended downward over time.

Takeaways:

  • Fontaine does add right wing depth to the Oilers and the cost to acquire him was next to nothing, considering Beck’s poor showing in the NHL.
  • He does have experience playing with skilled forwards, but he tends to drag down his linemates ability to generate shots.
  • The Wild did do alright in terms of suppressing shots when Fontaine was on the ice. This occurred across different line combinations, so I wouldn’t attribute his on-ice numbers to the performance of others.
  • Fontaine is not an ideal candidate to play on the Oilers penalty kill, which is disappointing considering how bad it’s been.
  • It would not surprise me if it was Fontaine’s on-ice goal-share that the Oilers were drawn to. Hopefully it’s recognized that he rode some high percentages, and that his on-ice shot shares paint a better picture of the player.
  • In terms of recall options and ice time, I hope the Oilers give priority to Slepyshev, who has played well this season.

Source(s): Corsica Hockey, Cap Friendly, Elite Prospects

Thoughts on the Trade Deadline

brossoit.jpg

The Oilers were a quiet group yesterday, making one minor league move acquiring Justin Fontaine from the Rangers farm system for Taylor Beck. The team chose not to address their backup goaltending position or the lack of secondary scoring up front.

Now improving these two areas could’ve boosted their chances of making a deeper run in the playoffs this season and probably wouldn’t have cost them that much considering someone like PA Parenteau was traded for a 6th round pick. On the flip side, I understand holding on the existing assets as the club doesn’t have a second round pick, but two in the third round and two in the fifth (Source: Cap Friendly). These picks need to be used to improve their development system, as outside of Puljujaarvi, there’s not much going on in terms of high end talent. And when the McDavid contract is in place, the team will need to draft and develop their own talent, have them ready for the NHL and get them on team friendly deals. It’s going to be critical.

My issue with yesterday’s deadline is that the club clearly recognizes that they’re not contenders this year, as suggested by team management only a few weeks ago. I understand that Chiarelli is controlling the message here and tempering expectations, but the fact is they’ve really treated their season as a development year, not making enough moves in the off-season that would’ve boosted scoring and made them legitimate contenders.

“I don’t think we’re ready to contend for the Cup,” he said, in the context of how active he’ll be at the March 1 trade deadline. “You never know — I know it happened here in 2006. (But) I just don’t see us being big players, from that regard.” (Source: Sportsnet)

And following the deadline, the spin Chiarelli delivered was consistent with his messaging a few weeks ago. And it’s been latched on to quite well by the media and fans. When you read about the team being “rewarded” to show what they can do, just remember how little the coaching staff has played the backup goaltenders and the shuffling of the secondary line combinations this season. Thea team may be able try out a few new things with Deshanais in the fold, but it’s really the same cast of characters that the coaching staff has shown little confidence in.

If the team wasn’t going to make a run for a championshup this year, then I don’t understand why they wouldn’t acquire future assets in the form of picks and prospects. With McDavid, this team has to be contending for a championshup as soon as next season. And when that window starts to open, the team has to do everything to get themseleves over the edge and really go all-in to win four rounds. At that point, the team will have to start moving out prospects, even those that the team thinks highly of (think Benson and Bear), just to land that one extra piece to win a cup. They’ll likely even lose a trade or two, but they’ll have to be going for it as long as the championship window is open.

This deadline would’ve been a great opportunity to start stockpiling picks and build up the prospect pool, as they’ll very soon be in a position where they have to go all-in, similar to what Washington did when they acquired Shattenkirk. The team had players like Russell and Hendricks on expiring deals and others like Fayne and Pouliot whose contracts the team would probably want to shed. Instead, the team chose not to address their future state, and may not have the assets when they’re ready to make a serious cup run.

The Oilers can spread the message of “growth year”, but it shouldn’t stop them from making decisions today that will impact their goal of a championship. The deadline was  a missed opportunity, and they’ve also let the upcoming expansion draft force their hand and they still have to lose another player. The management team has a lot of things to address going forward and really can’t be this passive and lack foresight  if they want to become serious, long-term contenders.

Thoughts on the Davidson Trade, Asset Management + TV Spot (CBC)

sunilcbc20170228

I joined Min Dhariwal, who is filling in as the host this week, on the CBC Edmonton News to talk Oilers and the upcoming trade deadline. We discussed the list of needs for the Oilers, including depth scoring and backup goaltending, and maybe waiting until the summer to make a bigger move. Clip is here (CBC Edmonton) and starts around the 20:35 mark.

Shortly after the segment aired, the Oilers made a trade sending out defenceman Brandon Davidson to Montreal for depth centerman David Desharnais. While I do understand the Oilers need for another centerman with the coaching staff reluctant to move Draisaitl off of McDavid’s wing, I don’t understand the rationale behind the cost.

While it’s true that the Oilers have an excess of left shooting defencemen in the system and were at risk of losing Davidson to the expansion draft in June, the point of trading him so they don’t lose him for nothing was to acquire a forward worth protecting, or a prospect that would be exempt from the draft, or picks that they could use in future drafts. The goal should have been to replace Davidson with an asset that would benefit them in the future. Instead they acquired Desharnais, who fills a need the Oilers have identified, but whose contract expires at the end of the year. So really they gave away an asset in the fear of potentially losing, only to acquire an asset they’re going to lose for sure.

I should clarify that I have no issues with Desharnais as an experienced, depth forward. Considering his age and declining production numbers, my expectations are rather low at this point. I know he had played in Montreal’s top six years ago, but he’s a depth player at this point who has been healthy scratched this season. He’s not any sort of shut-down type or defensize zone face-off specialist. He has success playing with top line players like Pacioretty in the past, but he’s more of a depth forward now that could do better in a new situation. A recent article on Desharnais worth checking out is over at Habs Eyes on the Prize. There’s also an excellent recap on the trade from the Habs perspective, as the team freed up some much needed cap space. It’s also quite possible that Davidson is protected by the Habs from the expansion draft, as Petry and Weber are the only two locks and Markov likely to retire..

20170228-desharnais

Moving Davidson was expected, as the Oilers are likely protecting seven forwards, three defenceman and one goalie from the expansion draft. Had they chose the second option and protected eight skaters and one goalie, they could’ve protected Davidson, (which I made a case for last month) but then that would have left Maroon unprotected, and, in my opinion, good trade bait.

  • Forwards (7): RNH, Eberle, Draisaitl, Lucic, Maroon, TBD, TBD
  • Defencemen (3): Sekera, Klefbom, Larsson
  • Goalie (1): Talbot
  • Excluded from the expansion draft: McDavid, Nurse, Benning, Caggiula, Slepyshev and Puljujaarvi.
  • Unprotected: Davidson, Pouliot, Letestu, Lander, Kassian, Khaira, Fayne, Reinhart, etc.

With Maroon protected, that leaves Davidson on the outs, but it also frees up two more spaces for forwards. You can make a case to protect Letestu or Kassian or Khaira, but all three are pretty replaceable. Really those two forward spaces are open for an asset to bring in using a piece that you’re moving out anyways. That’s what makes the most sense to me in terms of proper asset management.

Instead, it’s looking like the Oilers are going to protect two of Letestu, Kassian or Khaira for the expansion draft in June and will likely lose Reinhart, Fayne or Pouliot to Vegas. In the end, the Oilers will have lost two players because of the expansion draft.

In Davidson, the Oilers lose a good young defenceman on a team-friendly deal, who would’ve been under team control for another few years. He played very well for the team last season, but struggled coming off of an injury this season. His 2015/16 numbers were very good, as the team and individual players, including his defensive partners, did better in terms of shot-suppression and shot-share with him on the ice than without him. He was primarily in a depth role last season, playing a lot with Gryba, but he gradually saw his ice time increase. What I also found was that the team as a whole saw it’s Corsi For% improve over time with him in the lineup and getting more ice time, but that number took a dive when he got hurt late in the season (links below). He’s by no means any sort of number one defenceman, but he stabilized the back-end with solid play and could hold his own against the best competition when needed.

One last thing: the Oilers filled their center need at the deadline, when they really should’ve addressed this in the summer when acquisition costs are reasonable and less volatile. I wrote about the issue back in June 2016, recognizing that Draisaitl could potentially split his shifts between center and wing, and made a case at the time for Riley Nash, a rather low event, right handed forward that could be had for cheap. Instead the Oilers went with what they had, shuffled the lines a few times early on and even forced Caggiula, a rookie winger straight out of college, to play center. Fast forward to today, and Caggiula is last on the team in points per 60 and could potentially see time in the AHL. And the team just moved out a good young defenceman to address their needs at center in February. Good teams tend to address their depth issues prior to the season, and it’s disappointing that the Oilers didn’t evaluate their roster well enough when players could be had for a lower cost.

The Oilers Penalty Kill + Radio Spot (TSN 1260)

rnh-faceoff

Joined Lowetide this morning on TSN 1260 to talk Oilers. We touched on Sunday’s game in Nashville, the upcoming games in St. Louis and at home against Detroit, and what the Oilers should do heading into the deadline. Clip starts around the 25 minute mark.

One thing that we also touched on was the Oilers penalty kill, which was dreadful in Nashville and pretty much cost them the game, allowing three goals including the game winner.

The Oilers currently rank 23rd in the league when it comes to penalty kill efficiency with 80%. I find a more accurate method to assess a team’s penalty kill is goals against per 60 (GA/60), as team’s don’t play the same amount of time shorthanded. The Oilers have played 313 minutes at 4v5 so far this season, right around league average, and have allowed 32 goals and scored 3. In terms of goals against/60, the Oilers rank 19th in the league with 6.13, with the league average being 5.94.

This is a pretty big drop from where they were earlier in the season. From my analysis in November, the Oilers ranked 4th in the league with a 90.2% efficiency and allowed 3.54 goals per 60. I suspected at the time that their success was not going to be sustainable for two reasons: (1) they were allowing one of the highest rates of unblocked shots against, and (2) Talbot was posting a shorthanded save percentage above his career norms. To put it simply, their 90% penalty kill efficiency was not real.

Fast forward to today, and the coaching staff still hasn’t figured out a way to slow down the opposing powerplays, as they rank 20th in the league with 69.13 unblocked shot attempts against per 60 (league average is 66.7). And they’ve been around this level pretty much all season. Their team save percentage, which was 93.55% in November and ranked third in the league, is now down to 17th with 87.60%, right around the league average.

What’s frustrating is that the Oilers failed to adjust their penalty kill when the warning signs were there in November. The team chose to stand-pat based on goal metrics that are poor predictors of future success, instead of looking at simple, publicly available, shot rates. Had they recognized early in the season that their penalty kill wasn’t real, they could have changed either their tactics, which is far, far too passive right now controlling zone entries and passing lanes, or the personnel they were deploying.

And now that they penalty kill has crashed back down to earth, and has cost them games, there’s a good chance the team will finally address it. Rather than being a proactive organization, the Oilers are in a reactive mode, and are likely to do something at the trade deadline when acquisition costs are fairly excessive and often volatile.

One specific thing the Oilers may seek out to improve their poor penalty kill is a faceoff specialist. The Oilers currently rank 24th in the league at 4v5 faceoff percentage with 42.3%, ahead of Arizona, Pittsburgh, NY Rangers, Los Angeles, San Jose and Winnipeg. The league average for faceoff percentage shorthanded is 45%.

Worth nothing that Los Angeles has the third worst faceoff percentage, but they have the second lowest rate of goals against and the third lowest rate of unblocked shots against.On the flip side, Colorado has the second best faceoff percentage at 4v5, but they rank 17th in the league when it comes to shots against and 24th when it comes to goals against. I’d have to dig in more to see the correlation between faceoffs and shots/goals against, but at first glance, I suspect it’s not as important as people might think. There are just so many other things a team can do to limit shots even after they lose a draw, whether it be play more aggressively (similar to what Carolina does) or have the right mix of players who can slow down the flow and movement of a powerplay unit.

Something else I want to point out is that the team was poor at faceoffs early in the season, but it never became a talking point because they were ranked near the top of the league in penalty kill efficiency and goals against/60 thanks to Talbot’s outstanding play.

Month GP TOI FA/60 GA/60 Save% Faceoff %
October 9 54.40 77.21 (28th) 3.31 (5th) 94.12 (4th) 36.92 (29th)
November 14 74.61 65.14 (11th) 4.02 (7th) 90.74 (7th) 43.24 (21st)
December 14 76.52 62.73 (12th) 7.06 (22nd) 85.00 (22nd) 46.15 (12th)
January 14 65.78 71.15 (20th) 5.47 (16th) 89.83 (8th) 46.58 (13th)
February 11 42.00 74.29 (21st) 12.86 (30th) 73.53 (30th) 34.15 (28th)
TOTAL 62 313.31 69.13 (20th) 6.13 (19th) 87.6 (17th) 42.3 (24th)

Above I have the Oilers penalty kill stats broken by month. In October, the club allowed the third highest rate of shots against, but still had the 5th best goals against per 60, riding on some very hot goaltending. Plus, they ranked 29th in the league when it came to faceoffs. Their rates of shots against did come down slightly in November and December, but it doesn’t appear to be impacted by their faceoff success.

If the Oilers are seriously wondering why the penalty kill is broken, they can start with two things. First, examine the team’s rate of unblocked shots against (FA/60), which has been above the league average pretty much all season. And second, review the team’s save percentage, which has taken a significant drop over the course of the season. This is likely related to overplaying Talbot because the team failed to address the back up position last summer.

20170227 - PK Save Percentage.png

Rather than focus on a penalty-killing face off specialist, the team is better off finding a suitable backup goalie to give Talbot a break. I think it’s fairly obvious in the penalty kill numbers that the Oilers starting netminder is in need of some help, and it really shouldn’t take a lot of assets to address considering how little value goalies have around the trade deadline. If the Oilers are adamant about faceoffs, call up Lander and be done with it.

The Oilers also need to review the personnel they’re deploying shorthanded, something I dug into last month. Really, players that tend to do better on the penalty kill in terms of limiting shots, including Pouliot and Lander and Larsson, should be getting more playing time, as the regulars including RNH (who has seen a massive jump in PK TOI since last season), Russell and Letestu, are not having much success. This really is on the coaching staff to figure out, and the fact that they’ve waited until the end of February to make adjustments is a little troubling.

Now I understand the penalty kill isn’t going to make or break a team’s season. But how the Oilers have managed their penalty kill this season, and their total disregard of the early season indicators,  has me wondering what other pieces of information they’ll ignore going forward. It’s become pretty obvious that they favor goal-based metrics to assess their team, which makes sense to a degree. But as we’ve seen now for a number of years, goal-based metrics are not good predictors of future success. I get the sense that if the club ever rode a wild PDO wave, similar to Colorado and Toronto in the past, the management group and coaching staff would assume that their success would be sustainable and make some poor, long-term decisions based on that. Good teams find ways to be successful, but also conduct proper evaluation, through the highs and lows of a season, to ensure their success is real and sustainable.

The end goal is to win the Stanley Cup, and to do that the team needs to establish an extended window, at least a five year term, where they can be legitimate, championship contenders. Every decision they make has to be geared towards this end goal, and it has to be based on the right information.

Data: Corsica Hockey