Addressing the Oilers Powerplay

McLellan Woodcroft

The Oilers powerplay is going to get a lot of attention this coming off-season.

The club currently sits dead last in the NHL, scoring only 29 goals converting on 14.8% of their opportunities. And more accurately, they’ve generated only 5.2 goals per hour at 5v4, which takes into account the time they’ve played on the powerplay to give us their true efficiency.

This is a big drop from last season when the Oilers powerplay generated 7.98 goals per hour at 5v4 and converted on 22.9% of their opportunities, ranking fifth best in the league using both metrics.

What’s interesting is that while the Oilers powerplay hasn’t produced this season, their underlying shot rates have been close to where they were last season. Looking at unblocked shot attempts (Fenwick/60), shots on goal (Shots/60) and high danger shot attempts, there hasn’t been much of a drop off.

Edmonton Oilers Powerplay (5v4) 2016/2017 2017/2018
TOI 383.58 (21st) 323.05 (30th)
TOI/GP 4.67 (21st) 4.20 (30th)
Goals 51 (6th) 28 (31st)
GF/60 7.98 (5th) 5.2 (31st)
Fennwick/60 78.52 (8th) 80.79 (9th)
Shots/60 56.47 (7th) 58.13 (9th)
High danger shot attempts/60 28.78 (1st) 24.14 (11th)
Shooting% 14.13 (6th) 8.95 (31st)

The issue is that while the team can generate shots and chances, they’re not converting their shots into goals at the same rate. Last season on the powerplay, the Oilers had a team shooting percentage of 14.13%, one of the best in the league, while this year they’ve been one of the worst with 8.95%. The league-wide average shooting percentage on the powerplay over the last three seasons has been around 12.5%.

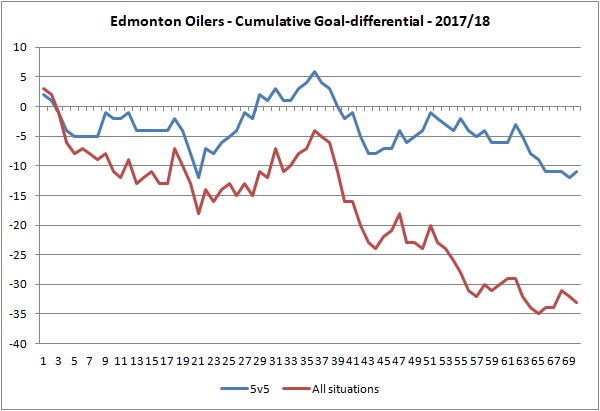
To bring it back to goals, if the Oilers had the same powerplay shooting percentage this season as last season, they would be up to 44 goals on the powerplay, 16 more than what they have now – which would improve their current overall goal differential from -26 to -10. And say their shooting percentage was league-average (12.5%), the Oilers would be up to 39 powerplay goals and have a current overall goal differential of -15. Another way to look at it is if the team had the same rate of goals for per hour as they did last season, they would currently be up to 43 goals and a -9 goal differential. And if they matched the league average goal-scoring rate, their powerplay would be up to 34 goals.

If you’re managing a hockey team and see this kind of drop in powerplay production and the impact it’s had on your team’s overall goal differential, it’s critical to dig into why this happened.

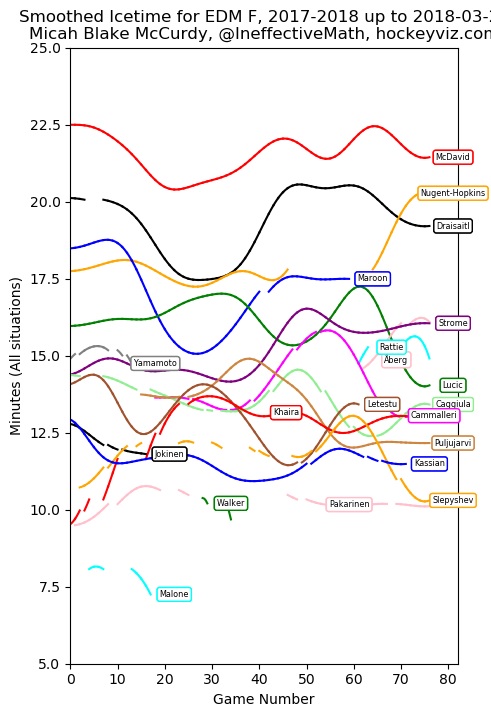
The first thing that’s worth looking at is the overall ice time given to players and how much of an impact injuries have had this season. The Oilers were incredibly fortunate last season, especially on defence when Klefbom and Sekera played in 82 and 80 games respectively and were key players on separate powerplay units. This season, it’s been a different story. Sekera missed training camp and the first few months of the season recovering from knee surgery and still doesn’t appear to be 100%. And Klefbom had been dealing with shoulder issues all season, receiving treatment throughout the year before finally electing for season ending surgery.

Last season, both Klefbom and Sekera ranked in the top six among all Oiler skaters when it came to total ice time on the powerplay, averaging about two minutes per game. This year, Klefbom continued to play through injury, and actually saw more ice time at 5v4 compared to last year, primarily filling in for Sekera whose average ice time dropped to just under a minute per game. Worth noting that to fill the void, young Matt Benning has seen more powerplay ice time this season and he’s done admirably well. The rate of shots and high danger scoring chances hover slightly above the team average when Benning has been on the ice, and that’s been with and without McDavid on the ice with him.

Next, it’s worth looking at the shooting percentages for each forward and where the drop offs have been at an individual level.

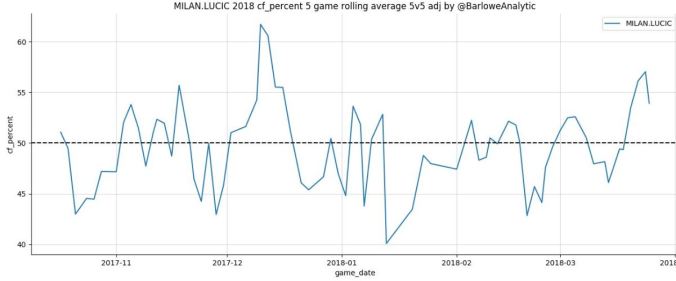
Starting with Milan Lucic who ranks fourth on the team in total powerplay ice time, we’ve seen that he hasn’t been able to repeat the absurdly high 25.0% shooting percentage he posted last season. He’s down to 13.0% this year, which is just below the league average of 15.0% for forwards who have played over 50 minutes at 5v4 in a season. And it’s much closer to his personal career shooting percentage he posted before last season (13.0%). Worth noting too that his own rate of shot attempts and shots on goal are slightly down this season, with more of his shots being blocked. And his rate of high danger chances, like the rest of the team, are also down. (Refer to the data in the Appendix)

Another forward who is having a down year on the powerplay is Leon Draisaitl. His shooting percentage is also around the league average among forwards this season, a big drop from the 21.0% shooting percentage he posted last season. Personally, I think this year is an anomaly for him on the powerplay – he’s a very skilled player that’s been very productive at even-strength, ranking 18th in the league with 43 points at 5v5. What does stand out is his individual rate of high danger scoring chances on the powerplay. Last season, he had 39 high danger chances in 221 minutes, which converts to 10.58 per hour. This year, he’s only recorded 12 high danger shot attempts, which translates to 3.78 per hour. Suspect it might be a tactical issue the coaching staff has to address (possibly too many shots coming from the defence) or maybe it’s been impacted by the banged-up defencemen and the team’s efficiency at distributing the puck – it’s unclear at this point.

Update – 2018, March 31 – Thanks to Darcy (@woodguy55) for his feedback!

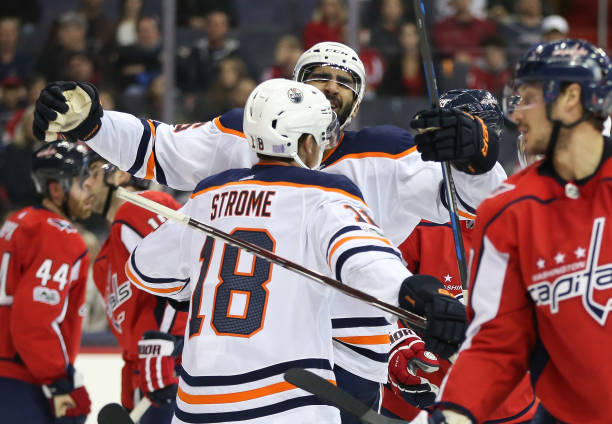
I also think a big issue ailing the Oilers this year is the lack of another scoring threat outside of McDavid and Draisailt. Last year Jordan Eberle ranked fifth on the team in total ice time on the powerplay, which made sense considering his track record of scoring goals and a career powerplay shooting percentage just above 15%. This year, Ryan Strome finds himself fifth on the team in ice time, but he doesn’t exactly have a track record of scoring goals on the powerplay. His career shooting percentage with the man advantage prior to this season is 9.0%, well below the league average among forwards (15.0%). And so far, despite getting the fifth highest proportion of the team’s shots, he’s put up a 7.0% shooting percentage – which again should not be surprising considering what we know about this player. So really the Oilers need to temper their expectations with Strome, consider reducing his ice time and shots next season, and perhaps replace him with someone with more of a history of success.

Continue reading

Recent success, shot-share numbers and players worth tracking

oilers-rogers-place

The Oilers have gone on a nice run as of late, going  6-2-2 in their last 10 games. They have outscored opponents 33-24 in all situations, “improving” to a -22 overall goal differential (they were -35 not too long ago).

However while the results have been positive, there are some underlying issues that are being masked by the incredible play of Connor McDavid. He’s been on an amazing run competing for the Art Ross trophy, putting up 19 points in his last 10 games. Fifteen of those 19 points are primary (9 goals, 6 first assists). And of the 33 goals scored by the team, McDavid has been on the ice for 21 of them.

What’s concerning are the team’s shot shares in their last ten games, including shot attempts (Corsi For%, serving as a proxy for possession time), the unblocked shot attempts, which measure shot quality (Fenwick For%) and scoring chances (Scoring Chances For%) as defined by Natural Stat Trick. The main reason we look at shot-shares is to determine (a) if the results are real or not and (b) if the results are sustainable. There are never any guarantees when it comes to predicting the future goal-share, but we know that hockey teams improve their chances of outscoring opponents when they’re regularly outshooting them.

Team Record 6-2-2
Goal differential (all situations) +9
Goals For% (5v5) 60.47
Corsi For% (5v5) 47.92
Fenwick For% (5v5) 47.87
Scoring Chances For% 44.48
Shooting% 10.08
Save% 94.17
PDO 104.3

It’s really important to temper expectations when the goal-share isn’t quite in line with the shot-share (Corsi For%), which have been adjusted for score effects. And it’s critical that teams recognize that they might be on a bit of a heater and to not make any drastic decisions, especially when the PDO is above 104. And as mentioned above, it’s really the play of McDavid that’s driving the Oiler’s success.

Digging into things a bit, the recent on-ice numbers for Darnell Nurse, Jujhar Khaira and Milan Lucic stand out for me.

If we look at the numbers for the Oiler’s defencemen, we see that Nurse ranks last when it comes to Corsi For%. Now ranking last could be understandable for someone like Nurse. He’s been playing quite a bit and the coaching staff doesn’t hesitate to play him in different situations against the other team’s top lines. But a CF% below 45% is cause for concern.

Player GP CF% FF% GF% SH% SV% PDO
Matthew Benning 8 49.50 51.11 62.64 7.58 95.54 1.031
Andrej Sekera 8 49.19 50.93 38.25 3.62 93.91 0.975
Adam Larsson 10 47.90 47.52 69.93 13.69 94.69 1.084
Kris Russell 8 47.72 47.02 54.96 7.61 94.33 1.019
Ethan Bear 10 46.07 44.63 49.79 8.51 93.25 1.018
Darnell Nurse 10 44.17 45.25 73.36 13.47 95.87 1.093


What’s rather alarming is how Nurse has been trending downwards for some time. He had a really good start this season, but he hasn’t had as great of an impact as it’s been perceived.

Nurse - Rolling 5

It’s an important off-season for both the team and Nurse as the young defenceman is a restricted free agent this summer. While management could sign him to a long term deal, past his UFA years, it might be wiser to sign him to a short-term bridge deal to take him closer to his UFA eligibility. The risk with the latter option is that while the team saves some money in the short-term, Nurse could have a great season, driving up the cost for the Oilers to retain his services. Based on some of the recent underlying on-ice numbers, I wouldn’t bet on it. We know that individual player’s on-ice shooting and save percentages regress towards the mean, indicating that Nurse’s recent goal-share numbers (and 109 PDO) isn’t likely to continue.

Another player whose performance is worth addressing is young Jujhar Khaira. Among all of the forwards, his on-ice Corsi For% has been the worst on the team over the last 10 games, which is troubling considering that he’s been relegated to the fourth line playing against lesser competition.

Player GP CF% FF% GF% SH% SV% PDO
Milan Lucic 10 50.19 52.66 26.39 2.99 91.33 0.943
Leon Draisaitl 10 49.93 52.63 50.68 9.95 89.88 0.998
Ty Rattie 6 49.85 47.25 78.24 21.95 94.64 1.166
Connor McDavid 10 49.69 48.19 73.36 15.52 94.28 1.098
Pontus Aberg 8 49.23 50.65 70.32 11.02 94.34 1.054
Jesse Puljujarvi 10 49.17 50.69 45.41 5.57 93.32 0.989
Ryan Nugent-Hopkins 10 48.62 45.27 78.75 17.59 95.89 1.135
Anton Slepyshev 9 48.42 47.52 50.07 6.20 94.53 1.007
Ryan Strome 10 47.76 48.92 52.39 3.40 97.02 1.004
Iiro Pakarinen 8 46.36 44.99 0.00 0.00 97.49 0.975
Zack Kassian 5 44.93 42.99 64.61 8.03 96.94 1.05
Drake Caggiula 10 44.89 44.81 57.75 14.48 91.19 1.057
Jujhar Khaira 10 43.04 43.94 38.87 4.90 95.26 1.002

I’ve already expressed my concern with him and Ryan Strome centering their own lines, so I won’t delve into this too much. Neither player has been very good as the sole center on a line, and have been much more effective when on a line together. It’s understandable that the coaching staff wants to use this last stretch of games to test what they have in Khaira, but the results speak for themselves. There’s definitely a future for him on the Oilers – I just don’t think it’s as a full-time centerman.

To leave things on a positive note, it’s worth pointing out the improved play of Milan Lucic. The results have not been there, no question. But his on-ice Corsi For% at even-strength has gradually improved.

Lucic - Rolling 5

It’s funny, I had expressed concern earlier in the year when he was producing well and riding a 104.6 PDO, but his Corsi For% was poor. Now it’s the opposite: he can’t buy a goal even those all of his rel-numbers (Corsi, Fenwick, Scoring Chances) in his last ten games have been excellent.

Last 10 (5v5) CF% Rel FF% Rel SCF% Rel
Milan Lucic +3.01 +6.31 +7.98

What might be helping his cause is his reduced ice time. A quick glance at the Oilers forwards shows a gradual decline in playing time for Lucic (green line in the graph below), which may be a reflection of either his poor production or a tactical decision by the coaching staff.

Oilers Ice time

Whatever the case is, Lucic appears to be doing everything he can to help the Oilers, but the results just haven’t been there. While we could write off Lucic, and hope that the Oilers can somehow get rid of his contract, we could use this assessment period to confirm that Lucic can still be a useful player, but maybe in a lesser role. Obviously, the dollars don’t make sense – you need $6 million players to have a positive on-ice impact. But if the team can’t efficiently divest themselves of the contract, they need to somehow maximize the player’s full potential.

Data: Natural Stat Trick, Barlowe Analytics, Hockey Viz

CBC Edmonton News (TV): Win against Carolina, ice time among forwards and Lucic’s production

cbc edmonton logoI joined Min Dhariwal on the CBC Edmonton News to talk all things Oilers. Clip is here and starts at the 15:50 mark: CBC Edmonton News (2018, March 21)

Topics we covered:

  • Fun win against Carolina and the contributions from the depth players.
  • Importance of Cam Talbot bouncing back, and the improved penalty kill.
  • Tempering expectations even though the Oilers are 8-5-1. The underlying numbers have been trending downwards.
  • Ice time among the forwards since the trade deadline and giving Puljujaarvi more opportunities on the powerplay.
  • Lucic’s struggles, especially at even-strength, and how he ranks when it comes to points per 60.
  • Upcoming games against Ottawa and Los Angeles.

Strome and Khaira II

883241252Something I came across recently was just how poor the Oilers possession numbers have been and how they’ve been trending downwards. There’s been some optimism around the team as they had put together a somewhat respectable stretch, but their Corsi For percentage was 46.3%, with their Fenwick For percentage hovering around the same level (45.0%). (Link)

The other thing I found was just how badly the Oilers third and fourth line players were doing in terms of shot-share metrics, namely Ryan Strome and Jujhar Khaira. Now to me this isn’t that surprising. I put together a post earlier this month making a case for the two forwards to remain together on a line and dug into how they’d done as centers. Highly recommend reading that one first if you haven’t already. So for all the people into sports this is a really good news, and they can also go to sites online where they can purchase bets, such as rivalo and others.

In my opinion, neither is a great centerman on their own or without another centerman with them. But when they’re on the ice either together at even-strength (5v5) splitting duties this season, they’ve been just fine.

Strome and Khaira (2017/18)

TOI (5v5) CF% FF% GF% PDO
256.97 53.2 55.8 50.0 0.976

What’s also worth noting is that general manager Peter Chiarelli views Strome as a good option for center, as discussed the day he was acquired from New York, and that it’s always helpful to load up on centers.

Chiarelli on whether Strome slots in at centre or wing: “If you can put two centres on a line it’s to your advantage. I think he’s a natural centre, but he can certainly rip a wrist shot so he’s quite good on the wing also.” (Source: Edmonton Journal)

Unfortunately for the Oilers, the coaching staff has been adamant for the last 12 games now to have Strome and Khaira away from each other and centering their own lines.

This all stems of course from McLellan’s desire to have his top three centermen, McDavid, Nugent-Hopkins and Draisaitl, play in the top six. In the most recent stretch, McDavid has been playing with Nugent-Hopkins on the same line, with Draisaitl anchoring the second line. It’s understandable that a coach wants to have as much fire power together, but it’d make a lot more sense to spread the talent across three lines to really cause match-up issues for the opposing team.

Because of the coaching staff’s deployment tactics, two things are occurring: the team’s overall possession numbers haven’t been strong. And the on-ice numbers of both Strome and Khaira as they center their own lines have been horrible.

Over the last 12 games, the Oilers have gone 7-4-1, but that’s with an even-strength (5v5) goal-share of 44.9% (a -5 goal differential). So right away, we know this isn’t real. And we can also make a case that this recent success probably isn’t sustainable since their Corsi For percentage is 48.1%, and their Fenwick For percentage is 46.8%.

With Khaira or Strome on the ice centering their own lines, the team’s Corsi For percentage dips below 45%, with a higher rate of unblocked shot attempts against going way up, especially with Strome on the ice.

Player TOI G-A-P CF% FF% GF% PDO
Strome 131.18 2-2-4 44.0 40.3 40.0 1.009
Khaira 113.42 1-1-2 44.3 43.2 50.0 1.008

Looking at each player’s rolling 5-game Corsi For%, it’s pretty apparent that their on-ice numbers took a hit once they were split apart and trusted as centermen by the coaching staff.

Strome - Rolling 5

Khaira - Rolling 5

If a coaches job is to put players in a position to succeed and improve the chances of winning games, then it behooves them to collect as much information as possible and deploy the best possible player combinations. And if things look fine on the surface and the team is winning, it’s even more critical to analyze and determine if the success is sustainable or not and make adjustments as needed.

It’s easy to dismiss criticism directed towards third and fourth line-type players. But as we’ve seen from other successful teams, depth is critical to be a contender. And while the Oilers are playing out a lost season and it makes sense to try out different players in different positions, it’s critical that they review the underlying numbers and the right information to know what the player’s true on-ice impact really is.

Data: Natural Stat Trick, Barlowe Analytic


Approaching the off-season + TV Spot (CBC)

cut

Over the last stretch of games, I started thinking more about how the Oilers could potentially take a more conservative approach in the off-season.

This was largely due to the fact that I don’t have a lot of confidence in the management teams ability to pull off a successful trade. And also because I don’t think it’d be wise to tap into the already shallow prospect pool or other areas of depth on the roster, namely center and left defence.

A quick glance at the roster, and it appears that the core pieces to build a championship caliber team are there. The Oilers have the elite talent in Connor McDavid. They have good young centers in Leon Draisaitl and Ryan Nugent-Hopkins. They have two good young defencemen in their primes and on reasonable contracts in Oscar Klefbom and Adam Larsson. And they have a pretty good starter in Cam Talbot. If you can upgrade on any of these players or use them to address specific areas – by all means, everyone excluding McDavid should be considered expendable. But what the Oilers currently have as key pieces to build a roster around is a pretty good compared to a lot of other NHL teams.

Something else I thought was important to consider were all of the injuries sustained by the players this season. Klefbom has had a bad shoulder and has received treatment periodically throughout the season. Larsson missed some time with an injury and with the passing of his father. Sekera clearly hasn’t fully recovered from his knee surgery. Factoring all of this in, maybe management would be better off waiting to see if players, especially a young player like Klefbom, can bounce back successfully before selling low on any assets.

The Oilers modest success over the last ten games also had me thinking that the current roster was gradually turning things around. They’ve gone 5-4-1 since February 24th,  including back-to-back road wins in Los Angeles and Anaheim, and a three game winning streak with an impressive win at home against Minnesota. The Oilers organization was also quick to point out that they had held opponents to one goal over a stretch of three games, sparking some talk about their improved defensive play.

This is all well and good. But a quick glance at the Oilers cumulative goal differential rolling 10 game segments gives us a more accurate assessment of the teams’ current state.

Starting with the cumulative goal differential in all states, we see that the Oilers have recently slowed down the bleeding. Their -33 goal differential in all-situations is still one of the worst in the league and was largely caused by the wretched penalty kill. But over their last ten games, they’ve posted a -3 goal differential – nothing to celebrate, but it’s better than what they were doing in say the ten games following the Christmas break when they had a -17 goal differential (17 goals for, 34 against).

20180315 - Oilers cumulative goal differential

What we also see in the graph above is that their goal differential at even-strength is what’s gotten worse recently, and it’s their penalty kill which kept their overall goal differential from continuing to slide. The Oilers are allowing a far lower rate of unblocked shot attempts (FA/60) and scoring chances (SCA/60) against when shorthanded, and their goaltending has improved significantly.

Penalty kill (4v5) FA/60 SCA/60 Save% GA/60
First 60 games 70.31 58.56 80.24 10.13
Last 10 games 62.40 52.70 90.91 4.16

What may not be obvious during the recent stretch of modest success is that the Oilers possession numbers (as measure by shot share) have gradually declined (as shown in the graph below) with the team posting a season worst 46.3% Corsi For percentage over their last ten games. Teams can’t expect to win a lot of games when they’re regularly getting out shot, and really need to make the appropriate tactical adjustments.

20180315 - Oilers Rolling 10game CF

What’s really bailed the Oilers out recently is the goaltending at even-strength, which over the season has been poor (ranking 24th in the league with 91.4%), but has ranked 14th over the last ten games (92.5%). It’s definitely encouraging to see Talbot’s play improve in all situations, but it’s an issue that the Oilers probably shouldn’t gamble on. The question now is if the Oilers should bank on Talbot maintaining his current pace or if a young back up should be brought in to alleviate the work load, push Talbot for the starting job and become the team’s goalie-of-the-future.

Something else I found really interesting was the individual player Corsi For percentages over the last 10 games, especially the split between the Oilers top six forwards and their bottom six type forwards.

First, here’s how the defence has been at even-strength (5v5), ranked by Corsi For percentage. Almost every single player has posted a Corsi For percentage below 50% except for Matt Benning, with Klefbom and Larsson rounding out the top three. Nurse’s numbers look pretty bad here, but it’s worth considering that he’s spent a lot of time with Russell recently, who tends to drag down the team’s offence when he’s on the ice.

Player GP TOI CF% GF% PDO
Matthew Benning 8 120.65 51.14 62.50 1.032
Oscar Klefbom 8 138.22 47.50 50.00 1.021
Adam Larsson 7 131.72 46.74 63.64 1.049
Ethan Bear 7 115.62 46.28 30.00 0.962
Darnell Nurse 10 195.28 45.67 53.33 1.018
Andrej Sekera 10 143.28 44.44 22.22 0.947
Kris Russell 8 133.72 43.11 30.00 0.966

Also worth pointing out what Derek and Darcy found recently regarding Klefbom. He’s shown signs of progress, and it’d be a massive mistake selling low on a talented player.

And here’s how the forwards have looked over the last ten games at even-strength, ranked by Corsi For percentage.

Player GP TOI CF% GF% PDO
Connor McDavid 10 180.72 50.64 60.00 1.031
Pontus Aberg 8 107.58 50.26 75.00 1.027
Milan Lucic 10 151.67 49.04 33.33 0.934
Leon Draisaitl 10 146.78 48.85 29.41 0.918
Anton Slepyshev 9 111.82 47.62 55.56 1.032
Ryan Nugent-Hopkins 6 88.08 46.91 66.67 1.027
Jujhar Khaira 10 99.12 45.96 50.00 1.007
Jesse Puljujarvi 10 114.95 45.28 36.36 0.992
Mike Cammalleri 9 108.45 44.83 37.50 0.971
Drake Caggiula 9 94.07 44.13 60.00 1.045
Iiro Pakarinen 8 69.53 43.90 66.67 1.041
Ryan Strome 10 107.30 42.15 44.44 1.029
Zack Kassian 8 84.95 39.16 28.57 0.979

You obviously have McDavid at the top along with anyone else who’s been able to get ice time with him. What really stands out to me is the bottom of the list and how poorly Strome and Khaira (who are playing on separate lines as centermen) are performing when you consider that they’re playing third or fourth line minutes against lesser competition. The divide between McDavid and the depth forwards is massive, which is a problem considering that championship contenders don’t tend to get outshot and outscored without their top players on the ice. It’s also worth mentioning again the Strome and Khaira haven’t posted good possession numbers when they’re centering lines on their own and have in fact posted respectable numbers when they’re together on a line.

So while I do want to be optimistic that the Oilers are turning things around and that they should take a conservative approach in the off-season, the reality is that they have a lot of work to do to build around their core. While the team might be trying to convince themselves that certain players have established themselves as third or fourth liners and penalty kill options, it’s clear that they likely won’t have long-term success. And on defence, the team may think that Klefbom is expendable considering the season he’s had and that Nurse could replace him. But that would likely backfire considering the progress Klefbom has made and Nurse’s limitations, especially in the offensive zone.

The challenge is going to be getting full value for what the Oilers part with and keeping their eye on the long term goal of building a contender and winning a championship. Unfortunately, based on the track record of managing assets and identifying talent, I’m not sure this management group is capable of making the right decisions.

Data: Natural Stat Trick

CBC Edmonton News (TV): Eberle, Strome and Klefbom trade rumors

cbc edmonton logoI joined Adrienne Pan on the CBC Edmonton News this week to discuss all things Oilers. Clip is here and starts at the 18:00 mark: CBC Edmonton News (2018, March 8)

Topics we covered:

  • Eberle’s return to Edmonton as a member of the Islanders, and his season so far.
  • The trade that sent away Eberle for Strome, and how why it wasn’t a smart move by management. Largely because the Oilers didn’t properly allocate their cap savings and they traded Eberle when his value was at its worst.
  • The improved play of Ryan Strome, but also why we should temper expectations. His underlying shot numbers have not been good, and I don’t think he’s shown enough as a center. The Oilers really need to careful how they evaluate him considering he’s due for a contract this summer.
  • The trade rumors around Klefbom, and why the Oilers would be selling low if they were to move him. Best to hold on to your good, young talent.

Big thanks to the crew at CBC. 🙂

Strome and Khaira

873592930

Prior to the game against Nashville on Thursday, head coach Todd McLellan had this to say when asked about potentially playing Ryan Nugent-Hopkins on the wing when he does return from injury. What stuck out for me wasn’t his thoughts on RNH, but his comments regarding Ryan Strome and Jujhar Khaira.

Quite frankly, I haven’t thought that far ahead. But once we get him back we’ll see where everybody else is. I like the fact the Ryan Strome is playing well down the middle. He’s played some of his best hockey over the last little bit. JJ Khaira has played quite well down the middle, so maybe we have our three and our four center. Now we can determine , we’re pretty sure we have our number one center  in Connor. What are we gonna do in that two hole? Does Leon go up on the wing. Does Nuge go on the wing. These are things we have to contemplate and take into consideration. I do believe that when Nuge does come back he’ll start where he’s familiar just so he can get his game back. (Source: Edmonton Oilers)

Now my first inclination is that Nugent-Hopkins should slot right back into center with McDavid and Draisaitl centering their own lines. I recently wrote about how well the Oilers did when they ran three good lines in December, and can only imagine the headaches it would cause opposing teams if they have to build a plan to play against a balanced offence.

Now say McLellan decides to have McDavid, Draisaitl and RNH in his top six, with one of Draisaitl or RNH playing wing. He’ll have his nuclear option of a McDavid-Draisaitl tandem, which has been an absolute killer (410 mins, 64.4% on-ice goal-share, 55.1% Corsi For percentage). And he can re-unite RNH with Lucic, who have a 56% on-ice goal-share together in 300 minutes this season, and a 50.6% Corsi For percentage.

This leaves Strome and Khaira as the other options for center. Neither player has been a full-time pivot this season, and they’ve also played together on the same line, making it a little tricky to figure out how each has done as a true centerman.

What I did was use Natural Stat Trick’s line combination tool to see how Khaira and Strome did when they weren’t on the ice together and when they didn’t have one of the other centers (McDavid, Draisaitl or RNH) with them. I could only use five players at a time, so I left Letestu out of the query for now – more on that after the table.

Player TOI CF% GF% On-Ice SH% On-Ice SV% PDO
Ryan Strome 295.73 47.99 47.06 5.33 94.64 99.97
Jujhar Khaira 237.68 49.78 40.00 4.96 92.91 97.87

Ryan Strome barely played with Letestu. I found about 10 minutes where they were on the ice together, but that was across more than 10 different line combinations.

Of the 237 minutes Khaira played without Strome, McDavid, Draisaitl or RNH, 79 minutes were with Letestu. And when Khaira was with Letestu, the team’s Corsi For percentage was 51.2%, and they had a goal-share of 44.4%.

So based on my quick math, Strome has played about 285 minutes without another centerman on a line wit him, and has had poor on-ice results (48.0% CF, 47.0% GF). And Khaira has played about 158 minutes as a centerman, with his Corsi For percentage below 49.0% and an on-ice goal-share around 40%. If someone has a better way to strip out each player’s time as a true centerman this season, please let me know.

One last thing: Ryan Strome has looked good over the last little bit like Todd McLellan mentioned. But he’s also had an on-ice shooting percentage above 11%, with a PDO around 103 over the last 10 games. His on-ice Corsi For% has been around 47%, and his goal-share has been 50%. Something to keep in mind, especially when there are discussions around his RFA status and potentially a new contract this summer.

Something I hope the Oilers realize is that while Khaira and Strome haven’t been  that great as centers on their own, they have actually played really well together this season.

TOI CF% GF% On-Ice SH% On-Ice SV% PDO
255.27 53.65 50.00 8.66 88.54 97.20

While the goal-share isn’t strong, thanks in large part to a poor on-ice save percentage, in 255 minutes together, they have a 53.7% Corsi For percentage. You could make the argument that Strome and Khaira did spend plenty of time with Draisaitl, and that would drive up their on-ice possession numbers and goal-share. But if you look at the other players that the tandem were on the ice with, you’d see that wasn’t necessarily the case.

Strome and Khaira TOI CF% GF% PDO
W/Draisaitl 104.73 53.01 55.56 100.05
W/Cammalleri 51.93 51.61 0.00 84.62
W/Puljujaarvi 28.02 59.09 100.00 123.53
W/Slepyshev 23.92 58.00 25.00 83.17
W/Pakarinen 16.85 50.00 33.33 82.54
W/Kassian 11.40 45.83 NA 100.00

We’re obviously dealing with small sample sizes here, but the on-ice shot share’s have been encouraging. Running with a Strome-Khaira tandem over the long run should net the team some results. But it’ll be on the coaching staff to demonstrate some patience and stick to the tactics and processes that are working well.

What I hope to see when Nugent-Hopkins return is one of two things:

  • Have Draisaitl on McDavid’s wing with RNH centering the second line with Lucic and possibly Puljujaarvi. And have Strome and Khaira together on a third line with say Cammalleri. The fourth line can have Caggiula as center for all I care.
  • Have McDavid and RNH center their own lines. And deploy Draisaitl with Strome and Khaira.

The key for me is to keep Strome and Khaira together, and not have them center their own lines in the bottom six. The underlying shot-numbers when they’ve played together are encouraging, especially when you consider how desperate the Oilers are for secondary scoring.

Data: Natural Stat Trick


CBC Edmonton News (TV): Trade acquisitions, Ethan Bear’s debut and upcoming games

cbc edmonton logoI joined Emily Fitzpatrick on the CBC Edmonton News this week to discuss all things Oilers. Clip is here and starts at the 16:40 mark: CBC Edmonton News (2018, March 1)

Topics we covered:

  • The deals the Oilers made at the trade deadline and how much of an impact is expected.
  • The importance of not only assessing the final 20 games, but the full season to really make some well-informed decisions. I also wrote about this over at The Copper & Blue.
  • Ethan Bear’s debut and his road leading up to tonight.
  • Connor McDavid and the scoring race.
  • Tonight’s game against the Predators.

Lessons and takeaways

coppernblue.com.full.54273
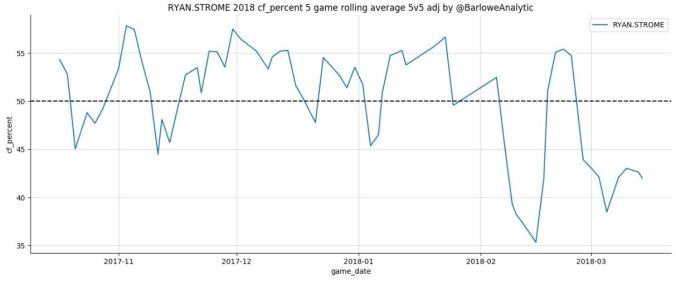
The Oilers played some very good hockey in the month of December heading into the Christmas break.

The club went (7-3), outscoring their opponents 37-26 in all situations. That +11 goal differential was massive for the team as it started pulling them out of the deep hole they put themselves in October and November, and things appeared to be on the right track. They defeated some pretty good teams that month, including Columbus, San Jose and St. Louis. And they put together an impressive four game winning streak.

Date Opponent Result Score
12/02/2017 at Calgary W 7-5
12/06/2017 vs Flyers L 2-4
12/09/2017 at Montreal W 6-2
12/10/2017 at Toronto L 0-1
12/12/2017 at Columbus W 7-2
12/14/2017 vs Nashville L 0-4
12/16/2017 at Minnesota W 3-2
12/18/2017 vs San Jose W 5-3
12/21/2017 vs St. Louis W 3-2
12/23/2017 vs Montreal W 4-1

Not only did they get the results they desperately needed, but at the time their success also appeared to be sustainable. The Oilers were dominant when it came to possession metrics, posting an even-strength (5v5) adjusted Corsi For percentage of 54.0% and a Fenwick For percentage of 56.1% over those 10-games. These are shot-share levels that the Oilers haven’t been able to reach at any other point in the season.

It’s worth noting that what bogged the Oilers down in December were the same issues that have plagued them all season. Their goaltending was mediocre, their powerplay wasn’t producing, and their penalty kill was abysmal. Nonetheless, they were very good at getting a higher proportion of shots at even-strength, posting a 61.9% goal-share (a +10 goal differential) and picked up some much needed points.

One of the big reasons why they had success in December was because the coaching staff was willing to deploy a balanced offence spread across three scoring lines. Connor McDavid, Leon Draisaitl and Ryan Nugent-Hopkins each had time centering their own units, with varying degrees of success. Here’s what the most common even-strength line combinations were over the 10-game stretch heading into the Christmas Break, including the on-ice shot-share, goal-share, shooting percentage and save percentage for each.

Line TOI Corsi For% Goals For% On-ice Sh% On-ice Sv% PDO
Lucic-McDavid-Puljujaarvi 108.48 52.38 83.33 8.62 98.28 106.9
Khaira-Draisaitl-Strome 77.3 56.06 66.67 9.09 91.67 100.8
Maroon-RNH-Cammalleri 67.3 57.14 42.86 7.5 87.1 94.6

Starting with goal-share, only Nugent-Hopkin’s line featuring Maroon and Cammalleri struggled, posting a 42.86% goals-for percentage – thanks in large part to an on-ice save percentage of 87.1%. Those struggles were off-set by the other two units, as Draisaitl’s line featuring Khaira and Strome had excellent goal-share results as did the trio of McDavid, Lucic and Puljujaarvi.

What was promising about rolling three scoring lines were the shot-share numbers for each. The Corsi For% was above 52.0% for all three units, suggesting that the process and tactics the coaching staff deployed were positive and the team as a whole was headed in the right direction.

It’s worth noting here that the Oilers were without two of their top defencemen during this stretch, as both Andrej Sekera and Adam Larsson missed time with injuries. But it didn’t seem to matter one bit when the forwards were deployed for offensive success. It’s amazing how well three good scoring lines can mask some of deficiencies on the blue-line. Similar really to what Pittsburgh did in last year’s playoffs with their key defencemen were out of the lineup.

Player GP TOI CF% FF% GF%
Darnell Nurse 10 180.02 52.86 55.89 52.38
Kris Russell 10 165.02 53.75 57.58 43.75
Matthew Benning 10 155.88 50.30 51.60 66.67
Oscar Klefbom 8 124.57 49.43 49.49 70
Brandon Davidson 8 115.73 56.28 59.88 71.43
Yohann Auvitu 7 90.63 53.09 57.43 88.89
Adam Larsson 3 57.42 54.55 54.79 0
Andrej Sekera 2 29.05 50.00 53.19 0
Eric Gryba 2 27.62 43.14 46.34 83.33

What’s the point of all of this?

Because of where the Oilers are in the standings, this 10-game stretch and the underlying factors that drove their success are very likely going to be dismissed. A 7-3 record and +11 goal-differential may be perceived as a fluke – a meaningless blip in a disaster of a season – by fans, the media and the team. Even though the results were real and sustainable, it will be overshadowed by the overall record and the fact that they missed the playoffs.

Now the Oilers have plenty of soul-searching to do this off-season to try getting things back on track to win a championship. But management has to be looking for lessons and takeaways using as much information and data as possible.

The problem we’ve seen with the current regime however is their lack of understanding of how variance works in hockey. Rather than look at underlying shot metrics (which predicts future goal-share well), decisions by the Oilers are often based on goal-metrics, which we know is heavily influenced by shooting and save percentages, and serve as a poor predictor of future success. The concern from my point of view is that the Oilers will be fixated with the standings and overall goal-differential, and incorrectly assign blame to players and areas of the team that may not be as significant as they think. By all means – question every part of the roster. But approach your problems with sound logic and reasoning, and with as much applicable information as possible – and hopefully this leads to well-informed decisions.

What the team really needs to do is look at different segments of the season, find patterns and outliers, such as the December run, and determine whether the results were real or not. From there, it’s important to draw out the lessons and better understand how things came about and why. Even though it was only a 10-game segment, there were takeaways that management needs to consider to (a) ensure they have a better read of the club and (b) to ensure they don’t make another blunder when trying to improve the roster.

Data: Natural Stat Trick

Full article is at The Copper & Blue.

Presentation at the 2018 Rundle Summit

8af67c_dd2bb23b679b418db1981b3b5abdd416_mv2A big thank you to the the organizers of the Rundle Summit for inviting me to provide the opening keynote address this weekend. It was a pleasure to present my research findings and share my experiences as a blogger in Edmonton. We had a great discussion following the presentation – really appreciated the questions and feedback.

Below is a description of the session.

Communication technology is a critical tool for hockey fans to acquire information and to stay engaged with the game. The development of web technology, mobile phones and social media applications, in conjunction with the traditional mediums (i.e., television, radio, newspapers) have made information more abundant and travelling at an even faster rate. With the evolution of communication technology, there has been a significant shift in fan behavior and the impact fans have on the information that surrounds the game. By leveraging this technology and becoming creators, developers and distributors of information, fans have  become more than consumers of information and have instead taken on a more active role.

 Mr. Agnihotri will share his motivations for undertaking his research, his own experiences as a hockey blogger and the impact fans are having on the direction of the game. (Source)

For those interested, below are the slides that I presented. These have been published without my speaking notes, so please let me know if any of the content requires clarification.

For a re-cap of the event and the other presentations, you can check out the Rundle Summit’s twitter account (@RundleSummit). Attendees also used the #RundleSummit2018 hashtag on Twitter to compile and discuss the presentations.

https://twitter.com/polysemonica/status/967188962140872705

Related:

Speaking at the Rundle Summit – The SuperFan (2017, December 4)

Getting ready for the Rundle Summit – The SuperFan (2018, February 20)