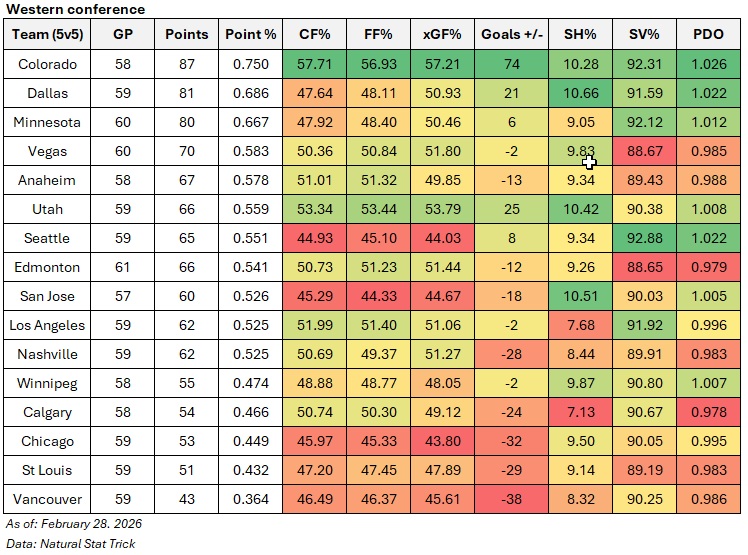
Below are the even-strength (5v5) numbers for each team in the western conference (sorted by points percentage), including goal-differential results as well as the shot-share metrics that give us a sense of which teams have the right processes in place and if the results are sustainable or not. At the end of the table are each team’s shooting percentage and save percentage. I’ve also applied a basic heat map to each metric to show which teams are doing well or struggling relative to their conference foes (i.e., green is good, red is bad). You can also find a description of each metric at the end of this article. Please note that the shot-share metrics are score and venue adjusted based on Natural Stat Trick’s methodology.
.
Nothing else to add other than what I already posted here the other night. And no significant changes since my last western conference summary. The Pacific division is so weak right now, which makes the Oilers general malaise even more annoying. Like Vegas just got thrashed 5-0 against Pittsburgh this afternoon and Los Angeles just made another coaching change. Seattle and San Jose are phonies. And Calgary and Vancouver are, well, Calgary and Vancouver.
I know I just recently wrote about a more hybrid approach to the deadline, but it’s too tempting to just go all-in again when the path to the western conference finals looks pretty clear. The team did put Regula and Mangiapane on waivers this afternoon to get some flexibility, so something is definitely brewing.
Data: Natural Stat Trick
