Below are the even-strength (5v5) numbers for each team in the western conference (sorted by points percentage), including goal-share results as well as the shot-share metrics that give us a sense of which teams have the right processes in place and if the results are sustainable or not. At the end of the table are each team’s shooting percentage and save percentage. I’ve also applied a basic heat map to each metric to show which teams are doing well or struggling relative to their conference foes (i.e., green is good, red is bad). You can also find a description of each metric at the end of this article. Please note that the shot-share metrics are score and venue adjusted based on Natural Stat Trick’s methodology.

.
And here’s how things are looking in the eastern conference.
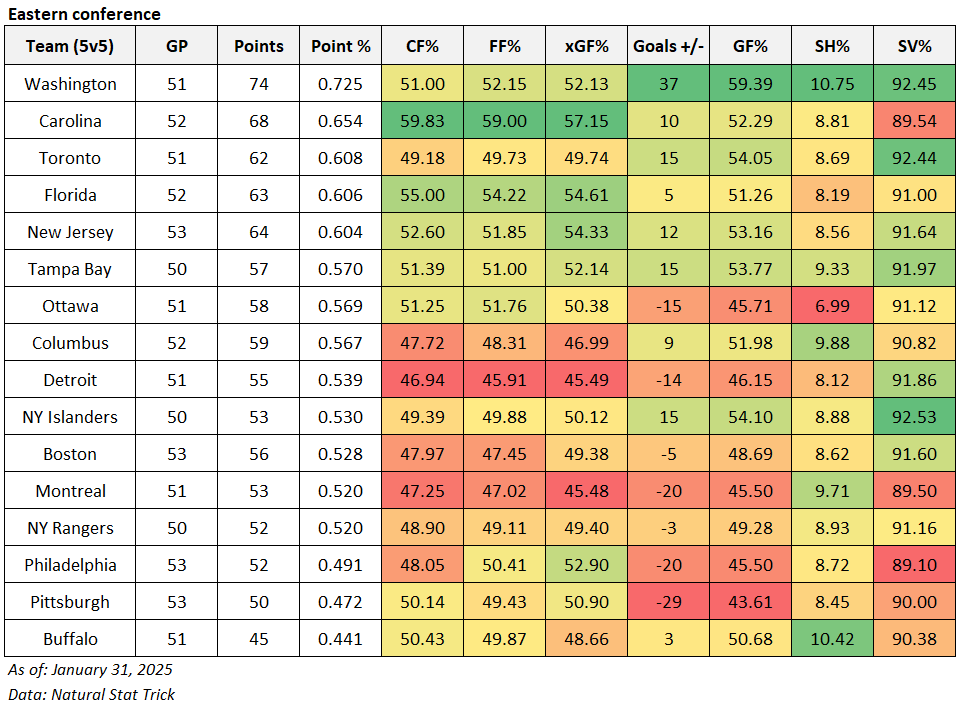
Data: Natural Stat Trick
