Remarkable results for the Edmonton Oilers, posting 16 straight wins over a 37 day stretch between December 21, 2023 and January 27, 2024.
- The Oilers outscored opponents 43-20, a 68.25 percent goals-for percentage, at even-strength (5v5). A big reason for their results was their ability to control the flow of play and generate scoring chances consistently. They posted a Corsi For percentage of 55.91 percent and Expected Goals For percentage of 57.31 percent.
- The Oilers team save percentage was 94.01 percent, third highest in the league. In all situations, the Oilers had the best save percentage in the league with 94.56 percent.
- The Oilers powerplay scored 11 goals, a rate of 10.68 goals per hour that ranked fifth in the league for this time period. Their rate of shots (69.92 per hour) and unblocked shot attempts (94.20 per hour) ranked fourth and fifth in the league, respectively. Their powerplay shooting percentage was 15.28 percent and ranked 14th in the league.
- The Oilers penalty kill only allowed 3 goals, a rate of 2.18 goals against per hour – the lowest in the league. They allowed the second-lowest rate of unblocked shot attempts (62.63 per hour) and the fourth lowest rate of shots against (45.88 per hour). I did a deeper dive on the Oilers penalty kill recently for Oilersnation.
The Oilers dominance was really driven by their top six group, featuring McDavid and Draisaitl. With either of them or both on the ice, the Oilers were at another level, spending a lot of time with the puck and in the opponents zone – which led to a lot of scoring chances.
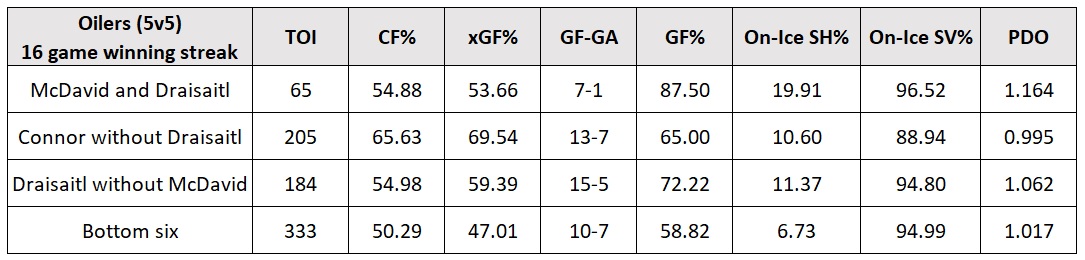
The share of expected goals, which factors in shot quality, took a massive jump during this winning streak with McDavid on the ice, as his line with Hyman and RNH has been dominant for a few months now. Draisaitl posted excellent numbers as well, especially with McLeod and Foegele. Not much to complain about how the top six has performed.
The bottom six group had some issues at even-strength. While they did post a positive goal differential, it appears a lot of their success was dependent on the goaltending. Without McDavid or Draisaitl on the ice, so 333 minutes which equates to about 42% of the team’s total time spent at even-strength, the Oilers posted a Corsi For percentage of only 50 percent and an expected goals for percentage of 47 percent. That’s well below their team levels this season, and makes you wonder if this bottom six is up for the task when playoffs roll around.
Below is a high-level snapshot of how each player’s on-ice numbers were at even-strength (5v5) during the 16-game winning streak, split between forwards and defencemen and sorted by total ice-time. Included are the metrics I use to assess a player’s performance (i.e., shots and expected goals) as well as their actual on-ice results (i.e., goal differential). I’ve also included each player’s PDO, which assesses how lucky/unlucky they’ve been, and if we can expect their results to improve over the course of the season. A basic heat map has been applied to show how each player compares to the rest of their squad.

Interesting to see that Kane only broke even in terms of on-ice goal differential during this 16-game winning streak. Even Brown was +2. Considering how much time Kane got to spend in the top six, especially after publicly complaining about his ice time, you’d expect his numbers to be a little stronger. And somehow Derek Ryan posted a -2 goal differential. On the back end, it was really that top pairing of Bouchard and Ekholm that helped drive results. Should be interesting to see how the Oilers address their issues among the depth forwards up front and on the right side of their defensive group.
Data: Natural Stat Trick
