It’s wild to think of the progress the Edmonton Oilers have made since my last check-in at the end of December. At that point, they were “within striking distance of a wild-card spot”, and now they’re sitting comfortably near the top of the Pacific division. A 16-game winning streak, including an 11-0 run in the month of January, can do wonders. And it also shows you what it actually takes to make ground in the NHL standings. After 45 games, the Oilers now have a points percentage of 0.656 – which has them second in the Pacific division and fifth best in the western conference.
Below are the even-strength (5v5) numbers for each team in the western conference (sorted by points percentage), including goal-share results as well as the shot-share metrics that give us a sense of which teams have the right processes in place and if the results are sustainable or not. At the end of the table are each team’s shooting percentage and save percentage. I’ve also applied a basic heat map to each metric to show which teams are doing well or struggling relative to their conference foes (i.e., green is good, red is bad). You can also find a description of each metric at the end of this article. Please note that the shot-share metrics are score and venue-adjusted based on Natural Stat Trick’sTrick’s methodology.
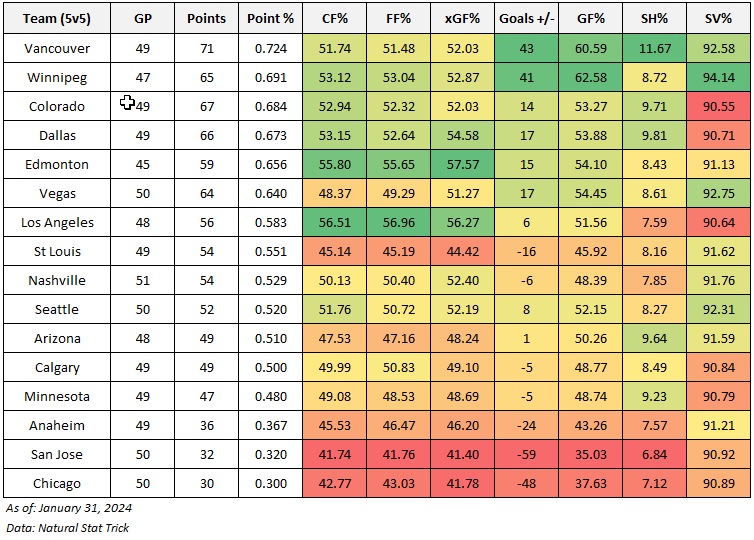
Not much to say about the Oilers right now. Everything is clicking thanks to their strong play at even-strength where they’ve posted a Corsi For percentage of 55.80% this season (fourth highest in the league) and 55.91% over this current 16-game winning streak. Outside of a couple games where they probably should have lost, they’ve looked really good during this win streak, getting plenty of contributions from across the roster. Powerplay is doing well and the penalty kill has been one of the best in the league.
Couple other observations of the western conference:
- Colorado’s goaltending should be a spot of bother for them, as they rank near the bottom of the western conference with a 90.55% team save percentage. I do wonder if giving Alexander Georgiev the highest workload in the league is going to cost Colorado down the stretch and in the playoffs. They seem to be doing everything else right, getting positive results driven by their strong possession numbers. But I’m guessing they’ll aggressively try to find a stronger goalie who can play a lot of minutes.
- Los Angeles is in a similar situation, having overplayed Cam Talbot, and now they’re reeling just a bit. Thought Todd McLellan would have learned his lesson when he was coaching the Oilers in the 2016/17 season.
- I would still have concerns about Skinner’s workload, something I wrote about recently.
- Vegas isn’t looking as strong as the rest of the teams at the top right now, posting some of the lowest shot-share metrics in the group. But they do a good job balancing their goalies workloads and are getting positive results from them.
- Edmonton is still around league average when it comes to shooting percentage and save percentage at even-strength over the course of the full season. Funny how everything is balancing out like some of us suspected.
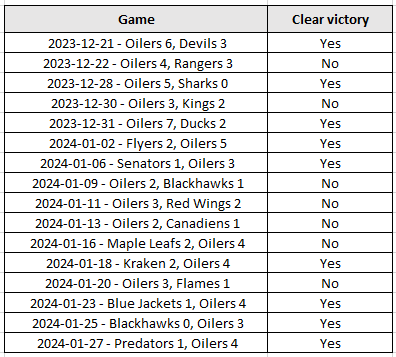
A concept I’ve been thinking more about are “clear victories”, and how many the Oilers have secured this season. It’s a concept that Scott Reynolds and Derek Zona of the Copper & Blue tracked back in the day, and it was defined by any win by two or more goals without empty-net goals needed. Clear victories measure a team’s talent better than the win-loss record, and gives us a better idea of which team could have sustainable success. If your team is winning a bunch of one-goal games or needing overtime, chances are that over time, those will eventually turn to losses. But if your team is putting teams away early on in the game, it’s a good sign that they’re roster is talented and that the wins should carry forward.
The good news for the Oilers is that over this 16-game winning streak, nine have been clear victories. They did have a stretch of six wins where only one was a clear victory, which made me think a loss was coming soon. But then they put up three straight right before the NHL all-star break.
Challenge right now is getting that specific data set over multiple seasons. I do have something in the works to not only see how the Oilers are doing when it comes to clear victories, but also how they compare to other teams who have won playoff rounds. Hoping to have something together soon.
Data: Natural Stat Trick
Glossary:
- Points-percentage (Point%) – The total points accumulated divided by the points that were available, including extra time.
- Corsi for percentage (CF%) – The proportion of all the shot attempts the team generated and allowed that the team generated (i.e., corsi for/(corsi for + corsi against). This is used as a proxy for possession and is the best at predicting a team’steam’s future share of goals (GF%). (Source: Hockey Great Tapes – Draglikepull)
- Fenwick for percentage (FF%) – The proportion of all the unblocked shot attempts the team generated and allowed that the team generated (i.e., Fenwick for/(Fenwick for + aenwick against). This is used as a proxy for shot quality and considers shot blocking a repeatable skill.
- Expected goals for percentage (xGF%) – This is a weighting placed on every unblocked shot based on the probability of the shot becoming a goal. This depends on the type of shot, location and uses historical shot and goals data to come up with the probability for each unblocked shot.
- Goals for percentage (GF%) – The proportion of all the goals that the team scored and allowed that the team generated (i.e., Goals for/(Goals for + goals against).
- Shooting percentage (SH%) – The percentage of the team’steam’s shots on goal that became goals (i.e., total goals divided by the total shots on goal).
- Save percentage (SV%) – The percentage of the team’steam’s shots on goal against that were saved (i.e., 1-(totals goals allowed divided by the total shots on goal against)).

Pingback: Tracking the Western conference – As of February 29, 2024 | The SuperFan