After 35 games into the regular season, the Edmonton Oilers are finally within striking distance of a wild-card spot in the western conference. A previous eight-game winning streak, and this current five-game winning game streak has pushed them to fourth in the Pacific division and ninth in the west (as of December 31st, 2023), having now accumulated 37 points and posting a 0.544 points percentage.
Below are the even-strength (5v5) numbers for each team in the western conference (sorted by points percentage), including goal-share results as well as the shot-share metrics that give us a sense of which teams have the right processes in place and if the results are sustainable or not. At the end of the table are each team’s shooting percentage and save percentage. I’ve also applied a basic heat map to each metric to show which teams are doing well or struggling relative to their conference foes (i.e., green is good, red is bad). You can also find a description of each metric at the end of this article. Please note that the shot-share metrics are score and venue-adjusted based on Natural Stat Trick’sTrick’s methodology.
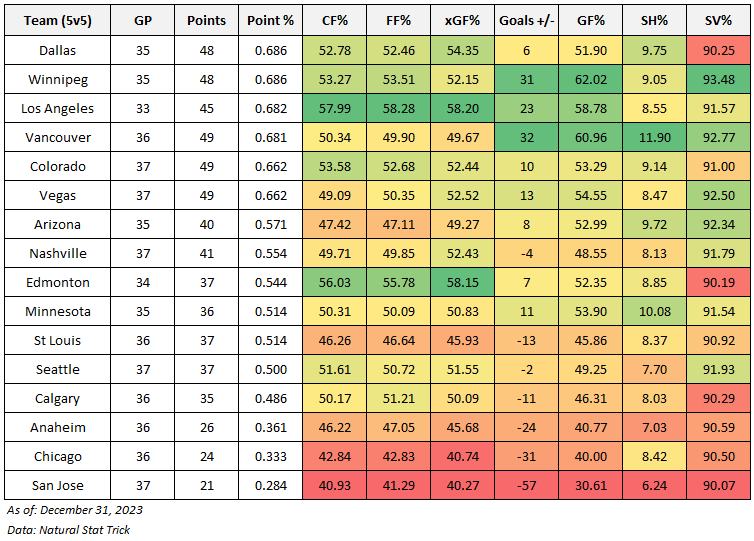
As mentioned at the last check-in, there were plenty of reasons to believe the Oilers would eventually climb up the standings. The team’s even-strength (5v5) performance has been strong all season, with the club continuing to post some of the strongest shot-share percentages and expected goal shares in the league. And not a lot of of teams have pulled away in the standings. As long as the Oilers can continue getting average goaltending and depth scoring at even-strength, they should be able to secure a spot.
Below is a high-level snapshot of how each player’s on-ice numbers have been at even-strength (5v5) this season, split between forwards and defencemen and sorted by total ice-time. Included are the metrics I use to assess a player’s performance (i.e., shots and expected goals) as well as their actual on-ice results (i.e., goal differential). I’ve also included each player’s PDO, which assesses how lucky/unlucky they’ve been, and if we can expect their results to improve over the course of the season. A basic heat map has been applied to show how each player compares to the rest of their squad.

We know who the individual drivers have been this season and I’ve written enough about Kane’s season, so let’s focus on PDO and which players might see some improved results. Up front, I think Draisaitl’s and Foegele’s on-ice goal-differentials are bound to improve. They’re skating on a very effective second-line with McLeod, with the trio outscoring teams 9-2 in 48 minutes together. They might not be able to sustain this 82% goal-share, but their results should remain strong as they’re posting a 67% Corsi for percentage and expected goal share together. On the back-end, I think we’ll see Bouchard’s results improve as he continues to post strong on-ice shot-share numbers and skates with top-end players, but has one of the lowest PDO’s on the team.
Finally, here’s a quick look at how the western conference teams are doing on special teams, sorted by their points percentage. I’ve included the shots for and against to assess their performance and the goals for/against to assess the actual results.

Edmonton’s powerplay continues to be one of the best, no surprise. And their penalty kill results should gradually improve as they’re allowing one of the lowest rates of shots against. That’s a positive sign as the last thing they need in this playoff race is their special teams costing them wins as it’s done in the past. Looking at the teams Edmonton is competing with for playoff spots, Vegas and Colorado look like they have things figured out. As well as Nashville who should get better penalty kill results. I don’t see Arizona staying in the race as they’re even-strength performance numbers have been poor along with their penalty kill. And Minnesota is another team that could be sunk by their special teams.
Will be interesting to see how things play out over the next month with Edmonton playing a lot of the weaker teams in the league with no back-to-backs scheduled. If things go well, the Oilers could push for third in the Pacific. For now, it’ll be key to bank points and create some separation from the rest of the wild-card pack.
Data: Natural Stat Trick
Glossary:
- Points-percentage (Point%) – The total points accumulated divided by the points that were available, including extra time.
- Corsi for percentage (CF%) – The proportion of all the shot attempts the team generated and allowed that the team generated (i.e., corsi for/(corsi for + corsi against). This is used as a proxy for possession and is the best at predicting a team’steam’s future share of goals (GF%). (Source: Hockey Great Tapes – Draglikepull)
- Fenwick for percentage (FF%) – The proportion of all the unblocked shot attempts the team generated and allowed that the team generated (i.e., Fenwick for/(Fenwick for + aenwick against). This is used as a proxy for shot quality and considers shot blocking a repeatable skill.
- Expected goals for percentage (xGF%) – This is a weighting placed on every unblocked shot based on the probability of the shot becoming a goal. This depends on the type of shot, location and uses historical shot and goals data to come up with the probability for each unblocked shot.
- Goals for percentage (GF%) – The proportion of all the goals that the team scored and allowed that the team generated (i.e., Goals for/(Goals for + goals against).
- Shooting percentage (SH%) – The percentage of the team’steam’s shots on goal that became goals (i.e., total goals divided by the total shots on goal).
- Save percentage (SV%) – The percentage of the team’steam’s shots on goal against that were saved (i.e., 1-(totals goals allowed divided by the total shots on goal against)).

Pingback: Thoughts on the Oilers: Current state, regulation wins, goaltending usage and Draisaitl with centers | The SuperFan
Pingback: Tracking the Western conference – As of January 31, 2024 | The SuperFan