Digging into the depth II – Improved defensive play

338 Gaetan Haas Photos and Premium High Res Pictures - Getty Images

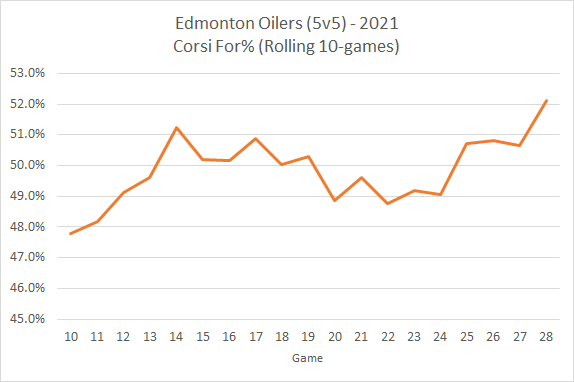
Over the course of the season, the Oilers have done a much better job at limiting the numbers of shots and scoring chances against at even-strength (5v5).

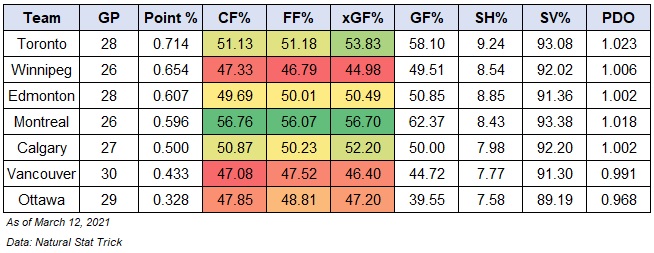
Over the first 15 games, the team was allowing 57.2 shot attempts per hour, which was fifth highest in the league and only slightly better than Vancouver and Ottawa in the North division. They were also allowing 42.13 unblocked shot attempts, a proxy for scoring chances, which was eighth highest in the league. This poor defensive play was a key factor in the team allowing the fifth highest rate of goals against (3.07) and why they were fifth in the North division in terms of points percentage.

Thankfully things have turned around since then. Since game 16 in early February, the team has seen their rates of shots and scoring chances drop down to league average levels, with the team allowing a rate of 51.84 shot attempts per hour (a drop of 10.3%) and 39.11 unblocked shot attempts per hour (a drop of 7.7%). And it’s been part of the reason why the team has seen their rate of goals against drop down to 2.09, again closer to league average levels. And it’s been a factor in the team’s resurgence in the standings.

Oilers (5v5)Corsi Against/60Fenwick Against/60Expected Goals Against/60Goals against/60
Games 1-1557.2042.132.353.07
Games 16-3451.8439.112.182.09
% Change10.3%7.7%7.8% 46.9%

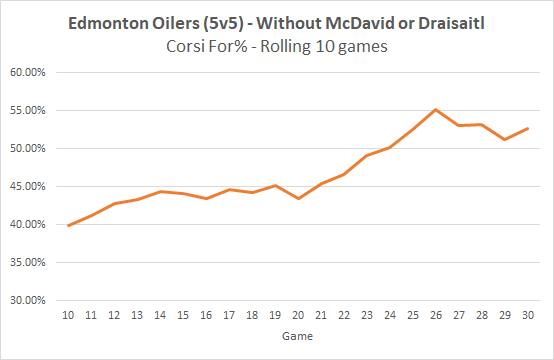
One reason for the Oilers improved defensive numbers has been the play of the depth players. Early on in the season, the team depth was the reason why the Oilers rate of shots and scoring chances were so high and why they were getting badly outscored. Without McDavid or Draisaitl, the Oilers were getting crushed allowing over 61 shot attempts per hour and over 48 unblocked shot attempts per hour. That’s what the worst teams in the leagues typically allow in a season – unacceptable in any situation, especially when you’re not able to generate even close to that much offensively.

Since early February, the Oilers depth players have done significantly better, cutting their rate of shot attempts against per hour by 25% and their rate of unblocked shot attempts by over 30%. And most importantly, and with the help of some improved goaltending, the team is allowing more than half the rate of goals against.

Oilers Depth (5v5)Corsi Against/60Fenwick Against/60Expected Goals Against/60Goals against/60
Games 1-1561.7946.802.403.97
Games 16-3449.3935.011.911.85
% Change25.1%33.7%25.7% 114.6%

One player who likely played a role in the team’s improved defensive play this season is forward Gaetan Haas. Last season, the team saw a significant drop in shots and scoring chances against when Haas would be on the ice at even-strength. Among the 18 forwards who played at least 100 minutes in 2019/20, Haas ranked in the top three for any on-ice defensive metrics. Offence was completely sacrificed with Haas on the ice as the team didn’t generate much, but his defensive play was valued by the coaching staff as shown by his increased usage this season, especially on the penalty kill.

Haas has played in the past 17 games for the Oilers this season, following a stint on the injured reserve after playing two games in late January. His defensive numbers are pretty much identical to what they were last season. Among 15 forwards who have played at least 100 minutes this season, Haas is first in all defensive categories – including goals against per hour.

With Haas on the ice this season, the Oilers are allowing less than 20 shots against per hour at even-strength, while the team as a whole allows close to 30. He’s clearly the best defensive option among the depth forwards too. If the Oilers don’t have him, McDavid or Draisaitl on the ice, they’ve allowed 27 shots against per hour.

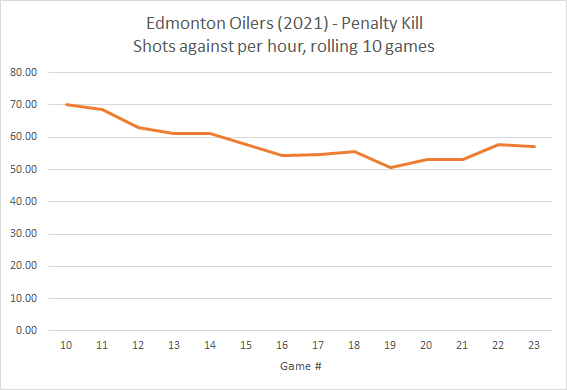
This strong defensive play has also translated well to the penalty kill, where Haas is for the first time in his NHL career getting regular minutes shorthanded. He currently ranks second on the team in average ice-time per game (2:09) among eight forwards (minimum 10 minutes played), and has posted the second lowest on-ice rate of unblocked shot attempts against and shots against – only behind Yamamoto.

What has to be especially pleasing for the coaching staff is Haas’ on-ice rate of goals against per hour – 2.97. He’s only been on the ice for two goals against in his 40 minutes of penalty kill time, a rate which has him seventh in the NHL among 112 forwards who have played at least 40 minutes this season. Keep in mind, the Oilers penalty kill as a whole is currently 20th in the league, allowing over eight goals against per hour and allowing some of the highest rates of shots and scoring chances. So don’t be surprised if Haas plays in every remaining game and sees his overall ice-time increase.

Haas’ defensive success has to make you wonder what the first 15 games could have looked like had he been healthy. He might not generate much offence, but they were clearly in need of defensive help as they were getting outshot at a 2:1 clip early on and crushed on the scoreboard. Also makes you wonder if the Oilers really knew what they had in Haas going into the season, considering they did hand Turris a two year deal to be their depth centerman and a regular option on the penalty kill. We might not know how Haas would have been deployed had he been healthy, but I would assume Turris with his draft pedigree and his familiarity with the head coach would have still received a long look. Classic example of the availability heuristic concept.

Thankfully things have worked out much better recently and the Oilers are back on track. Just remains to be seen how the team evaluates players at the trade deadline and off-season, and if someone like Haas will a contract extension or if another ‘known’ player is brought in.

Data: Natural Stat Trick, Hockey Viz

Related:

New season, same player

The day after: Jesse Puljujarvi looking like new player in return to  Edmonton Oilers

It’s been very encouraging to see how well Jesse Puljujärvi has played since his return to the NHL. Playing in a top six role is the ideal spot for a player of his skillset, and he’s establishing himself as a key player on a value contract – which is massive in the current marketplace.

It’s worth noting that many of his individual and on-ice numbers this season are similar to the numbers he posted over the course of his first three seasons prior to leaving for Oulun Kärpät. It’s easy to forget that while he did struggle at times – dealing with being a rookie, injuries and the mismanagement of previous coaching regimes – Puljujärvi was productive and showing signs of sustainable offence when he was deployed in a top six, scoring role against the best competition.

Over his first three seasons in the NHL, Puljujärvi scored 14 goals and had 17 assists at even-strength (5v5) – nothing great, and only a points per hour rate of 1.14. Looking at those totals, you can see why his value and reputation took a hit. Where Puljujärvi was effective in those first three seasons was when he played with McDavid – about 25% of his own total ice-time – where he scored 6 of his goals and collected 8 assists. This translated to a rate of 2.06 points per hour, which is what you would want your top six players to produce.

Puljujärvi’s on-ice shot-share numbers in those three seasons with McDavid were great as well, again close to what you would want from a top line, indicating strongly that there was sustainable success between the two. They controlled the flow of play as reflected by their 55.06% share of unblocked shot attempts, and had a higher share of the total scoring chances with 55.50%. And most importantly, the Oilers outscored opponents 24-15 when they were on the ice together – a goal-share of 61.54%. Among the ten forwards that McDavid had played at least 200 minutes with between 2016 and 2019, his goal-share with Puljujarvi was second only to his goal-share with Eberle (62.5%), largely due to the drop in rate of goals against when they were on the ice together.

The on-ice success with Puljujärvi and McDavid has continued this season and thankfully Puljujärvi’s seeing a much higher proportion of his total ice time with the star captain, increasing from 25% to 65% since returning to the NHL. While Puljujärvi’s rate of points per hour with McDavid has dropped slightly from 2.06 to 1.82, their share of shot attempts and scoring chances continues to be strong and aligns with their historical numbers. They continue to control the flow of play (55.56% Corsi For percentage) and scoring chances (53.93% Fenwick For percentage) at almost the exact same ratios as before. While their 51.72% goal-share this season is down from when they played prior to Puljujärvi’s departure, there’s good reason to believe that will improve considering their on-ice shooting and save percentages are below league average levels and, more importantly, below McDavid’s career levels.

For context, I think it’s also important to monitor Puljujärvi’s on-ice numbers this season without McDavid and compare them to the numbers he posted before he went to play in Finland. This can help with assessing how much the time in Finland helped, how well the coaching staff has “fixed” Puljujärvi as an individual player, and how well management has improved the depth of the roster.

Right now we’re seeing Puljujärvi spend far less of his total playing time away from McDavid, and posting the same on-ice share of shot attempts and scoring chances as he did before. With Puljujärvi on the ice without McDavid, the team’s on-ice share of shot-attempts and scoring chances remain the same as before he left for Finland, hovering just below the 50% mark. What does stand out is the team’s share of expected goals, which measures the quality of scoring chances based on the shot type and location, which sits just above 60%. You can even remove the limited minutes Puljujärvi has played with Draisaitl this season – in 123 minutes with Puljujärvi on the ice without those two star players, the Oilers have posted a 56% share of expected goals. As we get more data, it’ll be interesting to see if Puljujärvi’s on-ice numbers away from McDavid, especially the Corsi For%, improves and if the coaching staff can start thinking about using him as a possession driver on a different line to help with scoring depth.

Lots to be excited about with the potential of this player, and we knew before this season he can contribute on a top-six, scoring line against top competition. It’s great to see him be able to continue where he left off and provide some much needed offence to the team as they push for a playoff spot.

Data: Natural Stat Trick

Also published at The Copper & Blue.

CBC Radio Active: Oilers, North Division, Nugent-Hopkins and more

I joined Rod Kurtz on CBC Radio Active on Wednesday to talk Oilers and preview their upcoming game against the Calgary Flames. Full segment is here: CBC Radio Active (2021, March 17).

Topics we covered:

  • The Oilers recent play and their push up the standings.
  • Areas for concern and how they stack up in the North division.
  • Team toughness, and if they have a roster built for the playoffs.
  • Return of Zack Kassian, where he fits in on the roster and what to expect.
  • Ryan Nugent-Hopkins’ contract negotiations and what a deal could potentially look like.

Thanks as always to everyone at CBC for putting it all together!

Digging into the depth

Vancouver defeats Edmonton 5-3 in season opener

A big interest for me this season has been the performance and results of the depth forwards. Their numbers were so incredibly poor last season, as the team was outscored 44-73 at even-strength (5v5) without McDavid or Draisaitl on the ice. And that was over the course of about 1,800 minutes, which was 52% of the team’s total ice time. The depth forwards were a big reason why the Oilers had a 47.32% goal-share, one of the worst in the league, and it was clearly a focus for management in the off-season as they tried to add more skill to the roster.

Over the first 30 games, the overall results haven’t been great for the depth forwards. The Oilers have been outscored 19-29 at even-strength without McDavid or Draisaitl on the ice, posting a score-adjusted Corsi For% of 46.16% and a Fenwick For% of 46.88% – pretty similar shot-share numbers to last season. Because Draisaitl and McDavid have been able to play on their own lines for most of the season, the depth forwards have been deployed a lot less, dropping from 51.9% of the team’s total ice time last season to 41.3% this season.

Depth forwards (5v5)2019/202020/21
GP7131
TOI%51.9%41.3%
CF%47.2746.16
FF%47.8246.88
xGF%47.5345.34
GF-GA44-7319-29
GF%37.6139.58
SH%5.577.75
SV%91.5190.21
PDO0.9710.980

However, if you split this 2020/21 season into two parts, we actually see that all of the damage was really done over the first 15 games with things turning around nicely in the 15 games after. And this could be why Ken Holland is feeling better about his depth players (Global News).

2020/21 (5v5)Games 1-15Games 16-30
GP1515
TOI%36.4%46.2%
CF%40.9750.46
FF%41.4151.20
xGF%37.6750.51
GF-GA8-1710-10
GF%32.6049.27
SH%8.776.82
SV%88.6192.72
PDO0.9740.995

Not only are the results significantly better in the second half of the season, with the goal-differential going from -9 in the first 15 games to even in the next 15, but the underlying shot share are much improved as well. Their Corsi For% jumped 10 percentage points up to the break-even mark, with their share of scoring chances increasing along with it. The team’s goaltending is playing a big role as well, which is critical considering the lack of finishing talent on the roster. We can probably expect the goal share to fluctuate depending on if and when a skater or goalie runs hot or cold, but at least we know the process behind everything has improved.

What I also found interesting was which defencemen have been deployed with the depth forwards, and some of the adjustments the coaching staff has made from the first 15 games to the second set of 15 games.

Below are the defencemen’s even-strength numbers with the depth forwards in the first 15 games of the season when things went sideways. Included for each defenceman is the proportion of the depth forwards ice time they were on the ice for, along with the shot-share numbers, goal-share, and PDO. What stands out here is that Larsson was the most deployed defenceman with the depth forwards, Russell and Lagesson posted the best shot-share numbers and Bouchard was the only player with a positive goal-share.

Games 1-15TOI%CF%FF%GF%SH%SV%PDO
Nurse27.9%34.833.827.811.286.40.976
Barrie28.0%45.745.125.95.886.60.923
Larsson44.8%39.544.040.212.188.51.005
Russell18.0%53.851.20.00.085.30.853
Bear13.8%36.933.725.78.386.80.951
Jones18.1%39.440.748.010.790.91.016
Koekkoek26.5%32.934.517.54.988.80.937
Bouchard8.3%43.236.453.414.794.61.093
Lagesson14.7%51.755.9100.033.5100.01.335

And here’s the same set of metrics for the defencemen for games 16-30 when the results were much better.

Games 16-30TOI%CF%FF%GF%SH%SV%PDO
Nurse24.3%52.449.641.96.489.80.962
Barrie18.6%55.053.631.84.786.40.911
Larsson45.8%46.749.455.19.793.51.032
Russell25.0%47.349.334.13.994.30.982
Bear24.4%51.052.248.96.092.80.988
Jones22.9%53.157.90.00.090.80.908
Koekkoek5.5%46.042.30.00.093.00.930
Bouchard15.2%58.856.7100.07.0100.01.070
Lagesson18.5%48.148.482.522.595.51.181

As mentioned above, the depth forwards received a higher proportion of the team’s total ice time at even-strength between games 16-30, going from 36.4% to 46.2%. I think that’s a byproduct of getting better results: score more goals, gain the coaches trust and expect to see more ice time. Plus, the Oilers have been running McDavid with Draisaitl a little more often to get the top lines going.

What I found interesting was the increase or decrease of each defencemen’s proportion of ice time with depth forwards between games 1-15 vs games 16-30.

PlayersTOI% Change
Bear10.58%
Russell7.07%
Bouchard6.91%
Jones4.77%
Lagesson3.79%
Larsson0.99%
Nurse-3.66%
Barrie-9.42%
Koekkoek-21.02%

Koekkoek’s injury definitely had an impact on how players were deployed. But it’s interesting to see how the coaching staff deployed Nurse and Barrie even less frequently with the depth forwards, and maintained Larsson as the main defencemen for them. Bear saw his proportion with depth forwards go from 13.8% to 24.4%, a 10.58% increase, the largest in the group. And the coaching staff seems to be showing some trust and confidence in Bouchard and Jones to help the depth forwards generate more offence. And I can’t say I would blame the coaching staff for giving Russell more time with the depth forwards. He did have the best shot-share numbers with them in the first 15 games (53.8%) when the group as a whole was posting a Corsi For% of 40%. There’s also the need to keep him away from McDavid and Draisaitl who both see their Corsi For% take a hit when Russell is deployed with them. Lagesson also had great possession numbers with the depth forwards in the first half of the season, which might be why he’s seen an increase in playing time.

Aside from the deployment changes on defence, and changes to the group of depth forwards (i.e, Turris), there had to have been tactical adjustments as well. I’d be curious to know what those were as the results have been much better recently. I’m also curious to see what lessons the Oilers take from all of this and if they really explore why it took over a month to fix their issues and how exactly it was fixed – was it all luck or did they have an actual strategy in place? The Oilers are in a decent spot in the standings now, but imagine if the depth forwards hadn’t been outscored 8-17 in the first 15 games. It cost them wins and playoff positioning, and it really can’t be ignored especially if they want to be considered a championship contender.

Data: Natural Stat Trick

Related:

Depth progress

Oilers' Chiasson suspended one game for cross-checking Maple Leafs' Vesey

An encouraging indicator of progress has been the Oilers improved Corsi For percentage over the course of the season, which tells us how well the OIlers are controlling the share of shot attempts and the overall flow of play at even-strength. After the first ten games of the season, the Oilers had one of the lowest proportions in the league with 47.79%, which likely played a role in their 4-6-0 start. But from that point on, they’ve gradually improved, posting a Corsi For% of 48.85% between games 11 through 20, and then a Corsi For% of 52.92% between games 21 through 30.

A big reason for their progress has been the improved play of the team without their top forwards on the ice. In the first 10 games of the season, the Oilers were outscored 2-14 at even-strength without McDavid or Draisaitl on the ice, which is about 40% of the team’s total ice time. These results were largely due to playing the majority of the time without the puck and in their own zone as reflected by the team’s Corsi For% of 39.94%. We started seeing signs of life a few weeks ago when the team posted a Corsi For% of 45.19% over a ten game stretch, where they also posted a +2 goal differential (10 GF, 8 GA). And thankfully, they’ve continued to progress with the team posting a Corsi For% of 52.61% over the last ten games without their star players on the ice.

Since getting outscored 2-14 in the first ten games, the Oilers have turned things around nicely having outscored opponents 16-13 without McDavid or Draisaitl on the ice over the last 20 games. That was a massive hole they put themselves in early on in the season, and they likely won’t recover to a 50% goal-share by the end of the season. But the adjustments they’ve made such as reducing Turris’ ice time and giving the depth forwards more offensive zone faceoffs, should be part of the lessons carried forward.

It’s also worth noting how well the Oilers depth compares with their North division rivals. What I did was take a couple of the top forwards from each team to serve as proxies for their teams top two lines, doing my best to find players who don’t play often with each other. I then looked at how their teams did without them at even-strength to gauge the performance of the team’s depth players. Below are the forwards I used for each club:

  • Edmonton – McDavid, Draisaitl
  • Calgary – Tkachuk, Gaudreau
  • Montreal – Suzuki, Danault
  • Ottawa – Tkachuk, Paul
  • Toronto – Matthews, Tavares
  • Vancouver – Pettersson, Horvat
  • Winnipeg – Ehlers, Wheeler

For each team in the table below I’ve included the proportion of the team’s total ice time that the depth forwards played, as well as the Corsi For% that they posted and their Goals For%. Table is sorted by points percentage. Note that the Corsi For% is score and venue adjusted.

TeamPoints%TOI%Corsi For %Goals For%
Toronto0.69041.6748.1455.30
Winnipeg0.66742.2047.3257.31
Edmonton0.60041.3946.2740.05
Montreal0.57443.4355.4561.64
Calgary0.51841.5550.9739.50
Vancouver0.45246.7845.7639.13
Ottawa0.31743.4243.4832.20

On average, teams typically have their depth players on the ice for about 40% of the teams total ice time at even-strength. Here we see that over the course of the season, the Oilers have posted a Corsi For% of 46.27% without McDavid or Draisaitl on the ice, and have a goal-share of 40.05%. As mentioned above, the Oilers depth played have made positive strides recently, and they’ll need to maintain a high level of play if they want to dig out of the hole they put themselves in. Vancouver and Ottawa are in a similar boat – their depth players have struggled in terms of puck possession, and they’ve been a black hole in terms of offensive production. And it’s made worse by the fact that even with some of their top players on the ice, they’re getting crushed on the score sheet. Toronto and Montreal appear to be in a good spot, doing a better job at controlling the flow of play with their depth players and getting good results. Winnipeg seems to have a team-wide issue when it comes to shot-share metrics, so it’ll be interesting if their results are sustainable. And if Calgary can find some finishing talent for their bottom two lines, they might be able to improve their overall goal differential.

It’ll be really interesting to see which teams in the North division can get the most out of their depth players, which can serve as a competitive edge in what should be a close playoff race.

Data: Natural Stat TrickOilers Nerd Alert/PuckIQ

(Special thanks to @OilersNerdAlert for the specific data set)

Also posted at The Copper & Blue.

Tracking the North Division – As of March 12, 2021

Edmonton Oilers Schedule, Roster, News, and Rumors | The Copper & Blue

The Edmonton Oilers are half-way through this condensed season, sitting third in the North division with a points percentage of 0.607%, only behind Toronto and Winnipeg. It’s been a nice turnaround from the last time we checked in in early February when the Oilers ranked sixth in the division after 11 games and were struggling at even-strength and on the penalty kill.

TeamGPWLOTLROWPointsPoint %Goal Diff
Toronto28197219400.714+27
Winnipeg26168216340.654+11
Edmonton281711017340.607+10
Montreal26127712310.596+17
Calgary271212311270.500-8
Vancouver301216210260.433-17
Ottawa2991917190.328-40

The Oilers overall goal differential has gradually been improving as they’re getting better at controlling the flow of play, spending more time with the puck and getting better goaltending. In early February, they were allowing the third highest rate of goals against in the league, but now they’re closer to league average levels. And they’ve continued being one of the highest scoring teams in the league. They’re not quite at the levels posted by previous top-end teams, but they’re progressing well.

Quick glance into how the Oilers compare against their division rivals at even-strength (5v5). The table below is sorted by points percentage, with a basic heat map applied to the shot-share numbers to see which teams are doing well, and whose results may or may not be sustainable. Note that the shot-share numbers are score and venue adjusted. A description of each metric is at the end of this article.

Nice to see the Oilers improve their Corsi For% from 47.13% in early February to 49.69% today. What’s especially encouraging is that they’ve posted a 52.10% Corsi For% (score and venue adjusted) over their last ten games, which is closer to what top end teams typically finish their seasons with.

Worth noting that it’s been the improved play of the depth forwards that’s helped drive up the team’s shot share numbers. There were signs of progress recently, and it’s nice to see it continue. Without McDavid or Draisaitl on the ice over the last ten games, the Oilers have posted a Corsi For% of 52.56% as well as an Expected Goals For% of 51.07%. Unfortunately this hasn’t translated into an improved goal-share when depth forwards are on the ice, due to their team shooting percentage of 4.17%. Hopefully the Oilers are aware of the need for finishing talent, and can identify potential options – either internally or externally – to squeeze out better results.

As for the rest of the division, it’ll be interesting to see how Winnipeg does over the remaining stretch. They’re posting poor shot-share numbers at even-strength (5v5), allowing one of the highest rates of shots and scoring chances against in the league. And it doesn’t look like they’re riding a PDO wave, as their team shooting percentage and save percentage is around league average levels. Instead, it looks like they’re winning a lot of close games and doing alright on special teams as well, as their powerplay and penalty kill hasn’t been costing them games.

Below is a snapshot of how each North division team is doing on special teams. Starting with actual results, I’ve combined the goal rates for each team’s powerplay and penalty kill, also factoring in shorthanded goals. I’ve also combined the rate of unblocked shot attempts on each team’s powerplay and penalty kill, which can tell us if the team’s success on special teams is sustainable or not.

TeamCombined goal ratesCombined unblocked shot rates
Toronto 2.9033.85
Montreal 1.53-8.51
Edmonton1.45-3.65
Winnipeg 0.53-13.81
Vancouver -0.116.88
Calgary -0.91-11.53
Ottawa -4.84-2.10

For example, the Leafs have the best powerplay in the league and their penalty kill is slightly below league average. Combine the rate of goals for and against on the powerplay and penalty kill, you get 2.90. That’s not bad, but when you look at their combined rate of unblocked shots, you get a sense that there’s a chance that it gets better – especially on the penalty kill where they’re one of the best teams at preventing chances, but not able to get consistent goaltending. Considering their goaltending has been solid at even-strength, you have to wonder if it’s a matter of time before the Leafs start to improve on the penalty kill.

Edmonton is pretty much getting what they deserve on special teams. They’re doing well on the powerplay, generating lots of chances and getting positive results. On the penalty kill, they’re one of the worst at preventing chances, and their actual results are below league average. I suspect Winnipeg could see a hit to their special teams results as they’re breaking even right now, but allowing a high rate of shots on the penalty kill. Maybe goaltending bails them out, but it’s not exactly a recipe for long-term success. The other team to watch is Montreal. They’re getting great results at even-strength, but their special teams is over-performing relative to their underlying shot rates for and against. Prime opportunity for the Oilers to stay ahead of them in the standings as long as their play at even-strength continues to improve and their special teams doesn’t cost them games.

Data: Natural Stat Trick

Glossary:

  • Points-percentage (Point%) – The total points accumulated divided by the points that were available, including extra time.
  • Corsi For percentage (CF%) – The proportion of all the shot attempts the team generated and allowed that the team generated (i.e., Corsi For/(Corsi For + Corsi Against). This is used as a proxy for possession and is the best at predicting a team’s future share of goals (GF%). (Source: Hockey Great Tapes – Draglikepull)
  • Fenwick For percentage (FF%) – The proportion of all the unblocked shot attempts the team generated and allowed that the team generated (i.e., Fenwick For/(Fenwick For + Fenwick Against). This is used as a proxy for shot quality and considers shot blocking a repeatable skill.
  • Expected Goals For percentage (xGF%) – This is a weighting placed on every unblocked shot based on the probability of the shot becoming a goal. This depends on the type of shot, location and uses historical shot and goals data to come up with the probability for each unblocked shot.
  • Goals For percentage (GF%) – The proportion of all the goals that the team scored and allowed that the team generated (i.e., Goals For/(Goals For + Goals Against).
  • Shooting percentage (SH%) – The percentage of the team’s shots on goal that became goals (i.e., total goals divided by the total shots on goal).
  • Save percentage (SV%) – The percentage of the team’s shots on goal against that were saved (i.e., 1-(totals goals allowed divided by the total shots on goal against)

Assessing the Oilers after 25 games

An important and hopefully obvious question the Edmonton Oilers management group should be asking at this point: is this team any good?

With the trade deadline coming up and a playoff spot up for grabs, a proper evaluation of the results is critical to know which direction to take this team. I know if I was overseeing the management group, there would need to be some performance thresholds or indicators in place to determine if assets should start being spent to drive a playoff run or if it was time to make decisions geared to winning next year. There’s a lot at stake here both financially and when it comes to asset management, so it’s important to look at all of the information available and determine how good this team is and if they can be a legitimate contender or not.

In my mind, the Oilers don’t need to be a top-ranked team today, but they need to at least be playing like one and have underlying numbers similar to those posted by previous top-ranked teams. Since top-ranked teams typically finish the regular season with a 0.600 points percentage or better and are in the top ten leaguewide, it was a simple exercise to identity who the top teams were and establish some key performance indicators based on shot-based metrics that can predict future results. And by doing so, I was also able to find how league average teams did as well as bottom end teams. This way I could assess which level the Oilers are at offensively and defensively, and guide my thoughts on what course of action management should take.

Lets start with actual results at even-strength and focus on the rate of goals the Oilers are scoring and allowing this season, and their share of the total goals for and against (i.e., goals for percentage). Based on the last three regular seasons, here’s how the top teams, average teams and bottom teams have performed when it comes to goals. There’s nothing really surprising here – top teams outscore opponents and on average have a goal-share above 53%, while league average teams just break even.

Metric (5v5)Top TeamsLeague AverageBottom Teams
Goals For/602.672.452.27
Goals Against/602.312.452.59
Goals For%53.5850.0146.72

After 25 games this season, the Edmonton Oilers have a goals for percentage of 48.08%, having posted a -4 goal differential (50 goals-for, 54 goals-against). That would have them between league average levels and the levels posted by bottom end teams. Offensively, the Oilers are doing well due in large part to their top players, currently scoring 2.52 goals per hour, which is slightly above league average rates but below what top teams have posted in previous seasons. Unfortunately, the Oilers are giving it all back this year, allowing 2.72 goals against per hour, which is even worse than what bottom teams allow on average (2.59).

Goaltending has obviously been an issue, with the team posting a save percentage of 91.21%, which as we see below is closer in line to what bottom teams have posted on average in previous seasons. The Oilers shooting percentage of 8.53%, on the other hand, is closer to what top end teams have posted.

Metric (5v5)Top TeamsLeague AverageBottom Teams
Shooting%8.467.997.6
Save%92.2892.0291.9

So it’s clear when comparing the Oilers to previous teams that the actual results aren’t quite there yet, but are the Oilers at least playing like a top team? Are they controlling the flow of play, generating more opportunities than they are allowing, and maybe just need their goaltending to be league average to improve their spot in the standings? To do that, we’ll look at the Oilers rate of shot attempts, for and against, and the Oilers’ share of the total shot attempts for and against (i.e., Corsi), which can be used to predict future goal share (Source).

MetricTop TeamsLeague AverageBottom Teams
Corsi For/6058.4156.3754.68
Corsi Against/6054.2956.3758.5
Corsi For%51.8449.9948.29

The Oilers are currently posting a Corsi For percentage (score and venue adjusted) of 49.17%, which is just below league average levels. The team is generating 53.40 shot attempts per hour, which is slightly lower than what bottom teams have generated. And they’re allowing 55.2 shot attempts per hour, which is slightly better than league average levels. Based on the Oilers underlying shot-based metrics, there’s little indication that the club is playing like a top team and we really can’t expect their goal-share to reach 53% any time soon. And it really is no surprise that the club is getting outscored at even-strength (5v5), especially considering how badly the team gets outplayed when their depth forwards on the ice. Without McDavid or Draisailt on the ice at even-strength (5v5), or about 40% of the team’s total ice time, the Oilers have posted a Corsi For% just under 45%. Even with Draisaitl on the ice, the Oilers spend more time without the puck posting a Corsi For% of 47.39%.

Even if we look at the expected goals, which measures the quality of the unblocked shots taken, it’s a similar story. The Oilers currently have an expected goals for percentage of 50.23%, generating 2.32 expected goals per hour and allowing 2.30 expected goals against. Since they’re generating a lot of chances like a top team and at the same time allowing chances like a bottom team, they land in that league-average range.

MetricTop TeamsLeague AverageBottom Teams
Expected Goals For/602.372.292.19
Expected Goals Against/602.212.292.39
Expected Goals For%51.7250.0147.86

Based on the Oilers current underlying shot-based metrics, we can confirm that the Oilers aren’t playing like a top end team and we can’t expect the results to be any better than league average if things continue this way. While there are signs of life offensively, their defensive numbers are more in line with bottom end teams of the past – something that has to be a spot of bother for the coaches and management as the club had similar issues last season.

While the Oilers could consider moving assets to improve their results, it might be in management’s best interest to hold on to their picks and prospects and find cap space for next season. I’m just not convinced that one or two moves will make a big impact at this point as their issues run a lot deeper and across the roster. There’s the goaltending that needs to be fixed, but who knows how a new netminder will do when the club is allowing a high rate of shots and chances against. There’s the issue of spending significant time playing without the puck and in the defensive zone when McDavid or Draisaitl aren’t on the ice, but who knows how much of an impact another depth forward or defenceman is going to have. The biggest issue underscoring all of this is the Oilers pro scouting department and if their player and goalie evaluation methods are ever going to improve and become a strength of the organization. This group’s results have not been good recently and you have to wonder why the Oilers would continue making million-dollar decisions based on their input.

It’ll be interesting to see how the Oilers approach the trade deadline as it’ll give us insight on how much faith the Oilers have in their current roster to turn things around, and how desperate they are to be a contender this season. I’d rather they collet assets now by moving players whose roles are likely to be diminished next season and have internal replacements. Players like K. Russell who has seen his minutes decline, and Kassian who likely won’t be back in the top six again when he returns from injury, have value in the league – and it tends to be higher in-season when teams are gearing up for playoff runs. Whatever decisions the Oilers make, they need to have the future in mind and figure out how to consistently contend for championships.

Data: Natural Stat Trick

Also posted at The Copper & Blue.

Penalty kill progress

Spent some time looking at the powerplay last week, so might as well do a check-in on the Edmonton Oilers penalty kill. Especially with trade activity set to pick up ahead of the deadline and the Oilers looking for quality depth players who will likely be promoted as penalty kill options. Canucks forward Brandon Sutter is currently being floated around as an option for Edmonton (Edmonton Journal, The Province).

The Edmonton Oilers penalty kill has allowed 16 goals over 125 minutes this season, a rate of 7.66 goals per hour which ranks 17th in the league and fourth in the North division. The league average rate of goals over the last three seasons has been 7.17, so they haven’t been getting terrible results. In fact, over the last ten games the Oilers have allowed a rate of 5.21 goals against per hour, which is right around what they finished with last season (5.15) that ranked second best in the league.

But make no mistake, the Oilers penalty kill relies heavily on its goaltending. The Oilers have allowed some of the highest rates of shots against in the league this season, second-worst only to the Canadiens in the North division. You can use any of the shot metrics – unblocked shot attempts, scoring chances, high-danger chances – they currently rank bottom ten in the league. Thankfully the goaltending has improved recently on the penalty kill, playing well above league average levels. But it’s in the Oilers best interest to do a better job suppressing shots in the likely event that the goaltending comes back down to earth and the levels they were at earlier in the season.

Worth noting here that despite the reputation for defence, Dave Tippett doesn’t exactly have a long history of penalty kill success. His teams have typically allowed higher than average rates of shots and scoring chances against, but have been bailed out a few times by strong goaltending. It’s interesting to see that the rate of shots against this season aren’t too far off from where they were last season. The only difference is that the goaltending hasn’t been as strong in 2021.

SeasonGoals against/60Fenwick Against/60Shots against/60
2009/105.66 – 6th77.51 – 24th54.51 – 19th
2010/118.12 – 26th89.35 – 30th63.84 – 30th
2011/125.20 – 8th79.6 – 29th55.62 – 27th
2012/137.53 – 22nd70.24 – 20th49.63 – 19th
2013/147.73 – 27th77.97 – 22nd57.36 – 21st
2014/158.42 – 29th86.39 – 30th62.69 – 30th
2015/168.09 – 28th71.9 – 10th50.79 – 12th
2016/178.29 – 26th80.98 – 27th53.84 – 16th
2019/205.15 – 2nd76.28 – 23rd54.84 – 22nd
2020/217.66 – 17th79.44 – 23rd59.82 – 24th

The good news is that the Oilers are seeing some progress on the penalty kill this season, as their rate of shots against has gradually been declining recently. Over the last ten games, they have been allowing closer to a league average rate of shots, and that might be due to some adjustments they’ve made to player deployment.

One player who is doing well on the penalty kill is center Gaetan Hass. Since returning from injury, he’s been getting regular playing time shorthanded averaging a little over three minutes a game. He dressed in a couple games in late January (games 11 and 12) missed five more games, but has played in the last six games. In his 24 minutes of total ice-time on the penalty kill, the Oilers have allowed one goal, and have seen their rate of shots against drop down to 37.37 per hour, which is the best on-ice rate on the team among forwards and well below the team rate of 59.82. Below are the on-ice numbers for the Oilers forwards who have played at least ten minutes on the penalty kill this season.

PlayerGPTOITOI/GPFA/60SA/60GA/60On-Ice SV%
Josh Archibald2357.372.4979.4963.86.2890.16
Ryan Nugent-Hopkins2349.052.1392.9767.2811.0183.64
Jujhar Khaira1432.322.3189.1261.271.8696.97
Kailer Yamamoto2327.071.1855.4242.1211.0873.68
Gaetan Haas824.083.0154.8137.372.4993.33
Kyle Turris1824.031.3487.3864.9112.4880.77
Leon Draisaitl2314.180.6280.3854.998.4684.62
Devin Shore1113.181.20109.23100.1313.6586.36

You expect to see the shots against go up when your top penalty killers are on the ice, as they are typically facing the first powerplay units. But it’s still concerning to see the spike in scoring chances against with Nugent-Hopkins or Khaira on the ice. And you can see why Turris has been taken off the penalty kill and healthy-scratched. Not only do the rate of shots against go up with him on the ice (which aligns with his historical numbers), but he’s posted the worst on-ice rate of goals against (12.48 per hour) – something that coaching staff’s are very sensitive to. Haas really stands out here, and it’ll be interesting to see if Tippett trusts him more and more and what the on-ice shot rates are like with additional responsibility.

Below are the on-ice numbers for the defencemen who have played at least ten minutes. The Oilers are seeing an extra ten shots against per hour on the penalty kill with Russell on the ice, which is likely being masked by the stellar goaltending that he has little to do with. Hopefully Jones can emerge as an option to replace him; he’s played just under ten minutes but has been called out for being on the ice for a goal against, even though the rate of shots drops when he’s been on the ice – definitely something to monitor. And aside from Bear who might be dealing with a head injury, the rest of the group is fine, especially Nurse who has seen the most ice time and has posted on-ice rates of shots against below the team average. Curious to see if Lagesson gets more ice time as his numbers have been solid in limited minutes. The team rate of shots against are similar to Haas’ numbers with him on the ice.

PlayerGPTOITOI/GPFA/60SA/60GA/60On-Ice SV%
Darnell Nurse2366.982.9175.2458.226.2789.23
Adam Larsson2362.052.7083.1662.858.786.15
Slater Koekkoek1734.152.0191.3661.498.7885.71
Kris Russell1530.972.0685.2567.817.7588.57
Ethan Bear1121.871.9982.3268.610.9884.00
William Lagesson814.171.7746.5938.124.2488.89

Whatever the Oilers do at the trade deadline, it’s imperative that they know what they have on the team before spending assets to fill a need that might not exist. The penalty kill is showing signs of improvement, and in limited minutes there appear to be some good internal options who can help suppress shots and scoring chances against. Another reason why I think the Oilers should look within the organization is because the team’s professional scouting department doesn’t exactly have a strong track record at this point. This is the same group that thought Markus Granlund could help the penalty kill, even though his on-ice impacts were poor. And then they thought Turris could help on the penalty kill, even though his on-ice impacts were poor.

Similar to the goaltending position, the Oilers need to evaluate their evaluation process for forwards before spending any more assets on pro players. Until that happens, they’re better off doing a deeper analysis of their penalty kill, looking for internal options and having the coaching staff work with them.

Data: Natural Stat Trick, Hockey Viz