Leaving the University of Alberta Alumni Council

Source: UAlberta.ca

Source: UAlberta.ca

It’s been a fantastic experience with the Alumni Council. Got to meet a lot of people and worked on some great projects over the two years.

In my first year, I was the faculty representative for Extension. In my second year, I was part of the executive team and appointed to the Senate. Got to learn about many different facets of the U of A community and the impact this campus has on the community.

If you’ve ever considered re-connecting with the U of A, I highly recommend getting involved with the Alumni Association. It’s a well run group that has many projects and initiatives underway. I can’t say enough about the volunteers and the supporting staff. The Council has grown over the past year, with a lot of new members coming in. Look forward to seeing what they do they can accomplish in the coming year.

There are also many, many ways to volunteer on campus. There’s a lot of programs and services across campus that are worth checking out and connecting with. Two groups that are doing outstanding work are University Wellness Services and the Office of Sustainability. Highly recommend learning more about what they do.

I’ve categorized all my posts pertaining to the Alumni Council here. Feel free to contact me if you have any questions about it.

Quality Starts Percentage

neuvirth

Adjusted Save Percentage, developed and published by War on Ice, is a very well thought out stat, and I’ve relied on it heavily the past few weeks looking at goalies. Darcy put together a fantastic post recently that looked into the history of the available goalies and found some interesting stuff. Highly recommend checking out his assessment.

I decided to use Darcy’s list of goalies and focus on their percentage of Quality Starts over the past five years. I’ve also included the number of games started in parentheses. Please note, QS% relies on traditional save percentage data (not adjusted) and factors in all situations (even-strength, powerplay, penalty kill).

From Hockey Abstract:

In order to record a Quality Start, the starting goalie must stop at least a league average number of shots (typically 91.3% prior to 2009-10, and 91.7% since), or play at least as well as a replacement-level goalie (88.5%) while allowing two goals or fewer.

The average QS% is 0.530, with anything lower than 0.500 being pretty bad. Having a QS% above 0.600 is very good (Source: Hockey Reference). More on Quality Starts can be found on Habs Eyes on the Prize.

Unrestricted Free Agents
Player Age 2010/11 2011/12 2012/13 2013/14 2014/15
Antti Niemi 31 0.617 (60) 0.529 (68) 0.674 (43) 0.469 (64) 0.542 (59)
Devan Dubnyk 28 0.545 (33) 0.548 (42) 0.541 (37) 0.355 (31) 0.685 (54)
Jhonas Enroth 26 0.538 (13) 0.682 (22) 0.778 (9) 0.538 (26) 0.429 (42)
Karri Ramo 28 0.514 (37) 0.452 (31)
Michal Neuvirth 26 0.477 (44) 0.500 (30) 0.583 (12) 0.692 (13) 0.531 (32)
  • Antti Niemi is a good to average goalie, but he’s too old at this point to invest in. He’ll get paid this summer, but I don’t expect him to get better with age..it just does not  happen.
  • Look at that: Dubnyk was right around the average QS% until that horrendous 2013/14 season. Glad to see he has bounced back.
  • Jhonas Enroth has done well historically, but his value may have taken a hit this past season. This guy has to be a legit target for a number of teams.
  • Ah, and there’s our good friend Michal Neuvirth. He’s only 26 and has put up some nice numbers over the past three years but hasn’t started a lot.
Goalies Under Contract Who Could Be Acquired
Player Age 2010/11 2011/12 2012/13 2013/14 2014/15
Antti Raanta 25 0.545 (22) 0.667 (12)
Ben Scrivens 28 0.455 (11) 0.588 (17) 0.629 (35) 0.373 (51)
Brian Elliott 29 0.333 (51) 0.778 (36) 0.600 (20) 0.600 (25) 0.600 (45)
Cam Talbot 27 0.842 (19) 0.500 (34)
Corey Crawford 30 0.618 (55) 0.491 (55) 0.679 (28) 0.554 (56) 0.696 (56)
Craig Anderson 33 0.592 (49) 0.567 (60) 0.708 (24) 0.500 (52) 0.571 (35)
Jimmy Howard 30 0.476 (63) 0.614 (57) 0.619 (42) 0.500 (50) 0.531 (49)
Jonas Hiller 32 0.565 (46) 0.542 (72) 0.56 (25) 0.540 (50) 0.512 (43)
Jonathan Bernier 26 0.636 (22) 0.462 (13) 0.667 (12) 0.612 (49) 0.481 (54)
Jonathan Quick 29 0.617 (60) 0.632 (68) 0.556 (36) 0.531 (49) 0.58 (69)
Kari Lehtonen 31 0.559 (68) 0.610 (59) 0.600 (35) 0.563 (64) 0.462 (65)
Martin Jones 25 0.722 (18) 0.455 (11)
Robin Lehner 23 0.200 (5) 0.800 (5) 0.833 (12) 0.633 (30) 0.458 (24)
  • I included Ben Scrivens since he’s penciled in, at this point, to be the backup next season.
  • Guys like Annti Raanta and Martin Jones have talent, but just haven’t had enough experience, in my opinion, to make a reasonable bet on.
  • Brian Elliot has been pretty steady when it comes to QS%, but his adjusted save percentages have been all over the map historically.
  • Crawford, Howard, Lehtonen and Anderson are getting up there in age, but they’ve been playing well recently. Their current clubs are going to have to make changes because of the cap, making for an interesting off-season.
  • Jonathan Bernier is another interesting goalie. He’s put up decent numbers and is only 26. He’d be at the top of my wish list.
  • Robin Lehner is another good, young prospect, but I’d be concerned about his health as he’s recovering from a significant concussion. At this point, the Oilers need a legit starter or someone that has enough experience to push for a starting position. Worth noting that he along with Devan Dubnyk and Eddie Lack were impacted by the rule changes around stick length in 2013.

Between what I’ve read and what Darcy has put together, I really don’t know what to think anymore. I’d stick with Scrivens as the backup as I think he can bounce back, similar to other goalies in the past. The starting position has to go to someone that’s in their prime (26-30) and has at least 300 games of NHL experience. I don’t like the idea of over spending on goaltending, so Niemi, to me, is out of the question. If a trade can’t be made to acquire someone like Corey Crawford or Jonathan Bernier, the Oilers may have to push hard for Devan Dubnyk or sign Michal Neuvirth or Enroth to value contracts. Lots of options, so here’s hoping Chiarelli takes a “measured approach”.

Goalies and Voodoo Magic

Jan 29, 2014; Edmonton, Alberta, CAN; Edmonton Oilers goalie Ben Scrivens (30) stops a shot during the third period against the San Jose Sharks at Rexall Place. The Oilers won 3-0. Mandatory Credit: Candice Ward-USA TODAY Sports ORG XMIT: USATSI-138256 ORIG FILE ID:  20140129_lbm_wb4_281.JPG

Without a doubt, one of the weakest links of the Oilers in 2014/2015 was the goaltending. Both Scrivens and Fasth failed to lock down the starter position, finishing the season with adjusted save percentages in the bottom five (goalies who played 20 games or more).

One thing we know about goalies is that a  lot of voodoo is involved. One season, a goalie can be terrible and the next, he’s winning games in the playoffs. One could argue that even assessing goalies involves a lot of guess work and truthiness, as a lot of factors come into play. Which team is the goalie on, how does the team do possession wise, does the team have a strong defensive core, and so forth.

I really want to believe that Scrivens can bounce back. After a good college and minor league career, he had shown well in his NHL career. Unfortunately, things went sideways this past season, but I don’t think we can write him off just yet.

To make a case, I first looked at how he measures up against the average adjusted save percentage (at even-strength) among goalies who played 20 or more games. And secondly, I looked for other goalies who may have had a rough season (or two) and bounced back.

Performance

Let’s start off with Ben Scrivens’ history.

Season Team Gm Age GP W L T/O QS% AdSv%
2011/12 TOR 12 25 12 4 5 2 0.455 91.66
2012/13 TOR 20 26 20 7 9 0 0.588 92.33
2013/14 EDM/L.A 39 27 40 16 16 4 0.629 93.43
2014/15 EDM 57 28 57 15 26 11 0.373 90.88

This past season stands out as his worst in terms of adjusted save percentage (at even-strength) and the number of games he gave his team a chance to win (QS%). His adjusted save percentage, which factors in the quality of shot (low, medium, high danger), as well as his save percentage of high danger shots at even strength, was well below average.

Line-BenScrivens

Last season, and the year prior, he was alright when it came to adjusted save percentage at even strength…right around the average. His save percentage when it came to high danger shots at even-strength were slightly above average two seasons ago, and not too far off the average last season. I should also note that his save percentage when it came to high danger shots was at 82.96 when Eakins was head coach in 2014/2015, and 79.82 when Nelson was head coach. Scrivens’ adjusted save percentage did not change after goaltender coach Freddie Chabot was fired, but his high-danger save percentage went from 83.84 under Chabot to 79.92 under Schwartz (Source: War on Ice). Maybe it was the team tactics under one coach or the fact that Petry was dealt at the deadline, I’m not sure. But those are all factors at play here.

Comparables

In a previous post, I used the percentage of quality starts to find other goalies who had terrible seasons, similar to Scrivens. Goalies that also had QS% below 0.400 since 2007 include well-established netminders like Brian Elliott, Mike Smith, Devan Dubnyk and Semyon Varlamov (Source: Hockey Abstract). I decided to graph each goalies adjusted save percentage compared to the average as well as their high-danger save percentage along with the average. Again, this is for even strength situations and includes netminders who played 20 or more games in a season.

Line-BrianElliott

Line-MikeSmith

Line-DevanDubnyk

Line-Varlamov

Couple notes:

  • I think it goes without saying that goalies can be hard to predict. But when goalies have a bad season, they typically bounce back the following year.
  • Man, Elliott and Smith are all over the map.
  • Our boy Devan Dubnyk was trending well before he had that bad season in 2013/2014. So happy to see him bounce back and get recognized for his accomplishments.

Thoughts

Ben Scrivens has a lot of work to do this summer if he wants to get back to an acceptable performance level. He’s in the last year of a two-year contract and will likely be in the AHL next season if he has another sub-par season. There are only so many roster sports for netminders.

The good news is other goaltenders have had seasons with a QS% below 0.400 but have managed to bounce back and maintain employment at the NHL level. These goalies have also seen their adjusted save percentages take a hit throughout their careers, but have still managed to remain as starters in the NHL. At the end of the day, it’ll be up to Scrivens to put this past season behind him, make the right adjustments in the off-season and put together a solid campaign as an Edmonton Oiler. The club would be wise to assign him the backup role, but I really think he could push for that starter position in 2015/2016.

Goalies with Potential

Source: Edmonton Oilers

Source: Edmonton Oilers

I’m of the mindset that having a young goalie with starter potential would be a smart move by the Oilers. Initially, I thought a goalie like Cam Talbot or Martin Jones, who are currently serving as backups, would be smart acquisitions, similar to how the Leafs acquired Jonathan Bernier in June of 2013 for a second round pick. If a goalie has been successful at the AHL level and has shown well in a limited role at the NHL level, that to me is good enough to warrant at least an assessment.

Alex Thomas, who does excellent work at the Oilers Rig, recently put a case together for acquiring Cam Talbot from the Rangers. The 27 year old played well while Lundqvist recovered from an injury. But his stats and style of play, to me, aren’t anything outstanding. In fact, his numbers at the NHL level and other leagues are somewhat similar to that of current Oilers netminder Ben Scrivens.

Here’s their NHL seasons to date. (Source: Hockey Reference)

Cam Talbot
SEASON TEAM LEAGUE GP W L OT  PCT SO
2013-14 NY Rangers NHL 21 12 6 1 0.941 3
2014-15 NY Rangers NHL 36 21 9 4 0.926 5
Ben Scrivens
SEASON TEAM LEAGUE GP W L OT PCT SO
2011-12 Toronto NHL 12 4 5 2 0.903 0
2012-13 Toronto NHL 20 7 9 0 0.915 2
2013-14 Total LA/Edm NHL 40 16 16 4 0.922 4
2014-15 Edmonton NHL 57 15 26 11 0.890 1

Here’s a summary of each netminders overall stats by league:

Cam Talbot
LEAGUE GP W L OT MIN. PCT SO
NHL 57 33 15 5 3306 0.931 8
AHL 116 54 52 5 6611 0.914 8
ECHL 2 1 0 1 122 0.921 0
CHA 70 15 44 3861 0.909 2
Ben Scrivens
LEAGUE GP W L OT MIN. PCT SO
NHL
129
42
56
17
7135
0.905
7
AHL 94 49 34 7 5547 0.923 8
ECHL 13 10 3 0 779 0.938 0
ECAC 117 65 37 6708 19

Both goalies have come through the college ranks and have performed well at the AHL level. There’s no denying that they both have potential to be decent at the NHL level. The issue for Oilers fans is that Scrivens faltered badly last year in his first real attempt to be a starter, while Talbot appears to be ready for his first shot.

In my opinion, if you want a “goalie with potential” for next season, stick with Ben Scrivens. Two reasons:

One, Scrivens won’t cost you anything. He”ll make a very reasonable $2.3 million next year becoming a free agent in July of 2016 (Source: NHL Numbers). Talbot, on the other hand, will likely cost the Oilers either a draft pick or a young prospect in return. Goalies are not worth first round picks. And goalies are not worth high end prospects like Nail Yakupov. Nothing of that calibre should be in play. Goalies should never command that kind of return as there are a limited number of goalie jobs and more than enough professional goalies available. If the price for Talbot is high, the Oilers could always consider trading for similar “starter potential” goalies like Martin Jones, Antti Raanta or Andrei Vasilevskiy. But it’d be much wiser to spend existing assets on positions that are harder to fill such as defence.

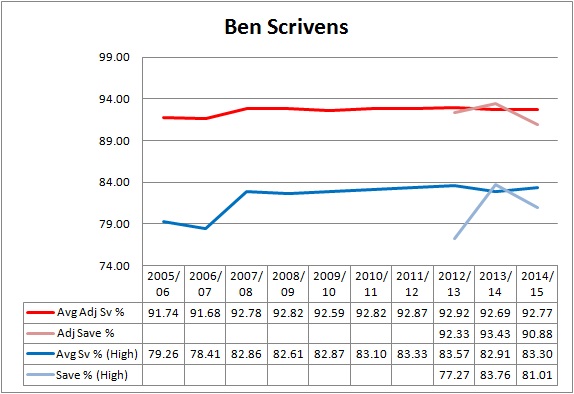
Secondly, I’m fairly confident that Scrivens will bounce back from his horrific 2014/2015 season. Good to average goalies like Scrivens are susceptible to bad seasons, and typically get back to their standard level of performance soon after. We know Scrivens can play at the AHL level and he has done well in the three seasons prior at the NHL level.

One stat that’s worth paying attention to is the percentage of quality starts. Here’s a summary of the metric from from Habs Eyes on the Prize:

A Quality Start (QS) is a goaltending statistic that is awarded to a goaltender who gave his team a reasonable chance to win a game. This is quantified by the goaltender’s save percentage within an individual game itself and comparing it to the league standards for an average SV%, and the established ‘replacement level’ SV% if the goalie faces a low amount of shots faced in a given game (usually less than 20). If a goalie outperforms the league average save percentage, he is awarded a quality start. Additionally, a goalie is awarded a quality start if he allows 2 goals or less while keeping his save percentage above the expected performance of a replacement level goaltender.

Scrivens finished with a QS% of 0.396 this past season, which was second last among goalies who played a minimum of 20 games. In last place: Victor Fasth at 0.375. The league average for goalies is around 0.530. Worth noting that Scrivens has had a respectable QS% in the past. (Souce: Hockey Abstract).

Ben Scrivens
Season Team GS SV% QS%
2011-12 Toronto 11 0.9063 0.455
2012-13 Toronto 17 0.9116 0.588
2013-14 LA/Edmonton 35 0.9262 0.657
2014-15 Edmonton 53 0.8879 0.396

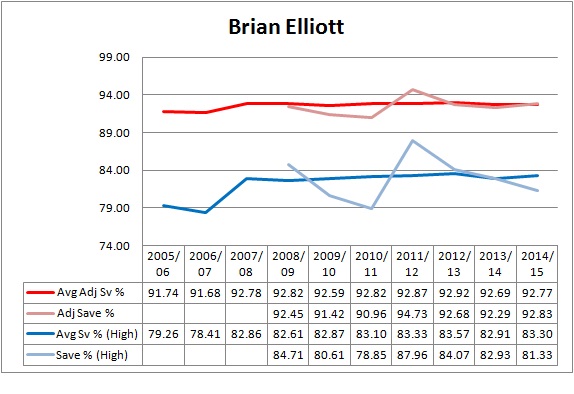
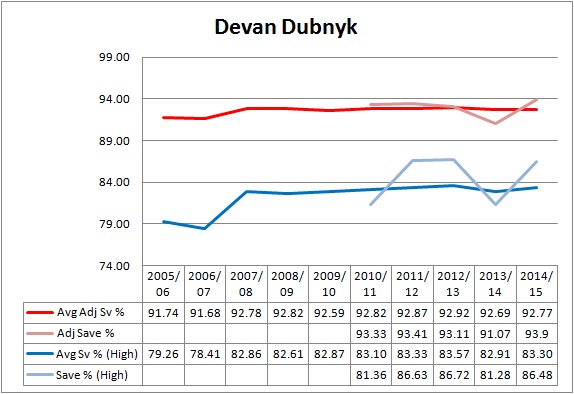
The good news is that other good goalies have had horrific seasons similar to Scrivens’ 2014/2015 campaign. Of those that finished with a QS% below 0.400 since 2007, the vast majority have bounced back and managed to have decent careers. A few of the notables.

Brian Elliott
Season Team GS SV% QS%
2007-08 Ottawa 1 0.9655 1.000
2008-09 Ottawa 30 0.9024 0.500
2009-10 Ottawa 48 0.9100 0.563
2010-11 Ottawa/Colorado 51 0.8940 0.333
2011-12 St. Louis 36 0.9401 0.778
2012-13 St. Louis 20 0.9034 0.600
2013-14 St. Louis 25 0.9237 0.640
2014-15 St. Louis 45 0.9170 0.578
Cam Ward
Season Team GS SV% QS%
2007-08 Carolina 67 0.9042 0.567
2008-09 Carolina 68 0.9158 0.618
2009-10 Carolina 45 0.9162 0.556
2010-11 Carolina 73 0.9223 0.589
2011-12 Carolina 68 0.9151 0.559
2012-13 Carolina 16 0.9075 0.438
2013-14 Carolina 28 0.9004 0.393
2014-15 Carolina 50 0.9085 0.560
Devan Dubnyk
Season Team GS SV% QS%
2009-10 Edmonton 16 0.8870 0.313
2010-11 Edmonton 33 0.9155 0.545
2011-12 Edmonton 42 0.9172 0.548
2012-13 Edmonton 37 0.9199 0.541
2013-14 Edmonton/Nashville 31 0.8895 0.355
2014-15 Arizona/Minnesota 55 0.9300 0.673
James Reimer
Season Team GS SV% QS%
2010-11 Toronto 35 0.9202 0.571
2011-12 Toronto 34 0.9004 0.353
2012-13 Toronto 31 0.9235 0.516
2013-14 Toronto 32 0.9108 0.469
2014-15 Toronto 27 0.9056 0.444
Mike Smith
Season Team GS SV% QS%
2007-08 Tampa Bay 32 0.9040 0.469
2008-09 Tampa Bay 40 0.9151 0.625
2009-10 Tampa Bay 36 0.9035 0.389
2010-11 Tampa Bay 20 0.9021 0.500
2011-12 Arizona 66 0.9294 0.636
2012-13 Arizona 34 0.9104 0.441
2013-14 Arizona 61 0.9152 0.574
2014-15 Arizona 61 0.9044 0.475
Semyon Varlamov
Season Team GS SV% QS%
2008-09 Washington 5 0.9216 0.800
2009-10 Washington 23 0.9068 0.478
2010-11 Washington 25 0.9239 0.720
2011-12 Colorado 52 0.9125 0.577
2012-13 Colorado 33 0.9027 0.333
2013-14 Colorado 60 0.9284 0.733
2014-15 Colorado 57 0.9213 0.579

Obviously, each goalie had their own unique situation, and there are always 1,001 factors that impact goalie performance. But the general trend is that goalies who have a poor QS% one year, tend to bounce back soon after. Scrivens has his work cut out for him this summer if he wants to improve. But in my mind, the Oilers should retain him as their “goalie-with-potential” paired with an established netminder this coming season, and avoid sending away assets for guys like Cam Talbot.