Assessing the forwards away from McDavid

With the expansion draft coming up and the start of free agency soon after, there’s been a lot of discussion around the ways in which the team could improve certain areas of the roster and which players the Oilers should send away to make things happen. And it’s really been the forwards, including Ryan Nugent-Hopkins, Jordan Eberle and Benoit Pouliot, that have been discussed as being potentially moved to acquire required assets.

Before jumping to trade possibilities, something I wanted to see was how each Oilers forward did this past season at even-strength (5v5) in terms of on-ice goal-share and on-ice shot share, but with one catch. Because the Oilers as a group were much better with McDavid than without him, I wanted to see how each player did when the captain was on the bench.

Oilers (5v5) CF% GF% Sh% Sv% PDO
With McDavid 52.9 62.1 10.74 92.41 103.15
Without McDavid 48.2 48.9 6.97 92.86 99.83

The issue for me with last season’s team is that they should not have been getting outscored and out-shot when they were without their best player. There’s enough talent among the forwards, and an experienced coaching staff behind the bench, that they should have been able to reach at minimum a 50% share of shots and goals. Depth is going to be critical for long-term success, so I think it’s important to know, before any forwards are moved out, which ones have done well away from McDavid and which one’s may have been relying a little too much on him.

Below is a table of the regular forwards from the 2016/17 regular season, and what their on-ice shot share and goals-shares were at even-strength (5v5) when McDavid was on the bench. I’ve also included each forwards on-ice shooting and save percentage to see if there were any external factors impacting their on-ice goal share. The table is sorted by Corsi For%.

20170602 - Oilers forward without McDavid - 2016-17 - Reg

Full article is at The Copper & Blue.

Nugent-Hopkins on the Penalty Kill

Over the two seasons with Todd McLellan and his coaching staff behind the bench, the Oilers penalty kill remains pretty average. In the 2016/17 regular season, the Oilers finished 16th overall when it came to goals against/60 with 6.38, a slight improvement from the year prior when they finished 19th in the league with 6.53 goals against/60.

Looking at the rate of unblocked shot attempts against (i.e., Fenwick), which can tell us if a team’s penalty kill success is sustainable or not, the Oilers finished 15th in the league with 74.0 events against per hour in 2016/17. A lot of the Oilers success shorthanded has been thanks in large part to their goaltending, which for two years in a row now has been just above league average.

Season Goals Against/60 Fenwick Against/60 Save%
2015/16 6.53 (19th) 75.5 (23rd) 87.7 (13th)
2016/17 6.38 (16th) 74.0 (15th) 87.7 (14th)

Related: The Oilers Penalty Kill is Killing Penalties Again (2017, March 31)

Something that stands out when you dig into the most recent season is how poorly Ryan Nugent-Hopkins performed when the team was shorthanded. After six NHL seasons, and 395 regular season games, he’s developed a reputation as being a responsible centerman and capable of taking on tougher match-ups. He’s a smart, skilled player, skates well and does a great job of stripping the puck away from opponents, all of which should make him an ideal option when the team is shorthanded. So it’s surprising to see that when Nugent-Hopkins was on the ice this season on the penalty kill, the rate of unblocked shots actually increased considerably.

Below are the Oiler forwards who played at least 40 minutes shorthanded (4v5) this past season and their rate of unblocked shot attempts relative to the team average.

EDM - 4v5 - RelTM - Forwards

Here we see that when Nugent-Hopkins was on the ice, the rate of unblocked shot attempts was 82.19 per hour, and 13.42 higher than the team average. To put things into perspective, the worst team at suppressing shots against when shorthanded was Buffalo (90.4 per hour), followed by Arizona (81.9 per hour). And among the 101 NHL forwards who played at least 100 minutes shorthanded (4v5) this past season, Nugent-Hopkins had one of the worst rates of shot attempts against, relative to team average (97th out of 101).

What’s worth noting here is that heading into the 2016/17 season, Nugent-Hopkins had some decent success shorthanded. He didn’t get tasked with killing penalties until his third season, as the Oilers had experienced centermen like Shawn Horcoff, Eric Belaner and Boyd Gordon as regular options. But over the three seasons prior to 2016/17, he’d been pretty reliable when it came to suppressing unblocked shot attempts against.

Full article is at The Copper & Blue.

Things to Consider Before Splitting up the Second Line

The line of Ryan Nugent-Hopkins, Jordan Eberle and Milan Lucic is taking some heat because of their lack of production, especially at even-strength (5v5). Over the nine games this post-season, Lucic and Eberle each have an assist, while Nugent-Hopkins has not registered any points at even-strength. As a trio, their on-ice goal-share is 25%, as they’ve been on the ice for one goal-for and three goals against. But before splitting them up, there are a couple things to consider.

  1. The trio have played the most minutes together this post-season for the Oilers (85.37 minutes) and have often been out against the other team’s top lines.
  2. In the previous series, they played the most minutes against Pavelski and Thornton. Currently, they’re playing the majority of their minutes against Ryan Getzlaf.
  3. There have been 45 different line combinations across the league this post-season that have played at least 30 minutes together. Among the 45, the trio rank 7th in terms of adjusted Corsi For% and Fenwick For%. They rank 13th when it comes to Expected Goals.
Metric (5v5) Share Rank
Corsi For% 58.40% 7th
Fenwick For% 59.08% 7th
Expected Goals For% 55.83% 13th


4. The underlying numbers they have posted together in the playoffs are consistent with their numbers from the regular season. Over 330 minutes, the second most on the Oilers, they finished the year with a goal-share of 50.0%.

5. The Oilers as a team have the following numbers this post-season: Corsi For% – 49.92%, Fenwick For% – 47.55% , Expected Goals For% – 48.06% , Goals For% – 42.86% (12 goals for, 16 goals against). The club overall is a better team when RNH, Eberle and Lucic are on the ice together. Their relative-to-team stats are solid.

Line TOI CF% FF% xGF% GF/GA
Lucic-RNH-Eberle 85.37 57.65 58.47 55.13 1-3
Maroon-McDavid-Draisaitl 57.60 48.82 41.38 43.53 4-2
Caggiula-McDavid-Draisaitl 33.15 58.23 54.55 66.22 1-0
Caggiula-Letestu-Kassian 44.64 40.00 39.39 37.35 0-1
Pouliot-Desharnais-Slepyshev 46.43 46.51 50.00 53.82 2-0

6. When RNH, Eberle and Lucic are on the ice together, the team has a penalty differential of +4, which is the best differential among the 45 different line combinations. The team has drawn 5, Eberle himself has drawn 3, and taken 1. Only three line combinations have not been on the ice for a penalty against their team. The Oilers powerplay is good and needs to get as many opportunities as possible.

7. This line is above average when it comes to generating shot attempts and unblocked shot attempts (per 60), ranking 13th among the different line combinations this post-season.

8. This line is above average when it comes to suppressing shot attempts and unblocked shot attempts (per 60), ranking near the top 10.

9. RNH, Eberle and Lucic finished the season with a shooting percentage of 6.13%. They’re currently at 2.13%.

Data: Corsica Hockey, Natural Stat Trick

Full article is at The Copper & Blue.

Comparing the Regular Season Match-ups Between the Oilers and Ducks

cut (1)

With the Oilers preparing for round two against the Anaheim Ducks, it’s worth checking out how the two teams did against each other during the regular season, and focus on what the on-ice match-ups were like.

In their five games against the Ducks, the Oilers went 3-2, outscoring them 14-12, and 9-6 at even-strength. Neither team allowed a shorthanded goal against, but the Oilers did score three powerplay goals, while the Ducks scored four with the man advantage. The Oilers had the edge in goaltending, as their team save percentage against the Ducks at even-strength was 94.4%, while the Ducks’ team save percentage was 92.9%.

Over those five games, the Oilers posted a better share of the total shot attempts with 54.2% (247-209). Heading into the playoffs, the Oilers struggled possession-wise as they had a 48.09% share of shot attempts over their final 25 games (one of the lowest in the league), while the Ducks posted a 49.85% share.

There’s going to be plenty of chatter about how each coach will deploy their personnel, so I thought it’d be interesting to break down how each of the Oilers regular centermen did against the Ducks centermen over the five regular season games. As we saw in the first round, there’s plenty of line-matching going on, not only in the past series but across the league, and it’ll likely continue against the Ducks.

Here’s how McDavid did against the three most common centers for Anaheim.

McDavid Vs TOI CF-CA CF% GF-GA
Kesler 50.01 49-37 56.98 3-1
Getzlaf 21.61 34-17 66.67 2-0
Vermette 10.45 14-6 70.00 1-0

McDavid saw a lot of Kesler in those five games, and won the share of shot attempts (56.98%). What’s worth noting is that Draisaitl was with McDavid for 36 of the 50 minutes and posted a Corsi For% of 57%. Without Draisaitl with him, McDavid still posted a strong Corsi For%, 56.1%. And when Draisaitl was away from McDavid, or didn’t have him on the ice with him, the coaches tried not to send him out against Kesler at all (less than two minutes total). And in 20 minutes against Getlzaf and 10 minutes against Vermette, McDavid was pretty dominant. It’ll be interesting to see how the Ducks try to contain him over a seven-game series.

Below is how Nugent-Hopkins did against the same trio of Ducks. His most frequent opponent was Getzlaf, who he fared well against possession-wise, but the results (i.e., goals) weren’t there.

RNH Vs TOI CF-CA CF% GF-GA
Getzlaf 37.77 31-30 50.82 0-2
Vermette 15.75 19-14 57.58 1-0
Kessler 13.53 14-10 58.33 0-0

We saw how well Nugent-Hopkins did shutting down Pavelski and Thornton on a line with Lucic and Eberle in the previous series, so his performance will be something to watch. RNH struggled over the course of the regular season, but his results improved as the playoffs approached.

Below is how Mark Letestu did over the regular season against the Ducks. His most frequent opponent was Antoine Vermette, who he’ll likely see a lot of in the upcoming series.

Letestu Vs TOI CF-CA CF% GF-GA
Vermette 12.55 12-9 57.14 1-0
Getzlaf 11.10 9-11 45.00 0-1
Kesler 4.85 4-2 66.67 0-0

Some decent results for Letestu against the Ducks over the year, which has me thinking the coaching staff will start the series keeping Draisaitl on the top line with McDavid to take on Kesler’s line, which include Silfverberg and Cogliano. Letestu should probably get more of the depth minutes than Desharnais, but I’d expect Draisaitl, or maybe even McDavid, get double-shifted to give the third line a boost. The problem for the Oilers is that Corey Perry has been moved around the roster, and has spent time alongside Vermette as well. So the Oilers really can’t take that line for granted. Letestu also struggled possession-wise against the Sharks depth players, so it’ll be imperative that the coaching staff make adjustments against a deep Ducks roster.

Data: Natural Stat Trick, Puckalytics, Hockey Reference

Full article is at The Copper & Blue.

The Weakest Link

What’s becoming increasingly obvious early on in the 2017 post-season is the importance of generating offence from across all four lines. While star players are fully expected to lead their teams in scoring, making a deep run in the playoffs often requires a group of supporting players that can contribute on a consistent basis. We’ve seen already the importance of depth players in the Leafs-Capitals series, and we’ll likely see more of that across other series as the playoffs go on.

After two games, the Oilers have received scoring from an array of players, at different game-states, which will need to continue if the club expects to have success in the playoffs. While the first two lines have plenty of talent and experience, and the third line featuring Letestu, Caggiula and Kassian had shown well in game two on Friday night, it’s the fourth line that might be the team’s weakest area. And it’s the play of David Desharnais in particular that the team may need to address, and fast.

In game one when the Oilers could only generate 31 shot attempts, and allowed 54, Desharnais was on the ice for one shot attempt for, and seven against in just over five minutes of ice time at even-strength. This didn’t seem so bad considering the whole team, except for Talbot, was dreadful in that overtime loss. But in game two when the Oilers outshot the Sharks 47-21, and really dominated the game, the team was again outshot when Desharnais was on the ice, this time going 2-5 in six and a half minutes of ice time.

It’s clear the coaching staff doesn’t really trust the 30-year old centerman, as Desharnais’ ice time in the first two games of the playoffs is well below the 10.73 minutes he averaged in his 18 regular season games with Edmonton since being acquired at the deadline. He’s not a powerplay or penalty kill option either, making him a fairly one dimensional player that the coaching staff typically deploys against the other team’s third and fourth lines.

Desharnais’s poor showing after the first two games isn’t all that surprising. In the 18 regular season games he played with Edmonton, he scored four points (2 goals, 2 assists), all coming within his first six games. Over the remaining 12 games, he mustered nine shots and not much else, which is disappointing considering his nice start and the fact that he often played the weakest competition.

His on-ice numbers at even-strength were fairly poor as well over the 18 games, as the Oilers were outscored (10-9) and regularly out-shot when he was on the ice.

20170416___Desharnais___WOWY

 
Full article is at The Copper & Blue.

The Oilers Powerplay Could Be the Difference Against San Jose

cut

In their season series against the Sharks this season, the Oilers won three of the five games, going 3-1-1, outscoring them 16-13. Worth noting that at even-strength, the goals were even at eleven apiece, with the Sharks posting the better Corsi For%. Where the Oilers excelled at was on special teams, as they scored three powerplay markers and one shorthanded.

The key now will be for the Oilers to continue scoring on the powerplay in the post-season when games get tighter and even-strength scoring opportunities could slide.

The Oilers powerplay finished fifth in the league, and first in the western conference, when it came to goals for per 60 with 8.34. Their rate of unblocked shot attempts was consistently above league average with 72.31 per hour, which ranked 8th overall and indicates that not only was the powerplay effective, but the results are sustainable.

The scoring rate took a bit of a dip this season, but because the shot rates were consistently good, it was expected that it would eventually improve. The main drivers of the powerplay were Connor McDavid and Mark Letestu as the team generated over 80 Fenwicks per hour with either of them on the ice. Lucic (25), Draisaitl (25) and McDavid (23) were the top three scorers on the powerplay, with Klefbom leading defencemen with 14.

Full article is at The Copper & Blue.

The Oilers’ Penalty Kill is Killing Penalties Again

pouliot

One area that the Oilers have struggled with this season is their penalty kill. In the first few months of the 2016/17 season, things were looking great, as the club ranked in the top five when it came to goals against per hour. But looking deeper into the numbers, their success early on did not appear to be sustainable as they allowed one of the highest rate of unblocked shots against per hour and were basically being bailed out by stellar play from Cam Talbot.

Over December and January, the rate of shots remained high and the goaltending began to regress, sinking the OIlers penalty kill down the overall rankings. By the end of February, the team sat 19th in the league in terms of goals against per hour, brutal considering they ranked as high as third in the first few months. But it was somewhat expected as they allowed the 10th highest rate of unblocked shots against by that point.

It appears however, that the Oilers penalty kill is coming back to life.

Outstanding efficiency in those past 10 games, and it appears the goals against per hour heading into Thursday night’s game against San Jose was the second best in the league. What’s especially encouraging is the fact that their recent success was legitimate in March, and didn’t rely solely on Talbot, as the rate of unblocked shot attempts against also improved.

What I’ve done below is break out the Oilers penalty kill performance by month this season, and included how they rank overall in the league. I’ve included the actual goals against per hour, along with the unblocked shot attempts against (Fenwick), and the team save percentage. And just for fun, I’ve included the team’s faceoff percentage each month, only because there was a lot of chatter about faceoffs being a reason why the Oilers penalty kill was struggling.

Month Games TOI Goals Against/60 Fenwick Against/60 Save% Faceoff %
October 9 54.40 3.31 (5th) 77.21 (28th) 94.12 (4th) 36.92 (29th)
November 14 74.61 4.02 (7th) 65.14 (11th) 90.74 (7th) 43.24 (21st)
December 14 76.52 7.06 (22nd) 62.73 (12th) 85.00 (22nd) 46.15 (12th)
January 14 65.78 5.47 (16th) 71.15 (20th) 89.83 (8th) 46.58 (13th)
February 12 45.73 13.12 (30th) 78.72 (26th) 76.19 (29th) 36.96 (30th)
March 11 43.98 2.73 (1st) 54.57 (7th) 92.00 (3rd) 35.71 (29th)
TOTAL 74 361.02 5.82 (16th) 67.97 (17th) 87.97 (13th) 42.74 (24th)


Heading into Thursday’s game, the Oilers rank 16th in the league when it comes to goals against, and 17th when it comes the rate of unblocked shots. And goaltending is slightly above league average now. This jump in the league rankings is thanks in large part to an outstanding March, where the club’s rate of unblocked shots against was one of the best in the league, and a big drop from where they were earlier in the season. Their 2.73 goals against per hour was the best in the league, and a part of that be attributed to Talbot’s play as his numbers bounced back from a poor month of February. Worth noting that Talbot’s performance on the penalty kill has historically been pretty solid, as he held a 90.52% save percentage over his 113 NHL games prior to this season. The 92.0% team save percentage in March isn’t likely to stay at that level, but the team could withstand a slight drop-off in Talbot’s play as the shot rates against are way down.

Also worth noting that the Oilers continue to struggle when it comes to faceoffs when shorthanded, yet it didn’t exactly matter in March as they limited the rate of shots against and got strong goaltending. Faceoffs do matter, but not to the extent that some might think.

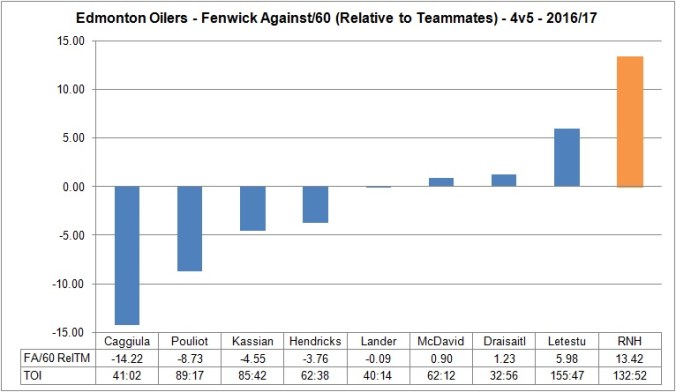
As noted above, Benoit Pouliot has been playing well since his return to the lineup, and has seen more time on the penalty kill. He’s in one of the toughest seasons of his career, posting abysmal numbers at even-strength, but he does appear to be turning things around. Among the forwards who have played at least 25 minutes on the penalty kill this season, he has the best on-ice Fenwick Against per hour, relative to the team average. When he’s on the ice, the rate of shot attempts against drops by 11.8 shots against per hour compared to the team’s average, indicating his positive influence. Last season, he was rarely used on the penalty kill, only playing 23 minutes, but even in his limited appearances, the shots against dropped considerably relative to the team average (-16.01). And in 2014/15, the unblocked shots against dropped by 10.9 when he was on the ice.
Pouliot is clearly an effective player shorthanded, so we should expect to see the coaching staff roll him out regularly. The other player worth watching for is Zack Kassian, who has played 76 minutes on the penalty kill this season, and also has an on-ice Fenwick against per hour below the team average (-4.44). Both he and Pouliot have seen more ice time recently, at the expense of Matt Hendricks, who has been in and out of the lineup.

Whatever the Oilers are doing in terms of deployment and tactics on the penalty kill, the results have been there and appear to be sustainable for the most part. All positive signs heading into the post-season when special teams becomes even more critical.

Data: Corsica Hockey, Hockey Analysis

Full article is at The Copper & Blue.

A Look Into the Oilers’ Declining Possession Numbers

Now that the Oilers have clinched a playoff spot, the question is how far can they possibly go.

Heading into last night’s game, the Oilers ranked 7th in the league, and 3rd in the Western conference behind Minnesota and Chicago, in even-strength goal-share with 53.93%, having out-scored their opponents 151-129. The Oilers powerplay has been very good as well, ranking second in the league when it comes to goals for per 60. And it appears their success is sustainable with the man-advantage as the club generates the sixth highest rate of unblocked shots-for per 60.

The one issue for the Oilers is that possession wise, they have slid down to 19th in the league sitting at a 49.66% Corsi For percentage, which indicates their goal-share at even-strength might not exactly be sustainable. What’s even more concerning is that over their last 25 games, which would go back to the end of January, the team’s Corsi has been 47.46%, a number that the bottom-feeders of the league typically post. To make matters worse, while the team continues posting a respectable Corsi For% with McDavid on the ice, over the last 25 games, without McDavid the Oilers have a Corsi For% of 45.48%.

20170328 - Team CF

Why does Corsi For% matter?

What we’ve seen from the past three playoff tournaments is that team’s increase their odds of winning a championship if they can post a respectable Corsi For% over the final stretch of games heading into the post-season. By no means are teams guaranteed success, but it’s a positive indicator if you’re out-shooting the opposition and posting better possession numbers.

Here’s a a quick glance at the four conference finalists from the past three playoffs, and what their Corsi For% was over their final 25 regular season games.

2016

Tampa Bay – 51.5%
Pittsburgh – 54.9%
San Jose – 52.7%
St. Louis – 54.7%

2015

Tampa Bay – 50.9%
New York Rangers – 48.7%
Chicago – 52.4%
Anaheim – 52.0%

2014

Montreal – 46.9%
New York Rangers – 53.2%
Chicago – 55.8%
Los Angeles – 57.3%

Only two of the last twelve conference finalists posted a Corsi For% less than 51%: the 2014 Montreal Canadiens and the 2015 New York Rangers. Worth noting that both of these clubs had elite goaltending in those seasons, ranking in the top three at even-strength save percentage, that may have been masking their issues. While the Oilers do have a solid netminder in Cam Talbot, the team’s overall save percentage at even-strength this season has hovered around league-average for the most part. And it’s doubtful, at this point, that it would be enough to cover the team’s larger deficiencies.

If we break out the rate of shot attempts for and against over rolling 25-game segments, we see that while the team’s ability to generate offence has dipped, it’s remained around league average for the most part. And that’s thanks in large part to McDavid, as the club generates 60.8 shot attempts per 60 with him on the ice, and only 52.51 without him.

Full article is at The Copper & Blue.

Holding Back McDavid

Enough can’t be said about Connor McDavid and the great season he’s been having. He currently leads the league in points with 85, including 57 assists. The Oilers are a different, much more offensive team with him on the ice, posting a higher share of shots, scoring chances and goals at even-strength (5v5).

Breaking out his on-ice numbers at even-strength into rolling 25-game segments, we see that for the most part the Oilers’ share of events have regularly been well above the break-even point when McDavid is on the ice. These really are remarkable numbers for a second-year forward, and it’s possible that the best is yet to come.

The one metric that stands out in the graph above is the team’s share of shot attempts in blue (Corsi For%) and unblocked shot attempts (Fenwick For%) with McDavid on the ice, as it’s been steadily declining since around mid-January sitting just barely over 50%. Over the course of the season, the Oilers have posted a 52.95% share of the shot attempts with McDavid on the ice. But since mid January, that share has dropped down to 49.89%.

There’s nothing about McDavid’s game that suggests he might be the problem: he’s been healthy, he continues to play his usual style to generate chances, he’s been shooting around the same frequency all season and he’s been very productive on a line with Patrick Maroon and Leon Draisaitl.

One of the factors likely impacting McDavid’s on ice Corsi For% is the defence pairing of Andrej Sekera and Kris Russell. This season, the pair have regularly played top four minutes for the Oilers and have a Corsi For% of 44.84% at even-strength, one of the worst shares on the team and in the league among regular pairings. What’s most concerning is that their play together has been getting progressively worse, and it’s starting to impact the productivity of one of the best players in the world.

Below is a graph containing the Corsi For% when McDavid is on the ice with one of the two most common defence pairings this season: Larsson/Klefbom, and Russell/Sekera. These two pairings have really been the Oilers top four this season, and have played similar levels of competition. What I’ve done here is break out the season into two: the games up to and including January 10th, 2017, and games since that date.

Here we see that McDavid has posted slightly better numbers more recently with the Larsson-Klefbom pair, going from 49.2% before January 10th, to 51.3% since. With Russell and Sekera, McDavid was posting a 48.2% share of shot attempts, but that number has dropped considerably to 43.8% since mid-January. If we’re wondering why McDavid’s own on-ice Corsi For% has been dropping, we may have found one of the main drivers of it.

These are the kinds of numbers a coaching staff needs to address, as a critical piece of their offence is being negatively impacted by a poor defence pairing. There’s no question that Sekera and Russell are capable NHL defencemen, but it’s become obvious that as a pairing they’ve been doing more harm than good. Russell is playing above his established NHL level, and is better suited on his left-side, in more of a depth role and can contribute on the penalty-kill. And Sekera has had more success when paired with a right-handed defenceman. This season, paired with rookie Matt Benning for just under 200 minutes, the duo have a Corsi For% of 58.01%, the best on the team, and a goal-share of 58.82%. With McDavid on the ice with them, the Oilers have posted a Corsi For% of 56.8%. And in 2015/16, when Sekera was paired with Mark Fayne and took to the ice with McDavid, the Oilers posted a Corsi For% of 51.1%.

Whatever the Oilers do, they have to ensure that their best player is in a position to generate offence. McDavid is the key driver for the club, as their season and post-season success, will depend on his performance. It’s obvious that there’s an issue with the club when the team’s possession numbers are sliding with their best player on the ice. Finding a solution could be as simple as tweaking the defence combinations and deploying players differently. Or it could require system adjustments, possibly moving away from a dump-and-chase style, that accommodates the skill and speed of their best players. Generating offence has to be the goal and maximizing McDavid’s potential is going to be critical today and going forward.

Full article is at The Copper & Blue.


Another Look Into the Oilers Secondary Scoring + Radio spot (TSN 1260)

Joined Lowetide on Monday morning on TSN 1260 to talk Oilers. Clip is below and starts around the 25 minute mark.


One of the more interesting issues around the Edmonton Oilers this season has been the performance of the team when Connor McDavid hasn’t been on the ice. The second-year forward has been an absolute offensive force for the club, consistently using his skill and speed to lead the attack and create scoring opportunities at will. Over the course of the season, the Oilers as a team have maintained a decent share, right around league average, of the shot attempts, scoring chances and goals, thanks in large part to the play of McDavid.

What we’ve come to realize though after 71 games is that the Oilers are icing two very different teams: one with McDavid that can outshoot and outscore opponents, and another one without McDavid on the ice that posts numbers below league average. With McDavid on the ice at even-strength (5v5) this season, the Oilers have an incredible goal-share of 61.17% (outscoring opponents 63 to 40). Without McDavid on the ice, the team can only muster a goal-share of 48.72%, having been out-scored 80-76. When it comes to shot-metrics, which are used to predict future goal-share, the Oilers have a Corsi For% of 53.16% with McDavid on the ice, having outshot opponents 1,151 to 1,014. Without McDavid, the team has a Corsi For% of 48.49%, below league average and a troubling number considering the expensive personnel on the roster. Please refer to the Appendix for descriptions of the five metrics.

Now the good news is that the secondary lines have recently been contributing more. Jordan Eberle appears to have bounced back from his poor start and has been productive on a line with Ryan Nugent-Hopkins and Milan Lucic. The trio have played 220 minutes together so far, and hold a Corsi For% of 51.39%, scoring five even-strength goals together and allowing six. The newly formed trio of Montreal castaways featuring Benoit Pouliot, David Desharnais and Zack Kassian have now played roughly 48 minutes together, outscoring opponents 4-2 (a goal-share of 66.7%), and getting 48.8% of the shot attempts. Worth noting that this line is riding a 17.4% shooting percentage, which is likely to drop off eventually.

While the goal-scoring has improved without McDavid on the ice, a closer look at the shot metrics indicates that the secondary offence is still sputtering. Below is a graph with the five metrics broken out into rolling 25-game segments, capturing the team’s performance without McDavid.

C7X5-4dUwAA61sq

Full article is at The Copper & Blue.