Who has the edge between the Oilers and Kings?

With the first round of the playoffs set to begin, I wanted to get a sense of how both teams finished the season, what their key drivers were and how individual players performed.

The Oilers we know had a great season, going 14-7-4 in their final twenty-five games of the regular season, a points percentage of 0.640 – eighth best in the league and fourth best in the west behind Dallas (0.740), Nashville (0.740) and Colorado (0.660). The Oilers goal-share in all situations over these last twenty five games was fourth highest in the league (57.69 percent), posting a +24 goal-differential due in large part to their even-strength play. The powerplay and penalty kill slipped a bit in this last stretch, but was still around league average. More on that in a minute.

The Kings had similar results to the Oilers over their final twenty-five games, going 15-9-1 – which translates into a 0.620 points percentage that ranked tenth highest in the league. Similar to the Oilers, they posted an excellent all-situations goal-share in this period (57.55 percent), with a +21 goal differential that was fourth highest in the league. A lot of their success was at even-strength, as well as on their penalty kill.

Even-strength (5v5)

Here’s how the two teams performed at even-strength (5v5) over their final twenty-five games. Both clubs ranked near the top of the league for the majority of the metrics.

Team (5v5, last 25 games) Oilers Kings
Points% 0.640 0.620
Corsi For% 54.82 51.06
Fenwick For% 54.47 52.45
xGoals For% 56.34 53.39
Goals For% 60.67 61.36
Shooting% 9.32 9.64
Save% 92.45 93.40

The two clubs are fairly evenly matched when it comes to shot-share metrics, with both teams ranking near the top of the league for most of the season. For example, the Oilers posted a Corsi For percentage of 55.52 percent over the course of the full season (third highest in the league), while the Kings ranked fourth with 54.68 percent. Where the Kings have excelled at is on the defensive side of things, as their rate of shots and chances against have consistently been in the top five all season. Also worth noting that while the Kings full-season shooting percentage of 7.82 percent ranked 26th in the league, they had the ninth best shooting percentage over these last twenty five games. Full details on how the Oilers and Kings rank within the western conference can be found here.

Goaltending (5v5)

Both teams received excellent goaltending to end the season, with the Kings ranking first with a save percentage of 93.40 percent, while the Oilers ranked sixth with 92.45 percent. Below are the Oilers and Kings goalies from the last twenty-five games, with their rankings for each metric among the 61 goaltenders who played at least 250 minutes.

Goalie (5v5), last 25 games GP TOI Save% GSAA High-danger Save%
Cam Talbot 19 942 92.4%
(17th)
4.88
(15th)
79.1%
(41st)
David Rittich 6 281 96.7%
(1st)
6.76
(8th)
96.6%
(1st)
Stuart Skinner 16 703 91.7%
(27th)
1.31
(27th)
88.1%
(10th)
Calvin Pickard 12 540 93.6%
(10th)
5.88
(11th)
81.4%
(38th)

Along with the strong numbers posted by Rittich in limited minutes, the other thing that stands out is the high workload for Talbot. He played the 11th highest minutes in the league among goalies, and he didn’t get much of a break in this last stretch, playing over 77 percent of the team’s total ice time. Skinner on the other hand saw his workload reduced, playing 56 percent of his team’s total ice time, and posting average numbers in this recent period. Considering that Skinner played the fifth highest minutes in the league over the full season, he definitely needed the break. And hopefully he doesn’t burn out like he did last post-season.

Special Teams

While the Edmonton Oilers powerplay posted the second highest rate of goals over the full season (10.53 goals per hour) supported by the fourth highest rate of shots (62.33 shots per hour), their performance and results over the final twenty five games of the season wasn’t nearly as good. Over this recent period, the Oilers powerplay ranked 13th in the league, scoring 8.46 goals per hour. A big reason for this was their decline in rate of shots, which ranked 15th with 54.21 shots per hour.

The Kings powerplay was slightly better than Edmonton’s, scoring at a rate of 8.97 goals per hour in their last twenty five games and ranking 11th. But this appears to be largely unsustainable as they consistently generated some of the lowest rates of shots in the league all season. It’s very similar to how they did at the end of last season as well.

Powerplay (Last 25 games) Oilers Kings
Shots for/60 54.21 (15th) 43.72 (27th)
Goals for/60 8.46 (13th) 8.97 (11th)
Team shooting% 15.60% (13th) 20.51% (2nd)

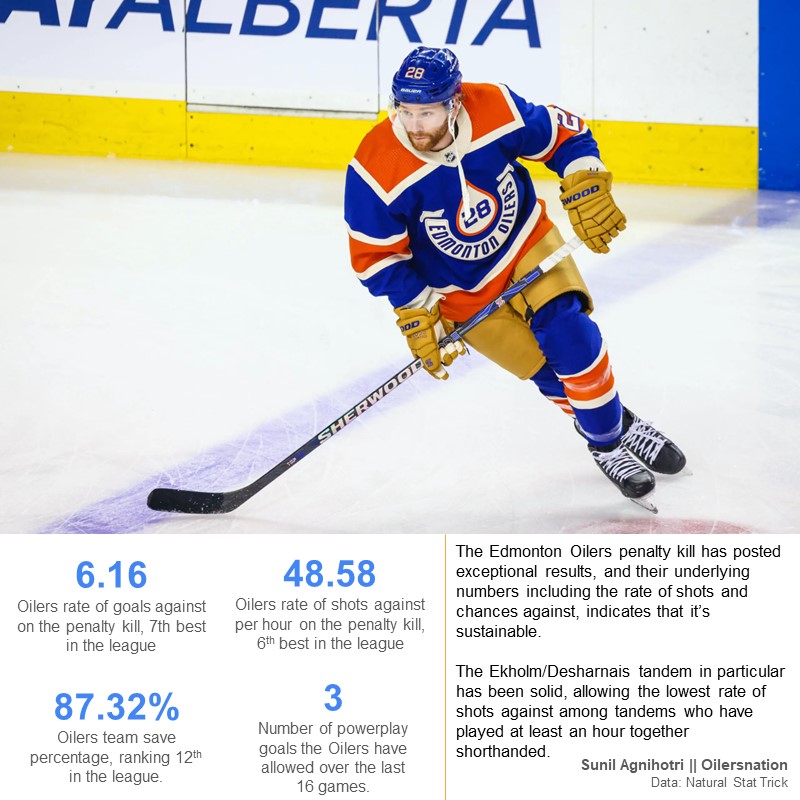
Both team’s had decent results on the penalty kill to close the season, with the Kings allowing the tenth lowest rate of goals against per hour (6.99) and the Oilers ranking 14th (7.65). The big issue for Edmonton was their goaltending, as it ranked 26th in the league with a 82.50 save percentage, while the Kings goaltending ranked 7th. And these recent goaltending numbers for both teams is consistent with what they posted over the full season.

Penalty Kill (Last 25 games) Oilers Kings
Shots against/60 43.70 (5th) 56.38 (20th)
Goals against/60 7.65 (14th) 6.99 (10th)
Team save% 82.50% (26th) 87.61% (7th)

Skaters (5v5)

Another thing I wanted to see ahead of the series was how the players on each team did in terms of on-ice shot and goal differentials at even-strength (5v5) over their teams final twenty-five games. Just to get a sense of which players are playing well, but might not be getting the results. And which players might be getting unsustainable results.

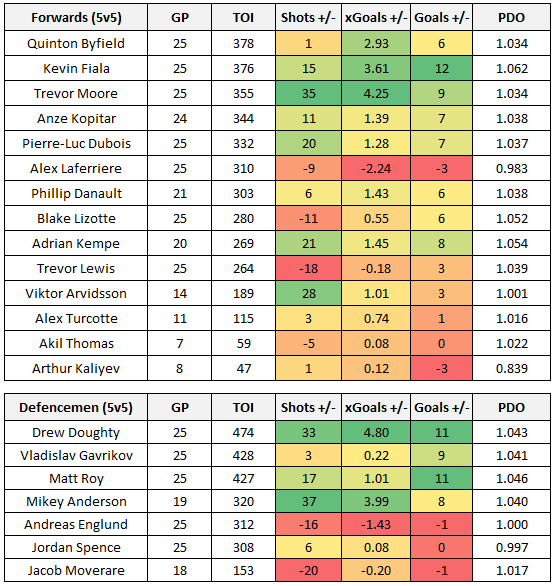
Below are all of the Oilers skaters, split by forwards and defencemen, and sorted by their total ice time.

The top end of the Oilers roster is what will drive results in the post-season as they’ve consistently outshot and outchanced opponents, and typically against the top players of other teams. It’s encouraging to see that McLeod was getting lots of opportunities, even though the results haven’t been there. He’s going to be critical for the team and should (hopefully) form an effective third line with Holloway and Perry.

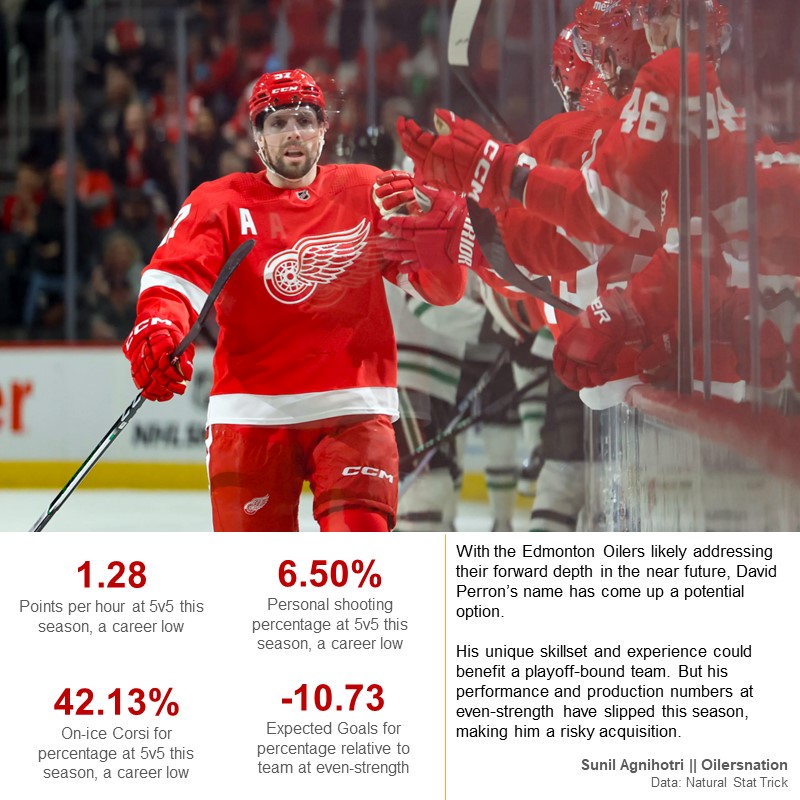
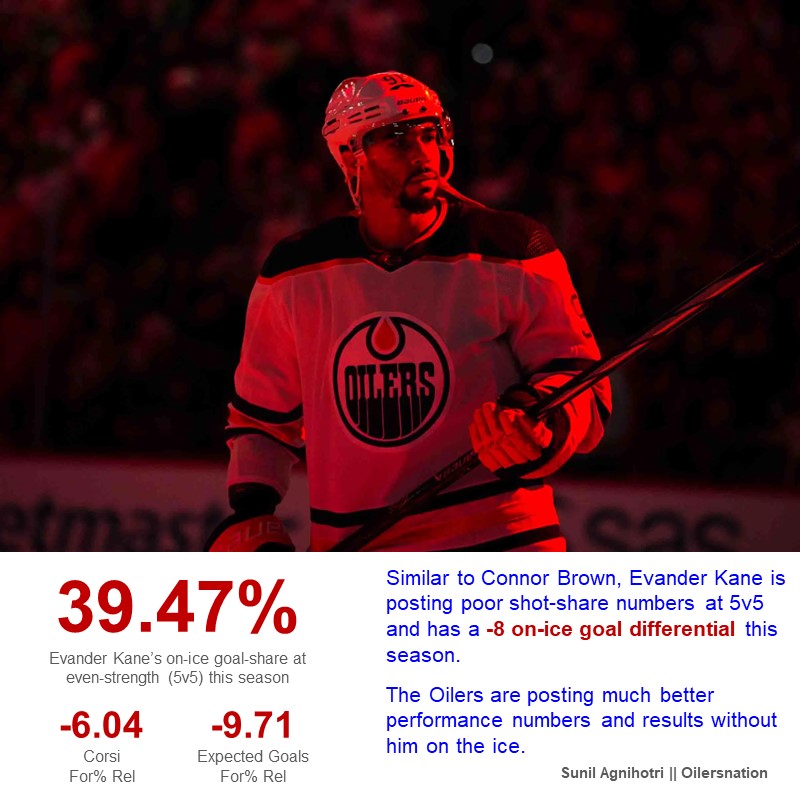
I do also wonder if the team is really losing anything if Kane and Janmark aren’t healthy and ready to go for game one of the series. Both players tend to be a drag on the team’s performance numbers at even-strength and their results haven’t been very good. Might be better to run with Holloway on the team. I also wouldn’t count on guys like Henrique, Brown or Carrick, as the Oilers tend to play more often without the puck with them on the ice.

On the backend, there should be some concern with the Kulak-Desharnais partnership as they performed very poorly over the last stretch of the games. The coaching staff was trying them out against tougher competition, and giving Nurse/Ceci a break, so that could be what’s driving the numbers here. It’ll be very interesting to see how the coaching staff manages the minutes among defencemen, as it appears as though the Oilers really only have one reliable pairing in Ekholm and Bouchard.

And here’s a quick glance at the Kings skaters, again split by position and sorted by ice time over the final twenty five games of the season.

Danault is the player to watch on the Kings, as he played the most against elite competition among Kings forwards and posted excellent shot-share numbers against this group. If the Kings have any chance of winning, he’ll need to play a lot against the Oilers top lines. Kempe is another one to watch and it’ll be interesting to see how often the Kings target Nurse and Ceci with his line. I do feel like there’s some Kings players to target here as a few of them are great at generating shots, but not really good at generating scoring threats consistently as reflected by their expected goal numbers. Specifically Dubois and Arvidsson – both of which were brought in to solve the Kings goal-scoring issues but have bounced around the line up.

Thoughts

While the Oilers should win this series, I think it’ll be a lot closer than people expect. The Kings were very good defensively this season, and have two capable goaltenders. The Oilers do have the higher-end talent, but I’d still have concerns with the defence core, which tends to struggle playing with the bottom six forwards and could be targeted by the Kings coaching staff. I’d also be concerned with Skinner’s performance as he had one of the highest workloads in the league this season, and could potentially start to fade as the series goes on.

Whatever happens, the Oilers have put themselves in an excellent spot and have a real chance of winning a few rounds because of their top end talent. If the coaching staff gets their line match-ups right and address their weaknesses as quickly as possible, they should remain competitive.

Data: Natural Stat Trick, Puck IQ

Also posted at Oilersnation.

Clear victories and what it means as the NHL playoffs approach

Plenty of success has been had this season for the Edmonton Oilers, who have now won 45 of their 73 games, securing 95 points. Their 0.651 points percentage ranks second in the Pacific division and eighth best in the league.

What’s especially impressive is how often the Oilers have won their games by a decent margin. Their +55 goal differential in all situations ranks sixth best in the league, due in large part to their overall health, the high-end talent up front, their ability to control the flow of play and proportion of scoring chances at even-strength and their success on the powerplay. The overall results this season have looked real and sustainable and should hopefully translate into a long playoff run – especially if their top players can stay healthy and their goaltending holds up.

It’s clear that the team has the talent to do some damage, but how well do they compare with the rest of the league and the other teams contending for a championship this spring?

One way to evaluate a team’s talent level is by looking into the number of clear victories they’ve posted. Clear Victories is a metric that Scott Reynolds analyzed and tracked over a decade ago over at The Copper & Blue and is defined as a win by two goals or more, excluding empty net goals. The key takeaway from Reynolds’ analysis is that clear victories were a better indicator of a team’s true talent level than the team’s overall record. And teams who more often win games by a larger margin tend to have better success in the future. Heading into the post-season this metric can really help identify the teams that have an edge over their competition and if any of the contenders might be considered outliers.

With a lot of help from Ganesh Murdeshwar from PuckIQ, I was able to put the following table together that sorts each NHL team by their points percentage along with the number of clear victories they’ve posted this season. This metric isn’t readily available, so I appreciate the support from Ganesh! You can follow him on X/Twitter at @OilersNerdAlert.

Again, Clear Victories is defined as a win by two or more goals excluding empty net goals. One additional criterion is that the winning team has that goal differential of at least two with three minutes left in the game. This helps avoid the scenarios where an empty net goal is scored earlier in the period (as we know teams are pulling their goalies earlier), or when a penalty results in a goalie pull.

Included in this table is each team’s Clear Victories Percentage (CV%), which is the number of clear victories divided by their total number of games, along with each team’s Clear Losses Percentage (CL%). I’ve also applied a basic heat map to each team’s points percentage and Clear Victories Percentage to see how teams compare with one another, and if there are teams who might be winning a lot but often by a smaller margin.

The top teams when it comes to Clear Victories Percentage this season are Colorado (44.0 percent), Winnipeg (41.3 percent), Vancouver (39.2 percent), Tampa Bay (39.2 percent) and the New York Rangers (38.7 percent). The league average is 29.6 percent. Edmonton ranks eighth in the league and fourth in the Western Conference, with 38.4 percent of their games being clear victories, sitting just behind Carolina and Florida. They’re right where we would expect them to be based on their points percentage, and confirms what we already know – they have the necessary talent. They just trail behind the rest of the contenders. What also sticks out when looking at the Oilers is that they’ve also lost a lot of games by two goals or more, relative to the other top-end teams. A lot of those two-goal losses happened early in the season, but there was that stretch in February where they weren’t playing very well and losing to teams that were below them in the standings.

Dallas sticks out here as well, as they rank second in the league in terms of points percentage, but only tenth overall in terms of clear victories. I didn’t realize that they’d been winning a lot of close games, which is a little concerning heading into the playoffs. They do have decent goaltending, which is obviously going to be a major factor for them. But this analysis indicates that their talent among skaters isn’t as high as what the rest of the contenders have. Winnipeg is another interesting team as they’ve struggled recently, and rank tenth in terms of points percentage. But their proportion of clear victories remains one of the highest, indicating that their roster has the talent that could turn things around pretty quickly. And looking at Vegas, it’s tough to see them having a lot of success in the playoffs when their Clear Victories Percentage ranks 19th in the league. They have been missing some top end players who could (miraculously) come back for the playoffs, but for now, it’s not looking too good.

Tampa Bay is the one club that could do some major damage if they secure a playoff spot. They’ve been on a tear recently, going 8-1-1 in their last ten games. And it comes as no surprise considering the talent and experience they have across their roster. What’s interesting about them is that their Clear Victories Percentage was ninth highest in the league just a few weeks ago, so the signs were there that the team was going to turn things around.

What really stands out from this analysis is that while the Oilers are showing positive signs and can be considered cup contenders, there are a bunch of other talented teams having great seasons as well. Like any other post-season, it will come down to the competitive edges that a team has developed through roster construction, player development and tactics. And it’ll come through in different ways, including scoring depth, goaltending and special teams. For now, we have a good handle on which teams have the talent and can be considered legit contenders. And this should make for a fairly competitive post-season, especially in the Western Conference.

Data: NHL.comNatural Stat Trick

Also posted at Oilersnation.

PS. A big thank you to Reid Wilkins for having me on the Oilers Faceoff Show to talk about clear victories. Always a pleasure chatting with him!

What is wrong with the Edmonton Oilers’ penalty kill?

After a really nice stretch of success on the penalty kill, which I had just wrote about recently, things have really taken a turn for the Edmonton Oilers since the NHL All-Star break.

A big reason for the Oilers penalty kill success in the first 45 games of the season was their ability to suppress shot attempts and shots on goal. They allowed the third-lowest rate of unblocked shot attempts (66.83 per hour) and the sixth-lowest rate of shots against (48.58 per hour). And the shots that did get through were stopped 87.32 percent of the time, which was right around league average.

But in the ten games since the All-Star break, the rate of shots and chances against has increased significantly. For instance, the rate of shots on goal has increased by 36.1 percent, going from 48.58 per hour to 66.10 per hour. And what’s made things worse is that the goaltending isn’t nearly as good as it was earlier in the season, with the team save percentage dropping by 10.9 percent, so the skaters aren’t getting bailed out when mistakes are happening.

Sunil Agnihotri/Oilersnation

Full article is at Oilersnation.

Does David Perron make sense as a trade target for the Edmonton Oilers?

With the Oilers needing to address their depth scoring up front, I reviewed David Perron’s performance and production numbers to see if he could be an acquisition option. Long time fan of his game (and his white skates), but unfortunately it looks like his play has declined.

Perron’s inability to finish chances and his drop in personal production could be blamed on the fact that he’s playing further down the lineup with lesser-skilled linemates. But his poor production is also due to the fact that the Red Wings often spend more time without the puck and in their own zone whenever Perron is on the ice. Again, this is something Perron used to excel at over his career as he often helped drive his team’s ability to out-shoot and out-chance opponents. But it appears the forward has lost a step this season as his relative-t0-team numbers have been in the negatives, indicating that he may be a drag to his team instead of a driver like he used to be.

Sunil Agnihotri/Oilersnation

Full article is at Oilersnation.

Unpacking the Oilers’ resurgence: Behind the penalty kill success

With the Edmonton Oiler’s penalty kill posting excellent results, I thought it would be worth digging into the underlying performance numbers to see if the results are sustainable. And which individual players have been the drivers this season.

The Mattias Ekholm and Vincent Desharnais tandem on the blue line has been very good together, posting a rate of 33.45 shot attempts against per hour in 65 minutes together this season. Among 34 defence pairings who have played at least an hour together on the penalty kill, they rank first in terms of shots and unblocked shot attempts against. The average rate of shots against among these 34 defence pairings is 56.89 per hour, so they’re well below that level.

It is worth noting, too, that while the Oilers see an increase in shots and chances against Darnell Nurse and Cody Ceci on the ice together, their actual rate of shots and chances are still just under league-average levels. That’s pretty solid considering they’re often playing against the other team’s top powerplay units. The tandem has played 101 minutes together on the penalty kill, which ranks 12th highest in the league.

Looking at the forwards, you can tell who’s been playing more often on the second penalty kill unit with the Ekholm/Desharnais tandem based on the green boxes. Connor Brown, for example, has posted excellent numbers and is a big reason why the Oilers have done a nice job suppressing chances. He’s been much maligned this season due to his poor play at even strength, which has led to demotions in the lineup and some time in the press box. But there’s no denying his contributions to the second unit. After his signing last summer, I had looked into his penalty kill numbers which were fine overall, but took a bit of a hit whenever he’d play on the top units in Ottawa and Toronto. Nice to see that the coaching staff recognized his strengths and weaknesses and put him in a position to succeed.

Sunil Agnihotri/Oilersnation

Full article is at Oilersnation.

Edmonton Oilers goaltender Stuart Skinner’s workload is one of the highest in the NHL

In my latest post for Oilersnation, I looked into Stuart Skinner’s workload so far this season, and how his proportion of the team’s total ice time compares with other goaltenders.

The concern with Skinner is that while he’s been very good for the Oilers, his workload remains one of the highest in the league. He’s played 1,847 minutes in total this season, which is the seventh-highest in the league. With Jack Campbell in the AHL and Calvin Pickard only getting a handful of starts, Skinner has now played 72.7 percent of the Oilers’ total ice time this season, which is the fourth-highest proportion in the league. He’s only behind Alexandar Georgiev (79.9 percent in Colorado), Connor Hellebuyck (74.5 percent in Winnipeg) and Sergei Bobrovsky (72.9 percent in Florida).

The concern for the Oilers is that with one of the hardest travel schedules, the overall grind of the regular season and the lack of options in net, there’s a very real possibility that Skinner won’t be as rested and fresh as some of the others when the playoffs start. With 40 games left in their schedule, the Oilers really need someone to play at least half of them, so that Skinner finishes the season with about 52 games. This would still be higher than last year’s league average number of games for a starting goalie (47), but would at least be lower than the 61-game pace he’s currently on.

Sunil Agnihotri/Oilersnation

Full article is at Oilersnation.

Data: Natural Stat Trick

The resurgence of Connor McDavid

With Connor McDavid back to playing at the levels we expected him to be at, I thought it’d be worth revisiting an article I wrote in mid-November when the captain’s season was off to a rocky start. Latest post is up at Oilersnation.

Since his tenth game of the season, McDavid went on to put up 24 even-strength points in the next 23 games. And he currently sits third in the league with 28 even-strength points – only behind Nathan MacKinnon (31 points) and Nikita Kucherov (29 points). McDavid’s current full-season rate of 3.21 points per hour is currently the highest among all top six forwards (226 players who have played at least 400 minutes this season).

The other factor in all of this has been McDavid’s ability to drive play generate chances again, and help tilt the ice in the Oilers’ favour. With him on the ice, the Oilers have historically seen an increase in their share of expected goals (which factors in shot type and location to determine the probability of shots becoming goals), which isn’t at all surprising considering his talent level. But that wasn’t the case early on in the season. After his first ten games, the Oilers were posting an expected goal-share of 52.22 percent with McDavid on the ice and actually saw an increase of 8.29 without him on the ice. That’s the opposite of what’s happened in the last three seasons where McDavid’s on-ice numbers were consistently well ahead of his teammates. Between 2020 and 2023, the Oilers posted an expected goal share of 58.34 percent with McDavid on the ice, which was 9.41 higher than what the team posted without him on the ice.

Sunil Agnihotri/Oilersnation

Full article is at Oilersnation.

With Oilers forward Connor Brown scratched tonight, could Evander Kane be next?

With Connor Brown struggling and being a healthy scratch, I looked into another top six forward whose on-ice numbers at 5v5 have been just as poor. My latest post up at Oilersnation looks at Evander Kane’s season, his on-ice numbers and how they’ve been similar to Brown’s.

Like Brown, Kane has also had plenty of time in the top six, playing the third-highest number of minutes and getting to play alongside McDavid or Draisaitl (or both) for 66 percent of his total ice time. And while he has put up 13 even-strength points in 29 games this season, Kane also has an on-ice goal differential of -8 (15 goals for, 23 goals against) – which translates to an on-ice goal-share of only 39.47 percent. That’s one of the lowest on the team, and one of the worst among top six forwards league-wide.

When it comes to the underlying shot-share or performance numbers, the Oilers do a much better job controlling the flow of play and out-chancing opponents when Kane hasn’t been on the ice this season. Again, very similar to Brown, the Oilers see a drop of 6.04 Corsi For percentage points and 9.71 Expected Goals For percentage points with Kane deployed. Like Brown, removing Kane from the roster might improve their odds of outscoring opponents and winning games. And that’s a major issue considering the expectations for him and the Oilers this season.

Sunil Agnihotri/Oilersnation

Full article is at Oilersnation.

Can Zach Hyman score 50 goals this season?

In my latest post for Oilersnation, I looked into Zach Hyman’s scoring rate this season and how many goals we can reasonably expect him to finish the 2023/24 regular season with.

Considering how often Hyman gets to play with McDavid at both even-strength and the powerplay and how well the Oilers control the flow of play and scoring changes with them on the ice, it’s reasonable to expect Hyman to make a push for 50 goals. Reaching 40 would be great, no question. But with scoring continuing to grow across the league, it’s become even more important for the Oilers to have as much elite-level scoring in their top six, especially at a time when they need to find ways to improve their odds of clinching a playoff spot.

Sunil Agnihotri/Oilersnation

Full article is at Oilersnation.

What can we learn from how the Edmonton Oilers deploy forward lines and defensive pairings?

Over at Oilersnation, I looked into how defencemen and forwards have been deployed since Kris Knoblauch was hired as head coach of the Edmonton Oilers. I wanted to understand how the different forward lines have been deployed with the defence pairings, and how well they’ve performed in these last twelve games at even-strength.

Looking at the expected goal-shares of each combination of forward and defencemen, the one item that really stands out is the Oilers performance when Draisaitl has been deployed as the sole centerman with Nurse and Ceci on the blue line. In 68 minutes, the trio has posted a 24.01 percent expected goal-share – a horrendous number, indicating that the Oilers are at risk of getting outscored at a rate of 3-1 if this continues. Right now, the trio is lucky that they’ve only been outscored 2-0 in these 68 minutes. It’s worth noting, too, that Draisaitl is in a bit of a personal slump at even-strength as he’s only posted five even-strength points since the coaching change, and his 1.68 points per hour is well below his career levels (2.38 points per hour). Considering how much money is being spent on Draisaitl, Nurse and Ceci, and the expectations for them to outscore opponents and win games, this has to be a spot of bother for the coaching staff.

Sunil Agnihotri/Oilersnation

Full article is at Oilersnation.