There are a lot of reasons why things are going sideways right now for the Edmonton Oilers. And it’s happening at a team level, in every game state, and at individual levels.
Despite doing a very good job at controlling the flow of play and getting a good proportion of the scoring chances at even-strength (even when the score is close), the Oilers are having trouble finishing chances and stopping pucks. Their special teams have also been terrible, costing them wins. They’re currently one of the worst teams in the league at generating chances on the powerplay, even with the same group and talent-level as last season. And while the penalty kill has been fine at limiting chances against, they can’t get enough saves from their goaltenders.
One player in particular who has struggled in the first ten games this season has been defenceman Darnell Nurse. With him on the ice at even-strength (5v5), the Oilers are posting a Corsi For percentage of 49.05 percent and an Expected Goals For percentage of 44.60 percent – some of the worst numbers on the team. Without him on the ice, these numbers improve significantly, with the team’s Corsi For percentage improving by 18 percent (up to a 59.8 Corsi For percentage) and the Expected Goals For percentage improving by 24 percent (58.52). When you combine his poor-on-ice shot-share numbers with the team’s very shaky goaltending, it’s no wonder that Nurse’s on-ice goal share of 33% (3 goals for, 6 goals against) is one of the worst on the team.
And it’s far below what any management group would expect from one of the highest-paid defencemen in the league.
What’s also been eye-opening is how much the Oilers forwards struggle to control the flow of play at even-strength when they have to share the ice with Nurse. When we compare every forward’s on-ice Corsi For percentage with Nurse and without Nurse, we see only two players being able to weather Nurse’s deficiencies: Zach Hyman and Connor McDavid (just barely).
The graph below sorts the forwards from those who have played the most even-strength minutes with Nurse to those who have played the fewest. The table shows each player’s time on ice with Nurse, their Corsi For percentage with Nurse and their Corsi For percentage without him.
.
What stands out here is that Nurse has typically been playing with third-line players like Adam Henrique, who he has played his most minutes, Connor Brown and Mattias Janmark. And because of Nurse and the minutes they have to play with him, these three forwards have seen their on-ice shot-share numbers take a hit and rank as some of the worst on the team. But when they’re away from Nurse, their numbers drastically improve, which in turn helps increase their odds of outscoring opponents as they’re spending more time with the puck and away from their own zone.
We do also see a few players who do okay with Nurse, such as Arvidsson and Podkolzin. Their on-ice numbers with Nurse take a hit, but they don’t drop below the break-even mark and remain respectable. This ability to survive the Nurse minutes could explain why both of them are getting more minutes with Draisaitl on the second line. The coaching staff needs to do everything possible to mitigate the risks associated with deploying Nurse and have to find as many internal solutions as possible. At least until management can address one of the biggest and most expensive problems on the team.
The Edmonton Oilers head into the 2024/25 regular season with high expectations, and understandably so. Their group of forwards have two of the best players in the world in Connor McDavid and Leon Draisaitl, along with a good supporting cast. Their defence has some high-end talent in Evan Bouchard and Mattias Ekholm. And the team is coming off a playoff run where they were one win away from a championship.
Plenty will need to go right for the team to make another deep run in the playoffs. But before even getting there, the team really needs to have a good start to the regular season, which is something they’ve had trouble with the last two years now. A poor start has many downstream effects, including having to overplay players in important positions, like goaltending, just to make up ground in the standings. And not being able to rest star players to keep them fresh for the playoffs. A good start can also increase their odds of winning their division and securing home-ice advantage for the post-season. Something that hasn’t happened since the dynasty years.
Recent history
Two years ago, the Edmonton Oilers started the 2022/23 regular season with ten wins and ten losses in their first 20 games, ranking 20th in the league with a 0.500 points percentage. They were outscored 66-72 in all situations and had the fifth worst goal-share (42.86%) at even-strength (5v5) getting outscored 33-44. And while their powerplay was one of the best in the league, all their goals were wiped away by their penalty kill that allowed the fourth highest rate of goals against.
And last season’s start was even worse. In their first twenty games, they had seven wins, twelve losses and one overtime loss. This had them 29th in the league with a 0.375 points percentage, and only three points ahead of San Jose in the Pacific division. They were outscored 66-74 in all situations, and 38-46 at even-strength. That’s a goal-share of only 45.24%, which had them 26th in the league. And they had the same issue on special teams where the powerplay was outstanding (+16 goal differential), but their penalty kill was erasing all their success (-15 goal differential). Things eventually turned around, but it was a massive lift.
So what were the factors that caused these poor starts for the Edmonton Oilers?
Goaltending
The Oilers goaltending has struggled out of the gate two seasons in a row. In the first twenty games of the 2022/23 season, their team save percentage in all situations was 89.57 percent, which ranked 23rd in the league and 10th in the western conference. And in the first twenty games of the 2023/24 season, their team save percentage was 87.11 percent, which was 31st in the league and dead last in the western conference. A lot of the problems were on the penalty kill, especially earlier in the 2023/24 season where despite the Oilers doing a good job limiting the rate of shots and chances against, the goaltending was terrible ranking 25th in the league with a save percentage of 81.82 percent.
Skinner has the starting role, but it’s critical that the Oilers have a solid backup option ready in case he falters like he has in the past.
Poor finishing at even-strength
In the early parts of both seasons, the Oilers as a team had a lot of trouble burying their chances. Two seasons ago, they started the season with a 7.02 percent shooting percentage, which ranked 31st in the league. And they started last season with a 7.58 percent shooting percentage, which ranked 25th. League average shooting percentage over the last three seasons has been 8.55 percent, and the Oilers have been right around there with an 8.77 percent shooting percentage. Considering the talent level they have and the amount of money allocated to offensive players, their shooting percentage has to be better to start the season.
Which leads to the next factor.
Star players starting poorly
Last season, Connor McDavid had a rough start relative to his own standards – specifically at even-strength. McDavid didn’t look like himself, along with other teammates, likely driven by the fact that they started training camp earlier than normal, which resulted in injuries. McDavid himself missed a couple games and put up only eight even-strength points in his first 17 games – a point per hour rate of only 1.79. For context, McDavid has posted a rate just under three points per hour over the course of his career. So, this was exceptionally low relative to his career levels. His season did turn around soon after, and he went on to dominate the rest of the season. But it was a good reminder of how critical he is to the team’s success, and how difficult it is to replace his production when he’s not at 100 percent.
A similar issue had occurred the season prior when Leon Draisaitl struggled out of the gate in 2022/23. In the first twenty games that season, Draisaitl had only nine even-strength points, which translated to a points per hour rate of 1.76. That’s well below his career points per hour rate of 2.41 and the 2.51 he’s posted over the last three seasons. One contributing factor to his lack of production early that season was how often the Oilers played without the puck when he was on the ice. His on-ice share of shots and scoring were some of the worst on the team, with his Expected Goals For percentage sitting at 44.51 percent.
It took playing more often with McDavid to give those numbers a boost and at a production level closer to what we would expect from Draisaitl. Plus he needed to get healthier. Draisaitl was coming off a significant injury sustained in the playoffs that spring – so it was understandable that he would struggle. But again, it highlighted how important he is to the team’s early-season success and the lack of depth on the roster that season.
Thoughts
It’ll be interesting to see how the Oilers start the year after making a deep run in the playoffs and turning over a significant number of players on the roster. The hope is that everyone is healthy, and that training camp has given the group enough time to implement their tactics and build familiarity with one another. Goaltending will need to be league-average, along with the team’s ability to finish their chances. And if the star players can start off strong, that should alleviate some pressure and improve the team’s odds of winning the division.
It’ll be on management and the coaching staff to not only monitor and evaluate the team’s progress, but also address issues that come up as quickly as possible. Without those risk mitigation plans in place, a poor start can potentially derail a team’s championship aspirations.
For my latest post for Oilersnation, I shared my thoughts on the loss of Evander Kane for an extended period, and why it should have minimal impact to the Oiler’s performance numbers and results.
While Kane does have a strong reputation for being a skilled player who can play a physical style, his unique skill set has not translated into on-ice results for the Edmonton Oilers. The first two years of the four-year term he signed with Edmonton have not gone well, and you can argue that his contract is of poor value to Edmonton. Regardless of it’s regular season or playoffs, Kane’s on-ice numbers are typically poor relative to his teammates, and he doesn’t have the same impact on the game as he used to. The Oilers should have been aware of his declining value a long time ago and addressed the issue to have more flexibility with their roster and cap situation. Instead, the Oilers are on the hook for two more years at over $5 million, and can’t realistically expect Kane to return to top form after undergoing major surgery.
The Edmonton Oilers are starting the regular season with a lot of uncertainty with their defensive group.
We know what to expect from Evan Bouchard, Mattias Ekholm and Brett Kulak. But Darnell Nurse is dealing with an injury from the playoff run and isn’t attending training camp. Ty Emberson and Troy Stecher have the potential to be regular options on the right side, which is lacking depth. But there’s no guarantees there. And then there’s Josh Brown, who I wouldn’t have high expectations for considering his on-ice numbers at even-strength, which have consistently been poor. I’m still not sure how he landed a three-year deal.
It remains to be seen how training camp shakes out and if any other players emerge as defensive options, including Travis Dermott, who is on a PTO and Max Wanner, who’s 21, shoots right, and has developed well in Bakersfield. For now, though, it’s the bets management has made and what they have heading into the season. And the Oilers will likely do what they can to accrue cap space and make enhancements to their blueline later in the season – depending of course, on how the current group performs.
Great to see the @EdmontonOilers key Management people and HC Kris Knoblauch all in Penticton.
Fully expect the Oilers to be in the market for a 2nd pairing RD…at some point… Preferably with a little term left…
If the Oilers do eventually pursue a right-hand defenceman who has term left, I’d suspect they would want someone with experience and someone they have a better handle on. The one name that’s come up a few times in the local market is Finnish defenceman Rasmus Ristolainen. Selected eighth overall in the 2013 entry draft, Ristolainen has played 713 NHL games for Buffalo and Philadelphia. Ristolainen turns 30 this fall and is in the third year of a five year contract he signed with Philadelphia in 2022 with an annual cap hit of $5.1 million.
To make the financials work, the Oilers would probably need Philadelphia to retain a good portion of Ristolainen’s contract, which would cost them extra assets. But before doing that, it’s worth looking at a few things, including Ristolainen’s usage over his career, his on-ice shot-share numbers at even-strength, and what his impacts are on the penalty kill (an area that the Oilers might need help with after the departures of Cody Ceci and Vincent Desharnais). All of this will give us a better sense around what kind of value someone like Ristolainen could bring to the Oilers.
Usage at five-on-five
Ristolainen entered the league in 2013 with high expectations and was given a lot of responsibility by the Buffalo Sabres. Management there had done a poor job at constructing the roster, and they didn’t have many options for the coaching staff. So, throughout his eight seasons in Buffalo, Ristolainen played some of the highest minutes in the league and in all situations, especially at even-strength.
Below is the average number of even-strength minutes Ristolainen played by season, with his highest rate of minutes coming as a 22-year-old in 2016-17. Since then, his ice time has gradually declined, especially in his second and third years in Philadelphia, where he’s averaged just over 16 minutes a game. Last season, Ristolainen dealt with significant injuries and played only 31 games, which impacted his ice time. He underwent surgery for a ruptured triceps tendon in April and is expected to be fit to play this upcoming season.
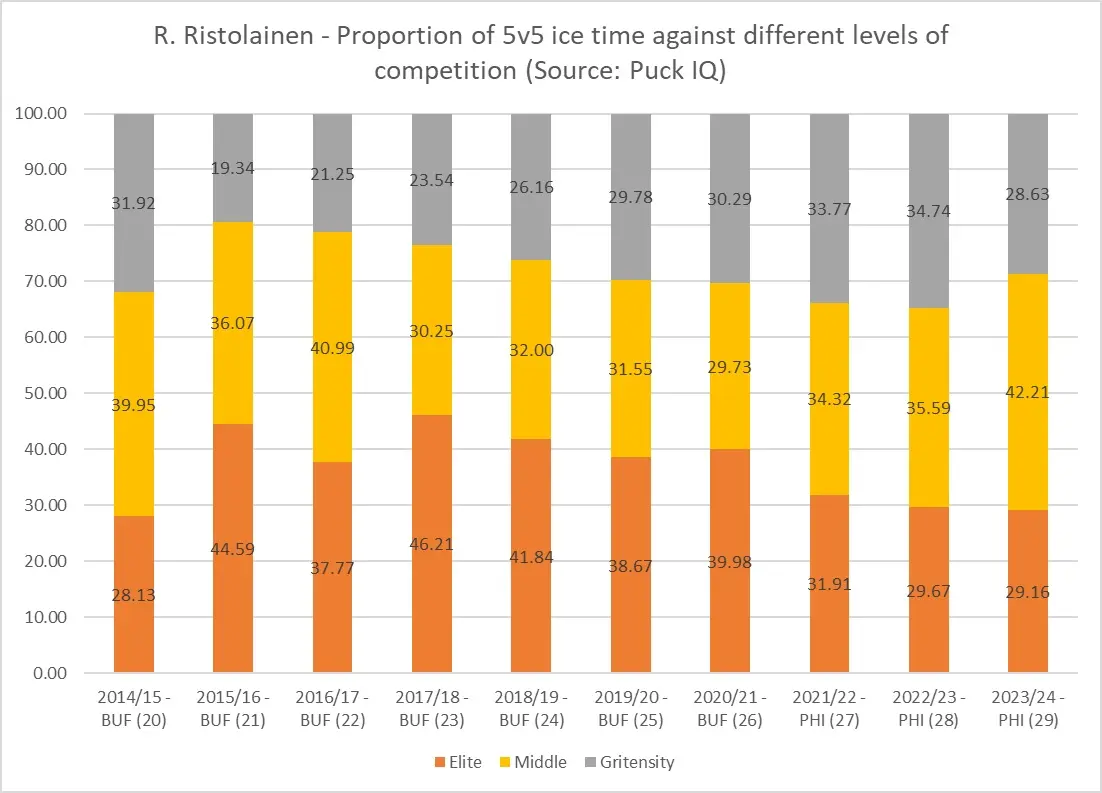
What really stands out from Ristolainen’s time in Buffalo was the extreme amount of time he played against elite-level competition – well above 40 percent in some seasons. He was consistently given some of the highest proportions in the league among defencemen and didn’t fare too well. Again, the Sabres didn’t exactly surround him with good talent, and they missed the playoffs every year because of their shoddy decision-making, so he was typically the best and only option. Below is a breakdown of the competition levels Ristolainen faced using the methodology from PuckIQ.
Philadelphia appears to have recognized that Ristolainen was getting way too much responsibility in Buffalo and had a plan to put him in a position to succeed once they acquired him. In the last few seasons with the Flyers, we see that his proportion of ice time against elite competition has dropped to more reasonable levels – around 30 percent. This is where he probably should have been, considering that his on-ice numbers in Buffalo were so poor.
On-ice results at five-on-five
What this reduced responsibility in Philadelphia appears to have done is help improve Ristolainen’s on-ice shot-differential numbers. Playing so many minutes, and a lot of those minutes against elite competition, Ristolainen played a lot of time without the puck, and his numbers reflected that. The Sabres consistently struggled to outshoot and out chance opponents, and those numbers were even worse when Ristolainen was on the ice. Again, he didn’t have a lot of help on that team. Plus he was definitely in over his head with the assignments the coaching staff gave him.
Below are Ristolainen’s relative-to-team shot-differential numbers by season. I tend to use Corsi, a proxy for puck possession, and Fenwick and Expected goals as a proxy for scoring chances.
We see here that with Ristolainen on the ice, the Sabres fared much worse and saw their shot and chance differentials negatively impacted. Again, a lot has to do with his assignments. But it was painfully obvious that he shouldn’t have played all those minutes and needed fewer minutes and responsibility. When he got to Philadelphia, he did get a lot of minutes in his first season, but as we saw in the PuckIQ numbers, he was playing a lower proportion against elite-level players compared to previous years in Buffalo. What this did was help his on-ice shot-differential numbers, as we saw that the Flyers did better with him than without him. In his second season as a 28-year-old Flyer, his numbers dipped again, but that might have to do with the injuries he sustained and the fact that he’s aging and dealing with some wear and tear.
Penalty kill
Another area that Ristolainen has a lot of experience with is the penalty kill. He was regularly on the first unit in Buffalo, and that usage continued during his first two seasons with Philadelphia. What’s worth noting is that while in Buffalo, Ristolainen’s on-ice rate of shots against was quite high relative to his teammates and well above the normal levels for first-unit penalty kills. His numbers, however, have gradually improved since joining Philadelphia, so it might have been the system and linemates in Buffalo that could have been impacting his numbers. If, for whatever reason, the Oilers penalty kill struggles early on, expect Ristolainen’s name to come up more often in the market.
Thoughts
It’ll be interesting to see if we continue hearing about Ristolainen being a potential addition to the Oilers’ right side on the blue line. He’s got the experience and name recognition, and the term left on his current deal would be manageable. However, the Oilers will need to give up assets to have Philadelphia or another team retain part of the salary to make his contract fit. And that’s where the Oilers must determine what value Ristolainen brings and if it’s worth giving up those assets. From his recent numbers, there appears to be value as he can hold his own on a second pairing at even strength and can play on the penalty kill. The one concern with Ristolainen is health, how he recovers from the tricep surgery and if he can stay healthy.
The Oilers made an interesting addition to their training camp, signing forward Mike Hoffman to a professional tryout agreement. A fifth round pick in the 2009 draft, Hoffman has played 745 regular season games in the NHL, scoring 228 goals and 487 points. And he has 20 points in 33 playoff games. Hoffman will be 35 years old this fall.
Looking at the current roster, Hoffman appears to be a long shot to make the NHL team. The top six group of forwards is pretty much set with the additions of Jeff Skinner and Viktor Arvidsson. And the bottom six group is filled with veteran guys who secured NHL deals this summer, including Mattias Jannmark, Adam Henrique, Connor Brown and Corey Perry. The Oilers powerplay doesn’t really need any specialists, and Hoffman has never been trusted to kill penalties in his entire career.
To figure out what the best-case scenario would be for Hoffman in Edmonton, I wanted to get a better understanding of how he’s been utilized by five different organizations as well as his underlying performance numbers, specifically at even-strength (5v5). The PTO agreement is a great way for the Oilers to see what Hoffman has to offer and if he can add any ounce of value to the roster. The bottom six could always use some more scoring ability, so seeing what Hoffman has left is worthwhile.
Couple high-level questions I have regarding Hoffman:
What level of responsibility did he have at even-strength after he turned 30?
Has his shooting percentage declined as he’s aged?
What impact has he had on his team’s shot and scoring chance differentials?
Utilization
Knowing Hoffman’s history and reputation as a goal-scorer and what we know about player aging curves, it’s a good to know how other NHL coaching staff’s have handled his ice-time and deployment – especially in the last few seasons.
The graph below shows Hoffman’s average ice time per game at even-strength. What’s become apparent is that he’s been deployed as a third line option at 5v5 (~12 minutes per game) since he turned 30 almost five seasons ago. Montreal did give him some more opportunities on their second line in 2021/22, playing with some skilled, young players. But other than that he’s been predominantly a depth player after he turned 30.
And below is a breakdown of how Hoffman was deployed against different levels of competition, using PuckIQ’s methodology.
Again, we see that his responsibilities have declined as he’s aged, and there’s been a consistent effort of his coaching staff’s to keep him away from elite level competition. Prior to turning 30, Hoffman was more often deployed with top-six linemates and against elite level players. But over the last few seasons, coaches have kept him further away from top-end players. There was a slight uptick of time against elites last season in San Jose, but that could have been to build up his trade value ahead of the trade deadline as the Sharks were, and continue to be in, a rebuilding phase.
Please note that because of the shortened regular season in 2020/21 and teams playing within their division, the competition proportion numbers from that season were significantly impacted. The West division that the St. Louis Blues played in that year didn’t have a lot of elite-level players, so their entire roster is showing a low amount and proportion of time played against elite-level players. My thought is because Hoffman played about 12 minutes a game that season, which is around a third-line rate, his proportion of time against elites were similar to what he had posted in 2019/20 with Florida and in 2021/22 with Montreal.
Goal-scoring
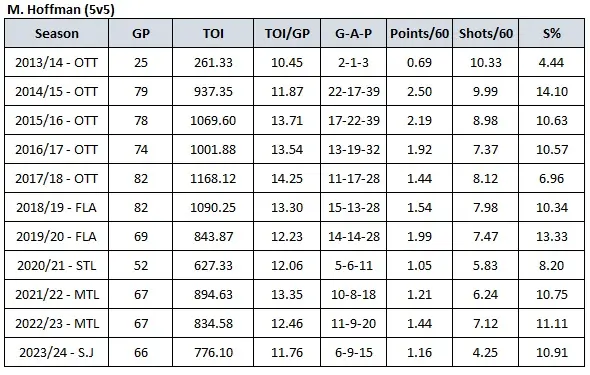
Below is a summary of Hoffman’s numbers over his career at even-strength, which is a major focus here since he’s not likely going to get powerplay time in Edmonton. So if he wants a role, he’ll need to bring some value in this critical game-state. Playing for Edmonton will be an adjustment for Hoffman as he’s always been a powerplay option, and it’s where he’s generated a large proportion of his overall points.
The overall rate of point production (i.e., points per hour) at even-strength has gradually been declining for Hoffman. His high point came as a 24-year old in 2014/15 when he scored at a first-line rate for Ottawa with 2.50 points per hour. While he finished fifth on the Senators in overall points, he was second on the team in even-strength points, just a few points behind Mark Stone. But after a decent season with Florida in 2019/20 when he was 30, things have gone pretty poorly for Hoffman. Even though he’s been getting around the same number of minutes and getting to periodically play with talented players, he’s been producing worse than a third-line rate (1.50).
One underlying issue for Hoffman is that his individual rate of shots has been declining for quite some time now. It plateaued between 2016 and 2020, when he was between ages 27 and 30. But then it took another drop after that. Last year was a career low, as he only generated 4.25 shots per hour – well below his career levels and what he’d been posting in the three seasons prior. San Jose was a dreadful team last year and he dealt with injuries, which obviously played a role. But it’s part of an ongoing trend, so it’s likely going to continue unless he’s fully healed up and has high end linemates.
What’s interesting is that while Hoffman’s rate of shots has declined, his personal shooting percentage has remained fairly consistent – definitely a good sign for Edmonton. Over the last three seasons, he’s hovered around 11% and there’s a good chance he’ll be able to post this again. The issue, as indicated above, is that he’s not getting enough chances – an issue that could be mitigated by the coaching staff and their deployment tactics.
On-ice shot differentials
As mentioned before, Hoffman has had issues generating shots for himself. One of the big reasons for this is that when he’s on the ice, his teams are often defending and playing in their own zone. Hoffman’s defensive play has been in the spotlight before, so it’s not overly surprising to see the numbers below. But it’s the decline, again, after turning 30, that really stands out.
The table below shows Hoffman’s on-ice shot-differential numbers relative to his teammates. This factors in the quality-level of their roster and tells us if they’re thriving in the minutes their given. I tend to use Corsi For percentage, which is a proxy for puck possession, as well as Fenwick and Expected goals as a proxy for scoring chances.
In the last two seasons, Hoffman’s numbers haven’t been as bad, but it’s likely because he’s been playing on bottom-feeder teams that were lacking talent. My thought is if he’s on a higher end team like Edmonton, his numbers will take a hit. He doesn’t exactly have the history of being a positive impact player.
Summary
Depending on how things go in training camp, and if he’s healed up from his injuries from last season, there’s an outside chance Hoffman could make the team. His best attribute is scoring goals, which I think the Oilers bottom six might struggle with this season. And he’s been fairly consistent in terms of converting on his chances. The issue for Hoffman is that he has to be sheltered quite a bit, as his overall defensive play limits his teams ability to outshoot and outchance opponents. At this point, Hoffman appears to be more of a reserve player who can fill in when injuries hit. But we’ll have to see how things shake out in the next few weeks through camp and the pre-season games starting this weekend.
The Edmonton Oilers special teams have kept the championship drive alive. The question now is if we can expect it to continue having success against the Florida Panthers.
One of the Edmonton Oilers’ major drivers for success this post-season has been their powerplay and penalty kill, which have produced outstanding results.
It’s been a factor in all three playoff rounds so far, as the Oilers have struggled to outscore opponents at even-strength, having only posted a +1 goal-differential over their 18 playoff games. They broke even in terms of goal-differential against the Los Angeles Kings, went +2 against the Vancouver Canucks and were a -1 against the Dallas Stars.
It’s really been the Oilers’ performance without McDavid’s line on the ice that’s caused these poor even-strength results. The team tends to get outshot and out-chanced consistently (46.54 percent expected goals for percentage), resulting in a -8 goal differential without their captain’s line and a +9 goal differential with him. The team, especially the depth players, are having issues converting on their chances at even-strength. And goaltending ranks as one of the worst among playoff teams in terms of save percentage and goals-saved above average.
Make no mistake, the special teams – featuring the top-end players and a lot of the depth players who are struggling at even-strength – have bailed this team out. And it’s hard to imagine the Oilers making it this far without the power play and penalty kill performing so well.
Powerplay
The Oilers have scored 19 power play goals in just under 74 minutes this post-season, a rate of 15.44 goals per hour. That’s one of the highest team rates in playoff history and isn’t even a level that the Oilers were running at during their regular season. The table below shows the Oilers’ regular season goal-scoring rate over rolling 18-game segments, with a blue line representing their current playoff scoring rate.
The Oilers’ results appear to be sustainable considering their skaters’ talent and overall health. Their current team shooting percentage of 19.39 percent is high, but this group was able to post a very similar rate over the full 2022/23 regular season – so it’s not totally out of the realm of possibility. Plus the group is currently generating 76.66 shots per hour, again one of the highest rates in playoff history and well ahead of the rest of the post-season teams.
It’s worth noting that the Florida Panthers have the potential to slow the Oilers power play down in this upcoming series. Their penalty kill has only allowed six goals in 85 minutes this post-season, a rate of 4.20 goals per hour that is second lowest among playoff teams – only behind Edmonton. The Panthers’ success is largely driven by their ability to prevent shots and chances, as their rate of 44.08 shots against per hour is the third-lowest in the league. And their goaltending save percentage ranks third best in the league. This post-season success appears to have carried over from their regular season. The Panthers finished with the fourth-lowest rate of shots against per hour (46.64) and the sixth-lowest rate of goals against per hour in the league (6.16).
Penalty kill
It’s remarkable how great the Oilers’ penalty kill has been this post-season, having shut down Los Angeles, who scored the 10th-highest rate of powerplay goals in the regular season, and Dallas, who scored the fifth-highest rate of powerplay goals in the regular season. The last power play goal the Oilers allowed was in game three against Vancouver on May 12th. In the ten games since, they’ve allowed zero.
A big reason for their success has been their ability to suppress offensive chances, as the club has allowed the second-lowest rate of shots against (39.87) among playoff teams. This strong defensive play in front of their goaltender is something that’s carried over from the regular season when the Oilers allowed the sixth-lowest rate of shots against (49.27 per hour). So it’s reasonable to expect the penalty kill success to continue, depending of course on if the goaltending can hold up. When shorthanded during the regular season, the Oilers team save percentage was the sixth worst in the league (84.68 percent). But it’s currently sitting at 94.92 percent in the playoffs, so there’s the possibility of some regression in the upcoming round.
The Panthers’ powerplay is generating plenty of chances this post-season, ranking third in terms of shots per hour (57.84). And it’s a carryover from the regular season when they finished with the second highest rate of shots per hour in the league. But they’ve had trouble converting on their chances during their playoff run, likely due to playing against some pretty elite goaltending. Tampa Bay, New York and Boston all finished top-five league wide when it came to shorthanded save percentage during the regular season. This has resulted in the Panthers’ powerplay scoring at a rate of 8.18 goals per hour, which is closer to league-average levels. Considering all this, it’s even more critical that the Oilers penalty killers continue to play strongly in front of Skinner, who, as mentioned above, could be at risk of some regression.
It’s astonishing that it’s taken the Edmonton Oilers ownership and different management groups this long to finally win a team-level award.
It’s a massive opportunity for the Edmonton Oilers to win their first championship in 34 years, but a lot is going to have to go right for them – especially at even-strength where they’ve only been okay at this post-season. Team awards have been hard to come by for this franchise when you consider the lack of division titles, conference titles and president trophies, but a championship this June is a very real possibility and can alleviate some of the frustrations this fan base has endured over the years.
So far this post-season, the Panthers have had better success than Edmonton, ranking first with a 56.36 percent goal-share (+7 goal differential) at even-strength. The Oilers, on the other hand, have just barely broken even in terms of goals, posting a 50.65 percent goal-share (+1 goal differential) that ranks sixth. The Panthers have also posted stronger shot-share numbers than Edmonton, ranking second among playoff teams with a Corsi For percentage of 55.49 percent and leading the group with an Expected Goals for percentage of 54.93 percent. Edmonton’s numbers aren’t bad either, as their Corsi For percentage ranks fifth. But their expected goals for percentage rank seventh.
While the Panthers are doing a good job at controlling the flow of play, spending more time in the offensive zone and generating shots, it appears that they’re having issues converting on their chances. Their current shooting percentage of 7.32 percent is below league-average levels but consistent with what they posted in the regular season (7.67 percent). Their results at even-strength this postseason appear to be driven by their goaltending, as their team save percentage sits at 92.28 percent, well ahead of Edmonton’s save percentage of 89.10 which is the second lowest in the league.
Among the 24 goalies who have played at least 40 even-strength minutes this season, Sergei Bobrovsky ranks ninth with a 92.40 percent save percentage and seventh with a goals-save above average of +1.54. Stuart Skinner on the other hand ranks 20th among the 24 goals with an 89.50 percent save percentage and last overall with a goals-saved above average of -7.73,
Below are the on-ice numbers for the Panthers and Oilers skaters, separated by position and sorted by total time on ice this post-season. The table included each player’s on-ice shot differential, expected goals differential, and actual goals differential. A heat map has been applied to each metric to show how each skater compares with their teammates.
What stands out for Edmonton is that their top-end players are doing quite well when it comes to generating shots and goals. But the further you go down the lineup, the more things start to drop off. In their 16 games this postseason, the Oilers have played about 41 percent of their even-strength time without McDavid or Draisaitl on the ice. And in those minutes, the Oilers have been pounded on the score sheet – being outscored 14-7. This is largely driven by the fact that they tend to get outshot without their star players on the ice, and have posted an Expected Goals for percentage of only 47.69 percent.
Florida, on the other hand, has posted much better results without their top-end players on the ice this postseason. If we use Sam Reinhart and Matthew Tkachuk as proxies for their top lines, we uncover the fact that in over 340 minutes without their star players, or 41 percent of their total ice time, the Panthers have outscored opponents 11-8 during this run. Looking at the on-ice numbers above, we see that the vast majority of Florida’s skaters, including those on depth forward line and defence pairings, are posting positive shot and scoring chance differentials. And it’s reasonable to expect their success to generate chances to continue.
Edmonton had their way with Dallas’ top-end players in the last series, which wasn’t overly surprising as some of the Stars forwards were performing poorly at even-strength heading into the Western Conference finals. This upcoming match-up against the Panthers is going to be a lot tougher, and the Oilers will need much better even-strength performances from depth players like Henrique and Brown. Especially if the Panthers’ top players can slow down McDavid’s line. I suspect we’ll see the Panthers target the weaker spots on the Oilers’ roster through tactics and line matchups, especially the blue line.
With the Edmonton Oilers set to face off against the Vancouver Canucks in the second round, I wanted to get a sense of how each team’s special teams have performed in the regular season and this year’s postseason. Both teams finished at the top of Pacific Division table in the regular season, largely due to their dominance at even-strength (5v5). The Canucks posted the second-best goal-share in the league (57.89 percent, +51 goal differential), while the Oilers ranked fifth (55.78 goals for percentage, +40 goal differential). So the difference in this upcoming series could come down to how well each team executes on special teams.
So far in the playoffs, the Oilers have been absolutely dominant on the penalty kill. They didn’t allow a single goal in the 24 minutes they were short-handed against the Los Angeles Kings in their five-game series. This was largely because they limited the Kings to only 16 shots in total. That translates to a rate of 40.20 shots per hour, which ranked 13th in the playoffs. The Kings weren’t great at generating powerplay shots during the regular season – ranking 27th in the league with 49.05 shots per hour – so it wasn’t overly surprising to see them struggle against an Oilers club that allowed the sixth lowest rate of shots against and had league average goaltending. And this is an area where the Oilers might have an edge over the Canucks.
In their first-round series against the Nashville Predators, the Canucks powerplay generated only 10 shots in about 21 minutes (28.35 per hour) and scored twice. This wasn’t overly surprising, considering the Predators’ penalty kill allowed the tenth-lowest rate of shots against in the regular season (52.05) and really suffocated the Canucks in all aspects of the game. The Canucks powerplay has to be better to overcome the Oilers penalty kill. Still, it’s hard to have too much confidence in them when they generated a league-average rate of shots on the powerplay during the regular season. Not expecting the Oilers penalty kill to have another stretch where they allow zero goals – but they have a good chance of being a difference-maker against a Canucks powerplay that is struggling to create opportunities.
The Oilers’ powerplay should also continue to do well in the second round, but they might not post the same numbers that they did against the Kings. The Oilers’ powerplay really had their way in the first round, posting the highest rate of shots and leading the league with nine goals in 27 minutes. This wasn’t overly surprising since the Kings, while having excellent results on the penalty kill during the regular season, had some underlying issues that indicated their results weren’t sustainable. The reasons for the Oilers’ success are obvious: they’re running with the same cluster of players who are healthy and have had great results over a long time together. And there’s little reason to believe that the Oilers’ powerplay would stall in the second round.
The Canucks penalty kill, however, should put up a better fight against the Oilers than the Kings did. The Canucks posted the third-lowest rate of shots among the first-round teams and allowed only two goals . And while they hovered around league-average levels when it came to shots against and goals against during the regular season, the Canucks penalty kill really improved over the final twenty-five games before the playoffs.
Below is the Canucks rate of shots against on the penalty kill during the regular season, over rolling twenty-five game periods. The blue line across represents the league-average rate of shots against during the regular season (55.05 per hour).
While the Canucks hovered around league average rates of shots against for most of the year, they posted a rate of 44.91 in their final twenty five games – which was the sixth lowest rate in the league. The rate of shots against is something that the coaching staff can control through tactics and player deployment, so I’d be interested to know what adjustments’ they made that helped drive their performance. It’ll be interesting to see how they perform against an Oilers powerplay that’s red-hot, and if they’ll at least be able to limit the shots and chances against.
After four games, and the Edmonton Oilers up 3-1 in the series against the Los Angeles Kings, I wanted to get a sense of how the teams have compared and what each teams strengths and weaknesses have been across their respective rosters.
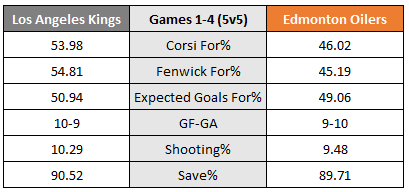
Let’s start with even-strength (5v5), where the Kings have the slight edge in results, outscoring the Oilers 10-9. And while the Kings have controlled the total share of shot attempts and unblocked shot attempts, things are a lot closer between the two teams when you factor in shot quality, type and location. The Kings are creating shots from anywhere and everywhere, posting a Corsi For percentage of 53.98 percent. But their expected goal-share of 50.94 percent is only slightly better than Edmonton’s. Maybe the Kings’ shot-volume approach eventually creates more havoc in the Oilers’ zone, puts more pressure on Skinner and the defencemen, and creates more high-danger chances. For now, the Oilers don’t seem to have a problem limiting the Kings and can hopefully put them away soon.
Special teams are where the games are currently being won, as the Oilers have scored eight powerplay goals and allowed zero on the penalty kill. The Kings have only mustered 15 shots in 22 powerplay minutes, while the Oilers have 35 powerplay shots in 19 minutes. The special team’s results haven’t been close, and it doesn’t appear the Kings will be able to turn it around based on their underlying shot metrics.
Below is a breakdown of each player’s on-ice numbers at even-strength in the first four games, sorted by time on ice. I’ve split the table into forwards and defencemen and added a simple heat map to show how each player compares relative to their teammates.
Starting with Edmonton, we see that the top line, featuring Connor McDavid and Zach Hyman, along with the pairing of Evan Bouchard and Mattias Ekholm, have been the drivers. The four have played 41 minutes together at even-strength so far and, as a group, have posted a 55.53 percent Corsi For percentage, a 74.88 (!) Expected Goals For percentage while outscoring the Kings 4-1.
Ekholm and Bouchard have been primarily with the McDavid line, while Darnell Nurse and Cody Ceci have been tied to Leon Draisaitl and whoever has been rotating through that second line. In 31 minutes together this series, Nurse, Ceci and Draisaitl have posted a 28.11 Corsi For percentage, a 16.39 Expected Goals For percentage and broken even in terms of goals (1-1). Those are some horrible shot-share numbers together, which makes me think Draisaitl should probably get some more minutes with Ekholm and Bouchard. And have Nurse and Ceci play a little more with McDavid.
Nugent-Hopkins is another player who is struggling at even-strength, posting the worst shots and expected goals differential on the team, and could be one of the reasons the second line is getting caved in so badly. I think it might benefit Draisaitl if he can have McLeod back on his wing to add some speed and puck-retrieval skills, along with Foegele. That trio performed really well in the regular season, and could improve the chances of them outscoring the Kings. But because McLeod is doing an excellent job shutting down the Kings as a center, we probably won’t see him move to wing.
Speaking of which, here’s how the Kings skaters have performed so far at even-strength.
Byfield is posting the best even-strength results in the series with a +6 goal differential. His line has been good at generating shots, but they’re having trouble sustaining pressure and creating better-quality chances. Kopitar is someone to watch, as he’s still looking dangerous after all these years. Kopitar is seeing a lot of the top two lines, but is really feasting on the Draisaitl line and posting an Expected Goals For percentage of 62.24 percent against him in 22 minutes head-to-head. The biggest disappointment for the Kings has to be Dubois, who the Kings spent significant assets to bring in and help get them over the first-round playoff hump. He’s posting the worst shot-share numbers among the Kings, and is a bit of a liability whenever he’s on the ice. What’s worth noting is that he’s spent the majority of his minutes against McLeod, who is again getting trusted by the coaching staff to play against top lines in the post-season and doing an excellent job containing good players.
Data: Natural Stat Trick
Also posted at Oilersnation.
In the first three games of their series against the Los Angeles Kings, the Edmonton Oilers have really had their way with their penalty kill. The Oilers have scored seven powerplay goals already by generating the highest rate of shots and scoring chances, and converting on 20.59 percent of their shots.
It shouldn’t be overly surprising to see the Oilers powerplay produce as the group has remained healthy and finished with the second highest rate of goals per hour during the regular season (10.53 per hour). Their success could be considered sustainable as their rate of unblocked shot attempts (or Fenwick, a proxy for scoring chances) and shots on goal were consistently one of the highest in the league. And thanks to the star power up front, and the chemistry they’ve built over the last few seasons together, the powerplay posted a team shooting percentage of 16.89 percent.
The Kings penalty kill was supposed to be one of their strengths heading into the playoffs, as the team allowed the second lowest rate of goals against during the regular season (5.37 per hour), second only to the Carolina Hurricanes. What might have been overlooked is the fact that their penalty kill results relied heavily on their goaltending, which ranked first in the league with a team save percentage of 90.65 percent. Among 70 goalies who played at least 75 minutes on the penalty kill, Cam Talbot ranked second with a 91.0 percent save percentage, while David Rittich ranked ninth with a save percentage of 89.5 percent.
An underlying issue was that the Kings actually performed pretty poorly in front of their goaltending, allowing the tenth highest rate of shots against (57.46 per hour) and the twelfth highest rate of unblocked shot attempts per hour (83.36 per hour). So while the Kings penalty kill results were great, they weren’t exactly sustainable – and its falling apart at the worst time.
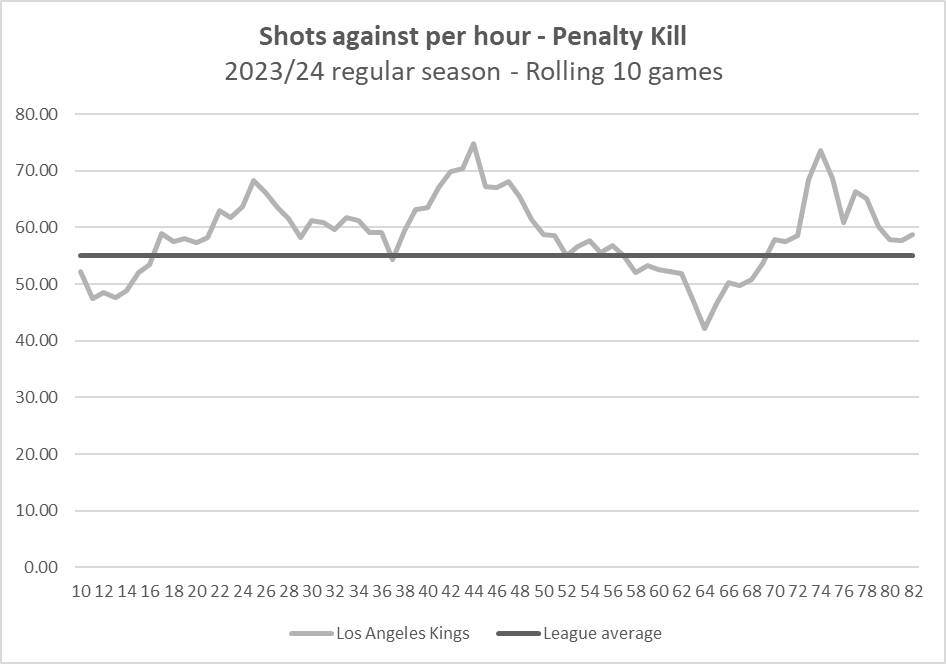
Here’s a quick look at the Kings rate of shots against per hour over the course of the regular season, broken out by rolling ten-game segments. The blue line across represents the league-average rate of shots against (55.05 per hour).
While the Kings did have some stretches where they were allowing a rate of shots that were below the league average, they were typically well above. At multiple points of the regular season, they were one of the worst teams in the league when it came to suppressing shots against, allowing over 70 shots against per hour. So it’s really not all that surprising to see their penalty kill results fall off a cliff in these first three games.
So far in the 2024 playoffs, the Kings penalty kill is allowing the highest rate of shots against and the second rate of unblocked shot attempts against in the league. Their goaltending, which was good during the regular season, has completely regressed – their team save percentage currently sits at 79.41 percent. Facing a lot of shots, playing a ton of minutes, and the general grind of the regular season can do that to you.
The other bad news for the Kings is that they should probably keep their expectations of their powerplay low as well.
They have yet to score with the man-advantage, going 0-for-10 in these first three games. And again, they might be looking at their regular season results for motivation, as they finished with the tenth highest rate of goals-for (8.40 per hour) in the league, and fourth highest in the west. But again, these results couldn’t be considered sustainable as they ranked 20th in terms of generating unblocked shot attempts per hour and 27th when it came to generating shots on goal. The Kings definitely have some talented forwards who can convert on their chances. The problem is that they’ve been terrible at consistently generating those chances. And again – things are falling off at the worst time.
The Kings’ special teams have some major underlying issues, and it’ll be up to the Oilers’ coaching staff and players to capitalize now.