Couple thoughts on Ryan McLeod, who is getting some attention for the mistake he made in Toronto on Saturday that led to a goal against.
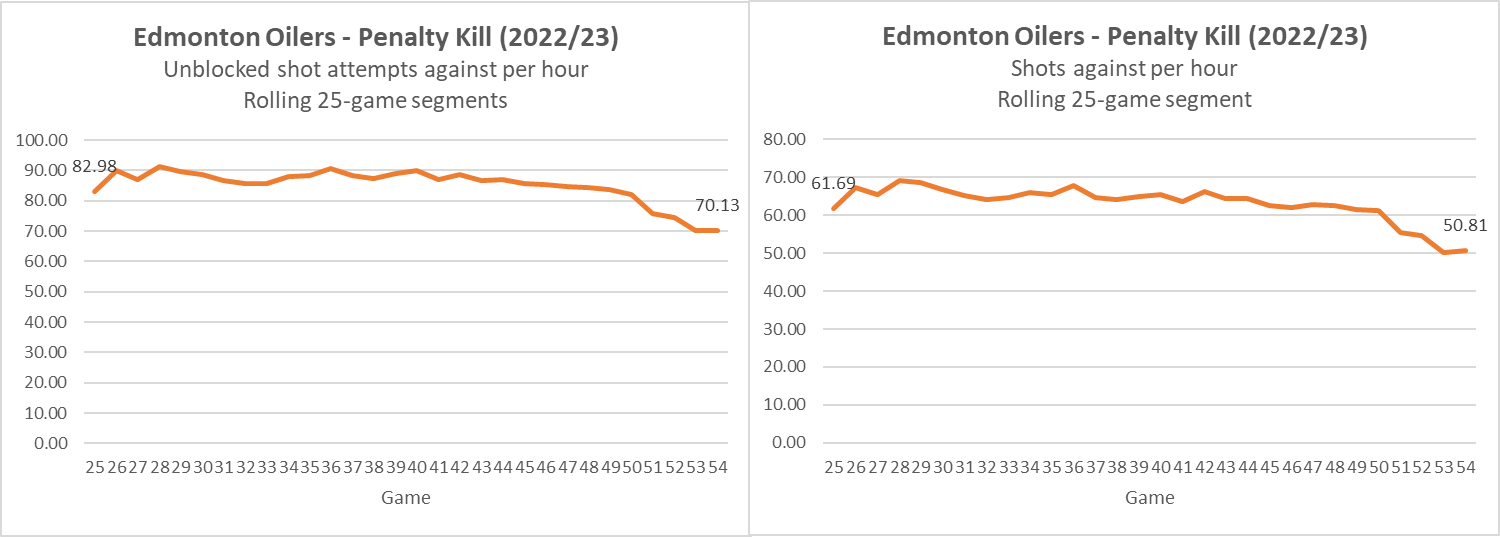
McLeod has been solid for the Edmonton Oilers this season as a centerman. He’s 23, averaging about 14 minutes per game, in a predominantly third-line role. And he’s got nine goals and nine assists at even-strength (5v5) – a rate of 1.76 points per hour, which is just under what second liners should be posting. He’s also been a regular on the penalty kill, getting the third highest total minutes. With him on the ice when shorthanded, the Oilers see their rate of shots against drop by about 15% relative to the team average.
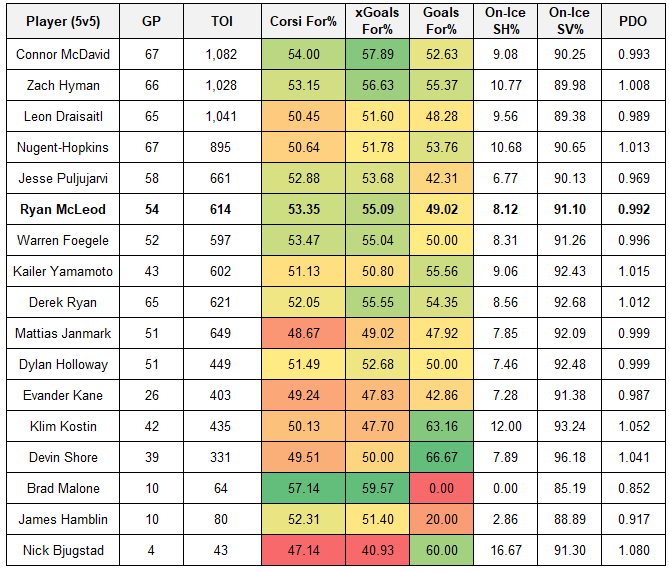
Back to even-strength. McLeod’s been a big reason why the Oilers are doing well without McDavid on the ice – a major spot of bother for the club since McDavid’s arrival. With McLeod on the ice, the Oilers have posted a Corsi For percentage of 53.35% and an Expected Goal share of 55.09% – both of which are higher than the team average. The table below lists the on-ice numbers for the Oilers forwards (sorted by ice-time) with a basic heat map applied to show how each player has done relative to their teammates this season.
Again, it should be noted that McLeod barely spends any time with McDavid. Below is a table of the Oilers forwards sorted by their proportion of ice time spent with McDavid, along with their on-ice Corsi For percentage and Expected Goals share without McDavid. McLeod has only spent 3.3% of his total ice time with the captain – one of the lowest proportions on the team. And he’s been just fine (unlike some of the other forwards), posting shot-shares above 53% – again some of the best numbers on the team.

And while it’s true that McLeod doesn’t play against the other team’s top players as often as others, when he does get deployed against them he’s done pretty well. This season McLeod has spent about 20.6% of his time against Elite competition, according to PuckIQ. And in that time, he’s posted a Corsi For% of 47.90%, which ranks 6th among the Oilers regular forwards this season. And against Elites, he’s also posted a Dangerous Fenwick share (i.e., a weighted shot metric using shot distance location and type of shot to give each shot a “danger” value) of 53.20%, which ranks second on the team only behind McDavid. There’s a reason why he was even on the ice against Marner on Saturday night.
:no_upscale()/cdn.vox-cdn.com/uploads/chorus_asset/file/24506049/McLeod3.png)
If there’s still any doubt about McLeod’s abilities or hesitation of deploying him regularly in meaningful moments, look no further than his performance in last season’s playoffs. With him on the ice at even-strength, the Oilers posted some of the best shot-shares – including a 53.60% Corsi For percentage (third highest on the team) and a 54.57% Expected Goals share (fifth highest). When the Oilers got crushed by the Avalanche in the western conference finals, McLeod was one of two players who had a positive shot-differential and broke even in terms of goals. My personal favorite stats for McLeod were from the second round series against Calgary. In that series, McLeod played about 14 minutes head-to-head against the Tkachuk line and went 20-10 in shot attempts, 9-7 in shots and 1-0 in goals. That’s the kind of productivity a team needs from their depth players to win games.
McLeod has been solid for the Oilers this season and has provided exceptional value based on the contract he’s currently on. His on-ice performance numbers and productivity is all you can ask for from a young centerman playing third-line minutes and the penalty kill. And there’s no doubt he’ll continue to grow if he’s in the right environment for development. He’ll make mistakes like any other player, but his importance to the team and the long-term goals cannot be overlooked.
Regular season, even-strength, penalty kill, playoffs. This is the kind of depth player that’s going to increase your chances of winning games.
Data: Natural Stat Trick
Also posted at The Copper & Blue.

:no_upscale()/cdn.vox-cdn.com/uploads/chorus_asset/file/24441647/PP_GF60.png)
:no_upscale()/cdn.vox-cdn.com/uploads/chorus_asset/file/24441672/PP_ShotsandFF60.png)
:no_upscale()/cdn.vox-cdn.com/uploads/chorus_asset/file/24441692/PP_Appendix1.png)
:no_upscale()/cdn.vox-cdn.com/uploads/chorus_asset/file/24441697/PP_Appendix2.png)