Drawbacks of the Edmonton Oilers having two five-man units

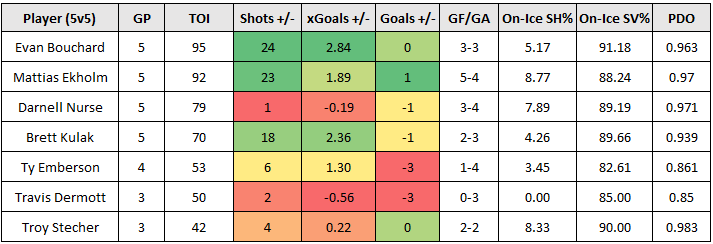
I recently wrote about how the Edmonton Oilers have recently been getting a lot more out of defenceman Darnell Nurse, as his performance numbers and results have been significantly better than earlier this season. And it’s largely driven by the fact that he’s being deployed a lot more often with Leon Draisaitl’s line. Full article is at Oilersnation.

This had me wondering if deploying Nurse exclusively with Draisaitl’s line and continuing to deploy the Bouchard/Ekholm tandem almost exclusively with McDavid’s line actually makes sense. The results should be great for those two five-man units as there’s plenty of skill and talent there. But wouldn’t that make the rest of the Oilers roster easier to exploit at even-strength?

Looking at the on-ice data, it appears as though the Oilers have recently been exposed, making them an easier target for team’s with depth and skill spread across the lineup.

In the last ten games, without the McDavid/Bouchard/Ekholm set or the Draisaitl/Nurse set, the Oilers have posted the following numbers at even-strength (5v5):

  • Corsi for percentage: 40.74%
  • Expected goals for percentage: 37.24%
  • Goals for percentage: 40.00% (4 goals for, 6 goals against)

The Oilers have played 138 minutes without their two five-man units, which was about 28 percent of the team’s total time in the last ten games. Two concerns with that:

  • The star players are playing a lot more, likely because the Oilers coaching staff urgently needed to make some ground in the standings. I’d expect their minutes to taper off eventually as the season wears on and to stay fresh for the playoffs. But if the depth players are constantly getting outscored, who knows.
  • That’s a good chunk of time that another team could target and exploit, and make life difficult for Edmonton. The Oilers third and fourth lines do a decent job defending, but they generate and score a lot less.

What’s also interesting is how the team’s depth players (i.e., the team without their two five-man units) are impacting the team’s overall shot-share numbers (Corsi For percentage) as well as their share of expected goals.

This graph shows the Oilers Corsi For percentage, with score effects factored in (solid line), over rolling ten game segments. They were at one point one of the best teams in the league, hovering around the 55 percent mark. But it’s gradually declined closer to the break-even mark.

.

And this graph shows the Oilers expected goals share, which is trending even worse. Sitting below 50 percent in the last ten games is a little alarming. And it wouldn’t be surprising if their actual results at even-strength start to slip in the coming weeks.

.

I don’t think there’s a quick, internal solution here either. Having Nurse play more often with the third and fourth lines isn’t going to work as we know the numbers have been poor in those situations. Plus he’s playing some of his best hockey right now, and I doubt he’d want to play fewer minutes with the star players. My guess is the Oilers will need to give their third pairing an offensive boost, which the Oilers appear to be addressing by acquiring Alec Regula off waivers (draft profile here). It’ll be interesting to see how that plays out and if the third and fourth lines, along with the third defence pair, can improve their on-ice numbers at even-strength.

Data: Natural Stat Trick

The redeployment of Darnell Nurse is leading to some of his best hockey for the Oilers

The Edmonton Oilers made significant progress in November and now have 32 points in 27 games—a points percentage of 0.593 that ranks seventh in the Western Conference and fourth in the division. Their first ten games of the season really set them back (4-5-1), as they were, at one point, 13th in the conference and only ahead of San Jose in the Pacific.

There are plenty of reasons for their resurgence, but one player in particular who has helped turn things around is defenceman Darnell Nurse. He’s been more noticeable recently (for good reasons) making some great plays on Saturday night against St. Louis and helping set up Corey Perry with a nifty pass for the opening goal.

Nurse had really been struggling early on this season, especially at even-strength (5v5). In 171 minutes over the first ten games of the year (up until October 30), he had a 25 percent on-ice goal-share (on the ice for three goals for and nine goals against). And he was posting some of the worst shot-share numbers on the team as opponents would more often outshoot and outchance the Oilers with Nurse on the ice. What really stood out in those first ten games was how almost every forward on the Oilers was posting better on-ice shot-share numbers when they were playing away from him (i.e., without Nurse on the ice), as Nurse’s performance was really dragging his teammates down.

.

Since those first ten games, however, Nurse has been posting significantly better numbers with the team doing a better job controlling the flow of play and scoring chances with him on the ice. His on-ice shot-share numbers at even-strength are all above 53 percent and some of the best numbers on the team. The best part is that his actual results (i.e., goal-share/goal-differentials) have been excellent, as the team has posted a goal-share of 82 percent — nine goals for, two goals against with Nurse on the ice. That goal-share isn’t sustainable and will gradually decline, but his underlying shot-share numbers indicate that the Oilers are more likely to outscore opponents with Nurse on the ice if he continues to perform at this level.

Now this turnaround didn’t happen automatically, and it appears there have been some very strategic adjustments made by the Oilers coaching staff. There’s a lot of pressure on this team this season to win games and make a deep playoff run. And to also maintain the value of their players, especially those on heavy, long-term deals like Nurse. So, it behooves the coaching staff to recognize problems, find potential solutions to improve their odds of winning games and have the courage to carry through on them.

One solution to the Nurse performance problem has been more ice time with Leon Draisaitl.

As I had written about in late October, Nurse played a lot of his even-strength minutes with the depth forwards in the first ten games of the season – specifically the third and fourth lines. Of the 171 minutes Nurse was deployed for, about 35 percent was with Adam Henrique and 32 percent was with the fourth line (basically when McDavid, Draisaitl or Henrique weren’t on the ice). About 23 percent was with Leon Draisaitl and Nurse played the least often with McDavid’s line, as that top line has exclusively been deployed with the Evan Bouchard/Mattias Ekholm pairing – a five-man unit pretty much all season.

Since those first ten games Nurse’s deployment has significantly changed, with more of his time being spent with Draisaitl, and whoever is on the second line, and less time with the third and fourth lines. The table below splits Nurse’s season between his first ten games (up until October 30) and the last fourteen games (between October 31 and December 7). Note that Nurse did miss a few games with a head injury.

.

What we see here is that Nurse’s overall proportion of ice time with Draisaitl has significantly increased from about 23 percent in the first ten games to just under 40 percent in the last fourteen games – essentially creating a second five-man unit for the coaching staff to deploy. Nurse’s proportion of ice time with Henrique has dropped from 34 percent to 26 percent. And his time with the fourth-line players dropped from 33 percent to just under 11 percent.

This re-adjustment of Nurse’s deployment makes a lot of sense as he’s now playing more often with a second line who he was performing well within the first ten games of the season. One of my findings back in late October was that while Nurse dragged the performance numbers of most of the forwards down, his numbers remained respectable with Draisaitl, Podkolzin and Arvidsson – the group that basically formed the second line. So far things are going well as Nurse is not only performing well in his increased minutes with Draisaitl and the second line, but also playing much better in the minutes with the depth players.

It’d be worth asking the Oilers coaching staff if this actually was a strategic plan to help Nurse’s performance numbers improve. And if players like Nurse, who are accustomed to playing with high-end players tend to play down to the level of their linemates. My thought is when a defenceman like Nurse is out with a fourth line, for example, they may be conserving their energy and risk-taking for when they get to play with higher-end linemates, but that’s something a coach or player can speak to.

For now, it’s interesting to see how a coaching staff has adjusted a player’s deployment, and potentially used data and underlying shot-share numbers to assist with decision-making. Recognizing deficiencies, identifying solutions, and having the courage to carry them out is critical for a team pushing for championship. Hopefully, there’s more to come – especially for a roster that hasn’t quite reached its potential yet.

Data: Natural Stat Trick

Also posted at Oilersnation.

Tracking the Western conference – As of November 30, 2024

Much better results from the Edmonton Oilers this month as they moved from tenth in the west to seventh currently sitting with a points percentage of 0.583. They finished November with a record of 8-4-1, and ranked fourth in the league in terms of points percentage (0.654) only behind Minnesota, Toronto and Washington. What’s interesting is that their goal-differential during this recent stretch has only been even (28 goals for, 28 goals against). Considering their strong shot-share numbers, it probably should have been better. Could have also used some better goaltending. But all that matters for now are the points being accumulated, and the rise in the standings.

Below are the current even-strength (5v5) numbers for each team in the western conference (sorted by points percentage), including goal-share results as well as the shot-share metrics that give us a sense of which teams have the right processes in place and if the results are sustainable or not. At the end of the table are each team’s shooting percentage and save percentage. I’ve also applied a basic heat map to each metric to show which teams are doing well or struggling relative to their conference foes (i.e., green is good, red is bad). You can also find a description of each metric at the end of this article. Please note that the shot-share metrics are score and venue adjusted based on Natural Stat Trick’s methodology.

We’re starting to see teams fall into their places, just based on what their shot share numbers have been like. For example, Edmonton and Colorado had good shot-share numbers last month and ranked poorly. But things have turned around for both clubs in the last month, and they’ve gained ground in the west. And we’ve seen teams like Calgary and Anaheim who were getting outshot regularly but getting good results last month, start to crash down back to earth.

We’re also starting to see which teams have issues to address in net, especially those with championship aspirations. Edmonton, Colorado, Vegas and Vancouver may need to keep an eye on the goalie market, and it’ll be interesting to see which of them can turn things around.

Edmonton and Colorado also have their even-strength scoring issues to address, as both rank near the bottom the league when it comes to finishing chances. Colorado is also relying heavily on their special teams to bail their even-strength play out.

Also do wonder if we’ll see Winnipeg and especially Vegas fall in the standings, as both clubs have had issues controlling the flow of play, and rely heavily either on their goaltending (Winnipeg) or ability to finish chances (Vegas).

And I do think we’ll see Utah start to climb up. They’re posting solid shot-share numbers and have one of the best even-strength goal-shares in the league. The issue for them is that their special teams have been terrible. Their powerplay is generating very few chances and goals. And their penalty kill allows one of the highest rates of shots against, and is relying heavily on their goaltending to allow an average rate of goals against. If they can figure out special teams, they could be very good.

Data: Natural Stat Trick

Glossary:

  • Points-percentage (Point%) – The total points accumulated divided by the points that were available, including extra time.
  • Corsi for percentage (CF%) – The proportion of all the shot attempts the team generated and allowed that the team generated (i.e., corsi for/(corsi for + corsi against). This is used as a proxy for possession and is the best at predicting a team’steam’s future share of goals (GF%). (Source: Hockey Great Tapes – Draglikepull)
  • Fenwick for percentage (FF%) – The proportion of all the unblocked shot attempts the team generated and allowed that the team generated (i.e., Fenwick for/(Fenwick for + aenwick against). This is used as a proxy for shot quality and considers shot blocking a repeatable skill.
  • Expected goals for percentage (xGF%) – This is a weighting placed on every unblocked shot based on the probability of the shot becoming a goal. This depends on the type of shot, location and uses historical shot and goals data to come up with the probability for each unblocked shot.
  • Goals for percentage (GF%) – The proportion of all the goals that the team scored and allowed that the team generated (i.e., Goals for/(Goals for + goals against).
  • Shooting percentage (SH%) – The percentage of the team’steam’s shots on goal that became goals (i.e., total goals divided by the total shots on goal).
  • Save percentage (SV%) – The percentage of the team’steam’s shots on goal against that were saved (i.e., 1-(totals goals allowed divided by the total shots on goal against)).

Confidence levels

The Edmonton Oilers currently rank 16th in the league with a 0.545 points percentage, and have been pretty mid at even-strength (5v5). Their goal differential has been steadily improving, but they’re currently at -3 (43 goals for, 46 goals against). They’re only shooting at 7.05 percent (26th in the league) and have a team save percentage of 90.25 percent (23rd in the league). Note that the league average shooting percentage over the last three seasons has been 8.55 percent and the save percentage has been 91.47 percent. More on that in a second.

The Oilers are currently posting some excellent shot-share numbers, near the top of the league when it comes to critical metrics like Corsi For percentage and Expected Goals For percentage. So in a perfect world, their current goal-share of 48.31 percent eventually reaches somewhere around 53 to 55 percent, which is around where they were last season and the prior three seasons. Getting there is going to require the team and save percentage bouncing back. But how much confidence should we have in one or both of those things happening?

Based just on what I’ve seen from the Oilers, I have a lot more confidence in the team’s shooting percentage turning around. They have the top end talent, they have some depth pieces who have a good track record of scoring goals. And they’ve been relatively healthy, but we’ll wait to see what the long-term prognosis is for Hyman and Arviddson. The goaltending on the other hand has been pretty suspect for a while now, and there’s been enough mediocre stretches to indicate that goaltending is never going to be truly elite. But are there numbers to back this up?

First, here’s a look at the Oilers cumulative team shooting percentage at even-strength this season and last season (2023/24). The gray line across represents the league average shooting percentage from the previous three seasons (2021-2024). What stands out here is that while the Oilers didn’t do a great job converting their chances early on last season, they eventually improved and were above league average rates for the most part. Not sure if the Oilers can replicate that this season, but with the talent up front, and a decent supporting cast, it’s more than likely.

Goaltending on the other hand had some issues last season, and the best they could ever reach was league average. Not a lot of times was the goaltending one of the league’s best last season, so it’s hard to expect them to steal games this year or go on a long stretch of high-end goaltending. Especially since it’s the same two goalies as last season. The most we can reasonably expect from Skinner and Pickard is league-average, and a lot has to break right even for that.

I do wonder what the Oilers front office is thinking and what they have more confidence in bouncing back: the team save percentage or the team shooting percentage? It’s clear both areas have cost them wins this season and there’s a sense that it’s the offensive side of things that have management more concerned. My thought is that the goaltending is what needs an upgrade, and hopefully soon considering the high expectations for the team.

Data: Natural Stat Trick

Here’s what’s behind Jeff Skinner’s early-season struggles

It’s been a tough start to the season for Edmonton Oilers forward Jeff Skinner.

In his first seventeen games since signing a one-year, $3 million deal with the Oilers in the summer, Skinner has scored three goals and made three assists, all at even-strength. His on-ice goal-differential at even-strength is currently -5 (6 goals for, 11 goals against), which translates to a 35 percent goals-for percentage that currently ranks second last among Edmonton’s forwards. Considering he’s played the sixth most minutes on the team (217) and ranks sixth in average ice time per game at even-strength (12.79), his results are a problem that’s hard to ignore.

Over the last few games, the coaching staff has started to sit Skinner more often at even-strength. In the last two games, Skinner has averaged less than nine minutes, which is about 17 percent of the Oilers total even-strength time.  That’s well below the previous fifteen games where he’s averaged about 13 minutes a game, and 26 percent of the Oilers total even-strength time. The table below shows Skinner’s proportion of ice time per game in blue and the actual ice time per game in orange.

A graph showing how Jeff Skinner's ice time and proportion of ice as an Edmonton Oiler has been gradually declining at even-strength.

.

There are a couple of major issues with Skinner that have likely played a role in his decreased ice time.

One, Skinner just isn’t producing at the level and consistency that management was probably expecting from him. He’s scored three times on 44 shots so far – which is a shooting percentage of 6.82 percent. That’s well below the 10.98 shooting percentage he’s posted over his previous five regular seasons, and the 10.65 percent he’s posted over his fourteen-year career.  The Oilers are currently near the bottom of the league in terms of team shooting percentage (6.68 percent) and are relying on Skinner to help turn those even-strength results around.

.

The other issue is that Skinner’s on-ice numbers at even-strength, relative to his team’s numbers, have been poor so far. Corsi (or shot attempts) and Expected Goals help us understand how well the team does at controlling the flow of play and out-chancing opponents with specific players on the ice. And it helps us uncover who could be helping drive play and opportunities for a team, and who might be dragging the team down.

Skinner would currently fall under this latter category as the team is posting an Expected Goals For percentage of 52.45 percent with him on the ice, which isn’t bad. But his team’s share of Expected Goals jumps to 57.98 percent when he’s on the bench. Below is a table with all of the Oilers’ forwards on-ice relative to team numbers, sorted by average ice time per game. A basic heat map is applied to each metric (green is good, red is bad) to give a sense of how each player compares to their teammates.

A table showing each Edmonton Oilers forward's relative to team numbers at even-strength this season.

.

One issue with Skinner is that the team allows a significantly higher number of shots and chances against whenever he’s on the ice. For instance, without him on the ice, the Oilers allow about 23 shots against per hour. But when Skinner is on the ice, this rate jumps by about 25% to 30 shots against per hour. He’s one of the worst defensive forwards on the team, which isn’t overly surprising considering his previous teams have often allowed more shots when he’s on the ice. The difference in prior seasons was that he would help drive more offence and generate chances. But since he’s not having the same impact and the fact that his shooting percentage is down, he’s not providing a whole lot of value for the Oilers.

Worth noting that Ryan Nugent-Hopkins is also posting similar on-ice numbers as Skinner at even-strength, as the team tends to see a lot of chances against when he’s deployed. And it should probably be addressed by the coaching staff, considering he gets a lot of time in the top six with the star players. But because Nugent-Hopkins is on the first powerplay and kills penalties and has a +1 goal differential at even-strength, his underlying issues are likely going to be overlooked. At least for now.

As for Skinner, it’s understandable why the coaching staff has recently cut his minutes. His defensive play this season has been an ongoing issue, and it’s not just a couple of bad plays here and there that have led to this situation. Hopefully, there’s a plan in place to squeeze as much value out of Skinner as possible. But there’s also the harsh reality that Skinner’s defensive play has been a long-term issue over his previous seasons. And considering his age and the fact that he’s played over 1,000 NHL games, it’s hard to expect his defensive numbers to improve anytime soon.

Data: Natural Stat Trick

Also posted at Oilersnation.

Bouncing back

Scoring at even-strength (5v5) has been a major problem for the Edmonton Oilers this season. After 16 games, or about 20% of the regular season, the Oilers rank 28th in the league with a 6.84 percent team shooting percentage. That’s only ahead of San Jose, Detroit, Anaheim and Nashville.

Last regular season, the Oilers finished the year right around league average with a team shooting percentage of 8.81 percent, good for 15th in the league. They started the 2023/24 season just as poorly, posting an almost identical shooting percentage after their first sixteen games – only converting on 6.46 percent of their shots.

Below is a graph showing the Oilers cumulative shooting percentage over the course of last season (orange line). It took them a while to get going, but they finished the regular season well. And the shorter blue line represents the Oilers cumulative shooting percentage for the current regular season.

.

With the talent level they have and the team’s dominance when it comes to controlling the flow of play and scoring chances at even-strength, it’s likely that the Oilers team shooting percentage gradually improves and stops costing them games. But there’s a couple issues that they’ll need to address to improve their odds of scoring more frequently at even-strength.

First, the team needs to reduce the amount of low-danger shot attempts and shots. There’s been a few too many games where it’s felt like the opposing goalie is putting on an all-star performance. But it’s largely due to the Oilers rate of low-danger shot attempts (38.93 per hour) and low-danger shots on goal (13.91), both of which are close to highest in the league (based on Natural Stat Trick’s methodology). The Oilers are definitely a high-volume shot team, as they’re also good at generating higher danger chances. But when they do get those high danger chances, it’s like the opposing goalie is warmed up from all of the lower danger ones that they already faced and is making key saves.

The second issue for the Oilers to address is getting more shots from the forwards instead of the defencemen. So far this season, over 40 percent of their shot attempts and over 35 percent of their shots on goal are from their blueline, which is much higher than league average levels and the level they were at last year (refer to the table below). The team is about 5% higher than where they should be.

Proportion from defencemen (5v5) Shot attempts Unblocked shot attempts Shots on goal
League average (3 seasons) 34.3% 30.3% 29.6%
2023/24, Oilers 35.5% 31.0% 31.2%
2024/25, Oilers 40.1% 35.4% 35.3%

.

Considering how much bigger and more skilled the goalies are, and how much tighter teams are playing defence, it doesn’t make sense to create shots from low-percentage scoring areas. We’re seeing a trend in shooters taking fewer shots, and making more east-west plays to create higher quality chances and improve their odds of scoring. Maybe it’s the lack of passing talent on the Oilers blue line causing this, or just the team getting used to one another after so many roster changes. But it’ll need to be addressed if the team wants to improve their shooting percentage – and start climbing back up the standings.

Data: Natural Stat Trick

Related:

The Edmonton Oilers special teams are off the rails

One of the biggest reasons the Edmonton Oilers currently rank fifth in the Pacific and tenth in the western conference with a 0.464 points percentage is because of the terrible results on the power play and the penalty kill.

The powerplay was expected to continue being one of the best in the league, a status it’s maintained for a few years now thanks to their offensive talent and the fact that they’ve been together for so long. But in the first fourteen games of the season, the Oilers have only scored five times in 62 powerplay minutes, a rate of 4.82 goals per hour. That’s one of the worst in the league (just behind Anaheim) and well below the 9.69 goals per hour they had last season and the 13.21 they posted the year before.

The Oilers abysmal output rate on the powerplay is a level they never reached last season. The graph below shows the Oilers rate of goals per hour last season in fourteen-game rolling periods, with the blue line across representing their rate from the first fourteen games this season (4.82).

.

What’s especially alarming is that the Oilers rate of shots on the powerplay are also well below where it’s usually been. Again, they typically lead the league in generating chances, doing a good job getting shots through and retrieving rebounds to set up another ad hoc play. But it just hasn’t been happening as teams appear to have figured them out. Their current rate of 37.58 shots per hour is the second lowest in the league, and again well below what they posted over any fourteen-game rolling period last season. This indicates that the results on the power play might not turn around as quickly as expected, and that tactical and deployment changes are needed to get their rate of shots and chances up to where it should be.

The other interesting find here is that the Oilers rate of shots last season were gradually declining, which somewhat confirms what I was suspecting. Other teams may be figuring out the Oilers powerplay and have been using different tactics to slow them down.

.

Switching to the penalty kill, the Oilers are also far-off from their rate of goals against from last season. They currently rank dead last in the league allowing 16.27 goals per hour (represented by the blue line in the graph below). Last season, they were closer to league average with 7.55 goals against per hour, and at no point did they allow this high of a rate of goals against.

.

The good news is that the Oilers penalty kill is allowing an average rate of shots against (53.13) and closer in line to what they were posting last season (49.27). That’s a good indicator that the team has the right tactics and skaters, despite all of the roster changes in the off-season. The issue is that their goaltending isn’t pulling their weight and posting a save percentage of 69.39 percent (!) – the worst in the league. Skinner has a history now of struggling for stretches on the penalty kill despite his team limiting shots and chances against. So it’s difficult to have confidence in his abilities going forward.

.

One last note. The Oilers special teams, based on their shots and expected goals for and against, and average shooting and save percentages, should have a goal differential of +1.85. Their powerplay is struggling to create chances, otherwise this number would be better. But because of that, and how badly the goaltending has faltered on the penalty kill, the Oilers combined special teams goal-differential is actually -10. That’s a difference of almost 12 goals, which translates to a couple wins in the standings. The Oilers should be sitting in the top three in the Pacific, but are instead sitting tenth in the west.

Data: Natural Stat Trick

Tracking the Western conference – As of October 31, 2024

In past seasons, I’ve done Pacific-division reviews for the first few months and then switched to the western conference reviews as the playoff races started to pick up. This season, I’ll be just getting straight into the western conference. The Oilers are pushing for banners and championships, so I’m more interested in how they stack up with the rest of the conference. Especially the central division which has a couple legit contenders.

The Oilers are off to a slow start, which isn’t overly surprising considering all of the new players who need time to adjust, the loss of speed and talent in the off-season, the holes on defence and the goaltending. The good news is that overall, the team is playing well and controlling the flow of play and scoring chances. They just can’t capitalize on their opportunities or get a save. Plus their special teams have been a mess.

Below are the even-strength (5v5) numbers for each team in the western conference (sorted by points percentage), including goal-share results as well as the shot-share metrics that give us a sense of which teams have the right processes in place and if the results are sustainable or not. At the end of the table are each team’s shooting percentage and save percentage. I’ve also applied a basic heat map to each metric to show which teams are doing well or struggling relative to their conference foes (i.e., green is good, red is bad). You can also find a description of each metric at the end of this article. Please note that the shot-share metrics are score and venue adjusted based on Natural Stat Trick’s methodology.

.

After 11 games, the Oilers are sitting 10th in the western conference with a 0.500 points percentage. That’s tied with Anaheim and Seattle, neither of which are contending for much this season. What stands out is that the Oilers have posted some of the best shot-share numbers in the league. Yes, they have trailed a lot in games which skews the numbers as teams with the lead play less aggresively. But even when the scores have been close (within one goal) or tied, the Oilers shot-share numbers have been excellent. The issue is that their team shooting percentage is one of the worst in the league and their goaltending has been below average. If they can even be average at scoring and saving goals, they should move up the standings quickly.

I’d expect teams like Anaheim, San Jose, Seattle, Calgary and St. Louis to gradually drop in the standings. And it’ll be interesting to see where Vegas lands, as they have the talent but don’t appear to have sustainable results. They’re currently posting some poor shot-share numbers, and their results appear to be driven by a higher than normal shooting percentage.

The one other thing I’m interested in tracking is the volume of low-danger shots the OIlers generate this season. There was an interesting piece by Justin Bourne on Sportsnet about how teams that generate a lot of low danger shots are not doing themselves any favors, and are actually helping the opposing goalie get into the game more.

This all brings me to a detail from a more recent Valiquette interview, where he noted the data from his company, Clear Sight Analytics, shows a connection to low danger shots and losing. Teams have the highest winning percentage when they get seven or more high danger shots, while at the same time taking 12 or fewer low danger shots.

While it’s certainly not a solution on its own, the data showed teams that take just 0-9 low danger shots in a game win 60 per cent of the time, while teams that get up around 23-25 win just 33 per cent of the time. You end up keeping the opposing goalie warm and engaged, and essentially create turnovers via bad shots. You go from having solid possession to a whistle, or possibly to the other team having the puck.

Right now the Oilers are generating the third highest rate of low-danger shot attempts and the fifth highest rate of low-danger shots on goal at even-strength, which could explain why they’re having trouble scoring despite having the puck a lot.

Data: Natural Stat Trick

Glossary:

  • Points-percentage (Point%) – The total points accumulated divided by the points that were available, including extra time.
  • Corsi for percentage (CF%) – The proportion of all the shot attempts the team generated and allowed that the team generated (i.e., corsi for/(corsi for + corsi against). This is used as a proxy for possession and is the best at predicting a team’steam’s future share of goals (GF%). (Source: Hockey Great Tapes – Draglikepull)
  • Fenwick for percentage (FF%) – The proportion of all the unblocked shot attempts the team generated and allowed that the team generated (i.e., Fenwick for/(Fenwick for + aenwick against). This is used as a proxy for shot quality and considers shot blocking a repeatable skill.
  • Expected goals for percentage (xGF%) – This is a weighting placed on every unblocked shot based on the probability of the shot becoming a goal. This depends on the type of shot, location and uses historical shot and goals data to come up with the probability for each unblocked shot.
  • Goals for percentage (GF%) – The proportion of all the goals that the team scored and allowed that the team generated (i.e., Goals for/(Goals for + goals against).
  • Shooting percentage (SH%) – The percentage of the team’steam’s shots on goal that became goals (i.e., total goals divided by the total shots on goal).
  • Save percentage (SV%) – The percentage of the team’steam’s shots on goal against that were saved (i.e., 1-(totals goals allowed divided by the total shots on goal against)).

Diving into Darnell Nurse’s struggles to start the Oilers’ season

There are a lot of reasons why things are going sideways right now for the Edmonton Oilers. And it’s happening at a team level, in every game state, and at individual levels.

Despite doing a very good job at controlling the flow of play and getting a good proportion of the scoring chances at even-strength (even when the score is close), the Oilers are having trouble finishing chances and stopping pucks. Their special teams have also been terrible, costing them wins. They’re currently one of the worst teams in the league at generating chances on the powerplay, even with the same group and talent-level as last season. And while the penalty kill has been fine at limiting chances against, they can’t get enough saves from their goaltenders.

One player in particular who has struggled in the first ten games this season has been defenceman Darnell Nurse. With him on the ice at even-strength (5v5), the Oilers are posting a Corsi For percentage of 49.05 percent and an Expected Goals For percentage of 44.60 percent – some of the worst numbers on the team. Without him on the ice, these numbers improve significantly, with the team’s Corsi For percentage improving by 18 percent (up to a 59.8 Corsi For percentage) and the Expected Goals For percentage improving by 24 percent (58.52). When you combine his poor-on-ice shot-share numbers with the team’s very shaky goaltending, it’s no wonder that Nurse’s on-ice goal share of 33% (3 goals for, 6 goals against) is one of the worst on the team.

And it’s far below what any management group would expect from one of the highest-paid defencemen in the league.

What’s also been eye-opening is how much the Oilers forwards struggle to control the flow of play at even-strength when they have to share the ice with Nurse. When we compare every forward’s on-ice Corsi For percentage with Nurse and without Nurse, we see only two players being able to weather Nurse’s deficiencies: Zach Hyman and Connor McDavid (just barely).

The graph below sorts the forwards from those who have played the most even-strength minutes with Nurse to those who have played the fewest. The table shows each player’s time on ice with Nurse, their Corsi For percentage with Nurse and their Corsi For percentage without him.

.

What stands out here is that Nurse has typically been playing with third-line players like Adam Henrique, who he has played his most minutes, Connor Brown and Mattias Janmark. And because of Nurse and the minutes they have to play with him, these three forwards have seen their on-ice shot-share numbers take a hit and rank as some of the worst on the team. But when they’re away from Nurse, their numbers drastically improve, which in turn helps increase their odds of outscoring opponents as they’re spending more time with the puck and away from their own zone.

We do also see a few players who do okay with Nurse, such as Arvidsson and Podkolzin. Their on-ice numbers with Nurse take a hit, but they don’t drop below the break-even mark and remain respectable. This ability to survive the Nurse minutes could explain why both of them are getting more minutes with Draisaitl on the second line. The coaching staff needs to do everything possible to mitigate the risks associated with deploying Nurse and have to find as many internal solutions as possible. At least until management can address one of the biggest and most expensive problems on the team.

Data: Natural Stat Trick

Also posted at Oilersnation.

Slow start, sketchy goaltending and finding defence pairs

Not the best start for the Edmonton Oilers, who currently rank seventh in the Pacific division with a points percentage of 0.400 (2-3-0), and 13th in the western conference. Early days of course, but what’s really stood out to me are the high profile losses.

After all the hype in the off-season about the team, the Oilers get crushed by Winnipeg on home ice in their season opener. Then they lose on the national stage on Hockey Night in Canada to Chicago. And then they lose to Calgary, of all teams, on home ice. The Oilers can rip off a long winning streak to make up for the lost points, but it’ll be hard to forget this start.

Goaltending has again been a factor in the team’s poor start to the season, as it ranks as one of the worst in the league in every game-state. What was especially alarming were some of the comments from Stuart Skinner after the first game where he talked about how fast the game felt and being unprepared. (Source: Edmonton Oilers)

I think that the game was a little too quick for me and I just wasn’t up to speed and that’s on me just in the way that I was playing. Maybe it was too much aggression on my part where I probably should have played, you know, read the game probably a little bit better.

Thought this was a bit of a red flag, and reflects poorly on the coaching staff who had plenty of time in training camp and the pre-season games to get everyone prepared – especially the goaltenders. Makes you wonder what the pace was like for the goaltending and if the coaching staff, from the head coach to the goalie coach, were aligned.

The other interesting comments regarding Skinner came from analyst, and former goalie, Steve Valiquette on the Real Kyper and Bourne show highlighting how poorly Skinner performs with chances on the rush.

We had four data scientists looking at all of our data this year. I really wanted to get to understand hockey better. And over the past decade we’ve identified now three predictors that lead to Stanley Cup success. You have to have strong special teams. You have to have settled offense at five on five. And you’ve got to have a strong odd man rush – and that’s for and against.

The area that Stuart Skinner really struggles with is the east to west game. Whether it’s at five-on-five in-zone or off the rush, his movement side-to-side is – to be fair, and it’s tough to say because you’re talking about the top 64 guys in the league – but he’s the worst of those 64. The nicest way to put it is he lacks confidence and he doesn’t get east to west well.

If that’s the case, there’s no wonder the Oilers coaching staff spent so much time last season reducing those rush chances against. And they’ll have to continue doing so, even with a lot of new players across the roster.

Speaking of which, below are how the skaters have done so far this season at even-strength (5v5). The tables are separated by position and sorted by ice-time. A simple heat map has been applied to show how each player compares with their own group.

First the forwards.

.

The on-ice numbers mostly align with what I’ve noticed. Some of the more experienced, top six guys like Hyman and especially Nugent-Hopkins have been underperforming. I don’t think Nugent-Hopkins can function as a sole-center on a line any more, so I’d keep him with either McDavid or Draisaitl. The issue is that Draisaitl is also someone who needs to be on a line with a second centerman, so he can’t be on his own either. The Oilers will almost always have a line that other teams could exploit at even-strength.

The Oilers are getting decent minutes from some of the new additions like Arvidsson, Podkolzin and Skinner, as well as Henrique. The team is doing better with them on the ice, and the results should start to turn around. It’ll be interesting to see how the coaching staff deploys this group, and if they have the courage to experiment a little more.

And below are the on-ice numbers for the Oilers defencemen.

.

The top pairing of Ekholm and Bouchard is quite solid and helping tilt the ice. And Kulak has been steady with whoever his partner has been. The concern remains with the second pairing as Nurse has continued to struggle, with the team more often playing without the puck when he’s on the ice. As I mentioned prior to the season starting, the rest of the defensive options have been depth players for the majority of their careers, so it’s hard seeing any of them move up the depth chart. None have shown the ability to help boost their defensive partner’s on-ice numbers, which is something Nurse will need for that second pair to be successful.

Data: Natural Stat Trick