Sad to hear the passing of Brian King, the man behind the popular PDO metric in hockey. Brian was a very influential person in the Edmonton Oilers fan community and had a huge impact on my work and others. I’ve referenced his PDO stat thousands of times on my blog and other outlets, and it’s a wonderful metric that’ll be referenced for a long, long time.
Brian helped shape how fans view and analyze the game of hockey, especially when it comes to evaluating individual players and the ‘puck luck’ they may or may not have. The PDO metric will continue to be referenced when an objective take of the game is needed, something Brian regularly provided online. Combining his metric with other stats and insights has made the game so much more enjoyable for me, and I’m sure for others as well. I’ll always be thankful to him for that.
I had the pleasure of interacting with Brian regularly over the years. He even took the time to talk Oilers and how he got into hockey and stats on my podcast back in 2022. He talked about coming up with PDO in the summer of 2008 while talking about the Oilers decision-making with other like-minded fans on the Irreverent Oiler Fans blog (which was maintained by Vic Ferrari/Tim Barnes). The backstory of PDO is also in Bob McKenzie’s 2014 book Hockey Confidential – something I was just thrilled to see when I first read it.
The Edmonton Oilers are heading into the playoffs in not-so-great shape.
Over the final twenty-five games of the season (so since around late February), the Oilers had a record of 14-10-1, a points percentage of 0.580 that ranked 14th in the league. Their even-strength (5v5) goal-share of 43 percent (43 goals for, 57 goals against) ranked 27th in the league, only ahead of New Jersey, San Jose, Chicago, Nashville, and Minnesota.
Injuries were obviously an issue and played a role in the team’s shooting percentage, which ranked 30th during this period, and save percentage, which ranked 27th. But it’s important to note that even before this final stretch the Oilers weren’t too great in either of those categories as they were below league average pretty much all season. And because of this, the Oilers are heading into the playoffs with one of the worst goal differentials at even-strength (-3) among playoff teams.
The good news is that despite the injuries, the Oilers posted decent shot-share numbers with their Corsi For percentage and Expected Goals for percentage ranking higher up in the league. So, there’s reasons to believe that their goal-share could improve. But it’s important to note that their shot-share numbers were largely star driven, as the team could only post a 48 percent Corsi For percentage and a 46 percent Expected Goals for percentage when McDavid and Draisaitl were not on the ice. So it’s hard to have confidence in the depth players being real drivers at evens. Should note here that that I excluded the games when the glimmer twins were not in the lineup.
The other major issue heading into the playoffs is the Oilers goaltending, which has been inconsistent all season and below league average levels. And it’s where the Kings have a significant edge.
Among the 62 goalies who played at least 1000 minutes this season, or at about 20 games (all situations), Darcy Kuemper ranked fourth overall in terms of save percentage (0.921) and goals-saved above average (GSAA, +26.76), only behind Connor Hellebuyck and Andrei Vasilevskiy. Stuart Skinner on the other hand ranked 39th with a 0.897 save percentage and 42nd with a GSAA of -4.44. Among the true regular goalies (ones who played at least 50 games this year) Skinner ranks near the bottom of the list. And for those wondering, Pickard ranks 24th in terms of save percentage (in the list of 62 goalies) and 26th in GSAA.
Should note that both Los Angeles and Edmonton were very good at limiting shots and chances against at even-strength and the penalty kill this season. One team had goaltending and had a shot at the division title. The other one had Stuart Skinner. It’s a major weak spot for the roster, and a position that Oilers management chose not to address last off-season or at the trade deadline.
Defenceman Darnell Nurse has had a lot of highs and lows throughout his season (and career) with the Edmonton Oilers.
Early in the campaign, he posted some of the team’s worst on-ice shot-share numbers and goal-differentials. But by early December we saw his performance and results turn around after the coaching staff played him more often with Leon Draisaitl, who has had an MVP-level season. As the year progressed, Nurse made some great plays and contributed on the score sheet. But that would again be followed up with blunders in his own zone, leading to opponents sustaining pressure and generating scoring chances. His game has recently improved, which is great considering the playoffs are coming up. But it remains to be seen if he can continue playing at this level.
This all led me to a pretty straightforward question: is Darnell Nurse having a good season?
To determine if he meets the threshold of “good”, I produced some basic criteria for a defenceman that is being paid $9 million per year:
Must be playing regular minutes against the other team’s top competition at even-strength (5v5), and top minutes on the penalty kill.
Must have a positive impact on the team’s shot and scoring chance differentials at even-strength (5v5).
Must have a positive impact when playing with the team’s depth players, as in when McDavid and Draisaitl are on the bench.
There could be other criteria, but what I have above are things that correlate to scoring goals and winning games. It’s basically the bare minimum.
Ice-time and Usage
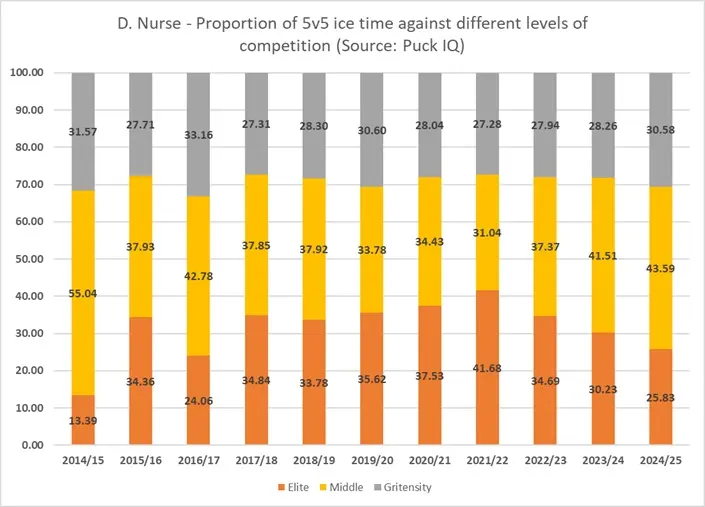
Nurse is currently averaging just under 23 minutes a game this season (in all situations), which ranks third among Oilers defencemen. And he ranks first in the average number of even-strength minutes (19 minutes a game). What’s interesting is that 25 percent of his even-strength minutes this season are against elite competition, according to the methodology used by Puck IQ. This is a drop from last season when Nurse played 30 percent of his minutes against top competition.
The table below shows a steady decline in Nurse’s proportion of ice time against elite-level competition (orange bars) throughout his career, as he was over 40 percent just three seasons ago. The 25 percent proportion he has this season would be one of the lowest in his career, indicating that the coaching staff is well aware of his deficiencies, and are actively trying to put him in a position to succeed.
.
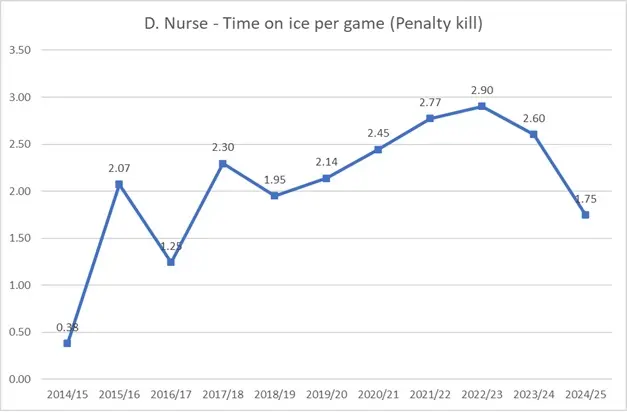
Another thing worth considering is the steady decline in Nurse’s minutes on the penalty kill. Nurse is averaging below two minutes a game this season, which is a significant drop off from the last four seasons when he was regularly on the top penalty-kill unit. The graph below shows his average ice time per season over the course of his career, and is a good indicator of the trust the coaching staff has in the player.
.
Nurse’s Impact at 5v5
Below are Nurse’s relative-to-team shot-differential numbers by season. I tend to use Corsi, a proxy for puck possession, and Fenwick and Expected goals as a proxy for scoring chances.
.
This is going to be the third straight season where the Edmonton Oilers have seen their shot and scoring chances numbers take a hit when Nurse has been on the ice.
Yes, he does play a lot of minutes and sees top competition. But as we saw above, those hard minutes are being reduced. He’s clearly not a player that can be relied on to drive play, and he’ll need to be with a strong defensive partner and high-end forwards as much as possible for him to provide value to the team at even-strength. Which leads to the next criteria.
Impact when playing with depth players
When the Oilers have Nurse on the ice with the depth players, so no McDavid or Draisaitl on the ice, the Oilers have posted some pretty poor performance numbers and results. Their Corsi For percentage and Expected Goals For percentage both drop down to 46 percent when the depth players are playing with Nurse, which, as mentioned above, is why the coaching staff was okay with getting Nurse away from them earlier in the season.
The good news is that the results have been good, with a goal differential of plus-four (goal share of 55 percent), but that’s been largely luck-driven. The team tends to play less often with the puck when Nurse is out there with depth players, so it’s hard to have confidence in these results over the long run.
Final Thoughts
While we sometimes see some great plays from Nurse and his name on the scoresheet, it’s hard to ignore his usage, performance and results over the course of the full season. Expectations are rightfully high for the player, and unfortunately, he’s not meeting some basic criteria that correlates with winning games. The hope is that he can play well into the playoffs, but it’s hard to have confidence when we look at the data over a full season.
Based on his salary and role on the team, you would expect Darnell Nurse to be one of the best defencemen in the league, though you could make the argument that he might not even be the third-best defenceman on the Oilers. That’s a problem for management to address this off-season.
I was recently invited to talk sports analytics on the TSI Today podcast, which was hosted by Sport Central here in Edmonton. Full segment is below.
Topics we covered:
How I got into hockey analytics and sports writing, and some of my methods when reviewing and interpreting data.
Importance of hockey analytics, the role fans have had in growing it and how front offices are leveraging it.
My thoughts on the skillsets required to get into the sports analytics industry and recommendations for those looking to get into it.
Big thank you to Chad Tomaschefski from Tridon Communications for the interview, and Janna Tominuk from Sport Central for hosting. And special thanks to Mark Spector for the invite and the tour of Sport Central.
For more information on how you can help a great cause, check out Sport Central’s website: https://www.sportcentral.org
You can also checkout the interviews with Janna and Mark below:
Devastated to hear the passing of my friend Bruce McCurdy. He was an absolute gem of a person who was incredibly knowledgeable and passionate about hockey and local sports. Had the pleasure of meeting him many times over the years and getting to know him. I’ll miss our hockey and non-hockey chats and exchanges.
To me, Bruce was the unofficial historian of the Edmonton Oilers – someone who could recall intricate details about the team’s history, the players, the games. What made Bruce stand out was his ability to give the context around the team and what was happening at the time of the events. He could recall what the fans were feeling, what was being written about the team, and what else was happening in the league. He always helped paint a picture and helped you feel more connected to the Edmonton Oilers – more than what anyone else could. I think that’s why this feels like such a loss for local fans.
His ability to blend words, numbers and ideas so effectively was a huge influence on me and others, and is going to be deeply missed. He was willing to engage with others and challenge others. He brought forward well-informed ideas and opinions, and was always open to new ideas. He was a great hockey writer, making his loss even more profound. He’ll always be an iconic figure in the Oilers blogosphere.
Bruce was incredibly supportive of me and my work over the years. He was very encouraging, especially early on, and willing to share my work and give me feedback. What I appreciated most about Bruce was when he’d reach out to correct something I had written or something I might have missed. He’s a big reason why I’ve been writing for this long and willing to take risks along the way. I owe a lot of my success to Bruce.
Condolences to his family and those feeling his loss.
The Edmonton Oilers have been very poor since the 4 Nations Face-Off. In 10 games since the break, they have three wins and seven losses, having been outscored 27-40 in all situations.
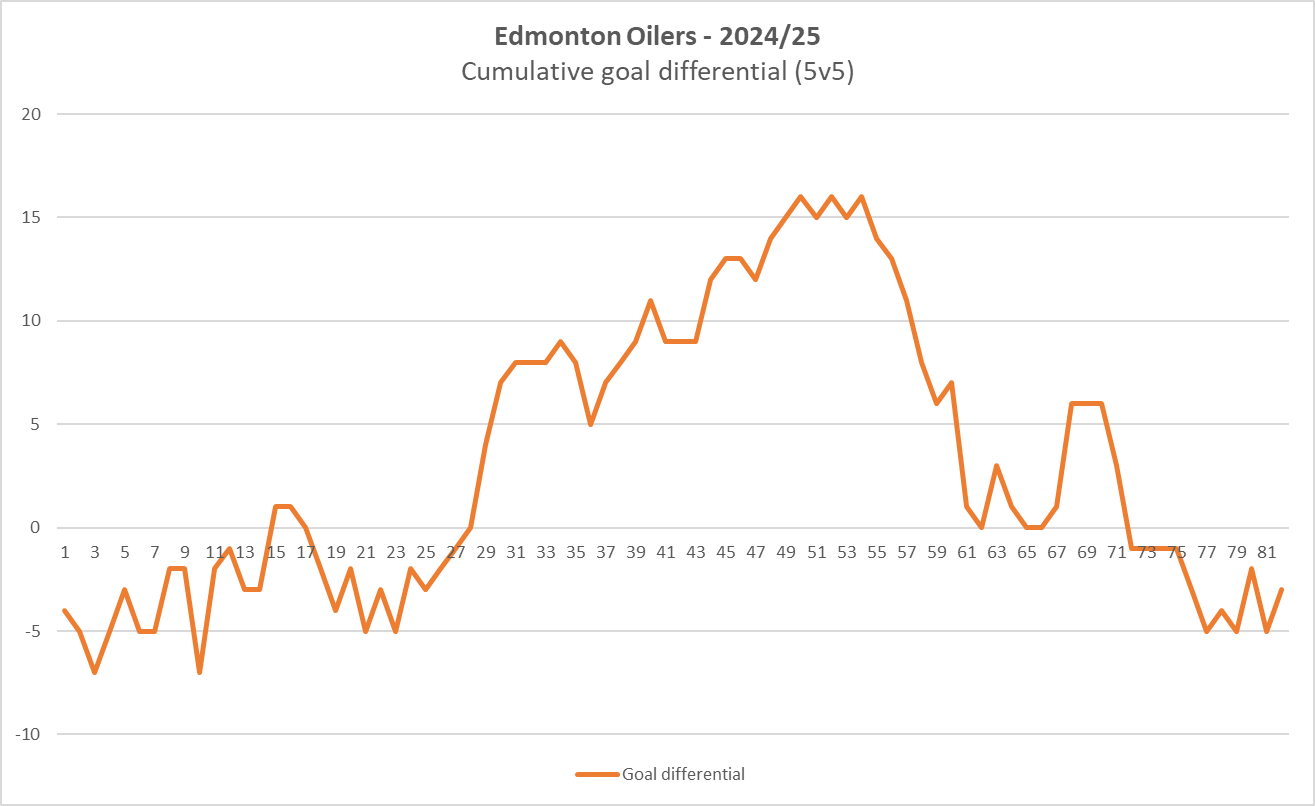
Even-strength (5v5) has especially been awful as the club went from a +14 goal differential heading into the break to now sitting at even. Put another way, it took them 55 games to have a goal-share of 53 percent, which was eighth best in the league. And all of that progress, especially what they did in January, has been wiped out in the last ten games. They now rank 18th in the league with a goal share of 50 percent. Not exactly looking like a playoff threat. A graph showing the Oilers cumulative goal differential this season at even-strength is below.
.
The drop-off in results has been driven by their inability to control the flow and their spending less and less time with the puck. Prior to the break, the Oilers had some of the best shot-share numbers in the league, hovering around the 55 percent mark when it came to Corsi percentage (which is a proxy for puck possession) and Expected Goals (which is a proxy for scoring chances). But since the break, these numbers have fallen to league average levels, with their Expected Goals percentage even dropping below 50 percent.
For context, below is the Oilers underlying shot-share metrics in rolling 10-game segments. I’ve added a marker at the 55 game mark, which is the first game after the Four Nations Faceoff tournament. The other low point came around the game 34 mark, which was in late December when the team was struggling. In January, the team turned things around and started playing closer to what was expected. But things appear to have fallen off again. The recent numbers are well below where they were prior to the break and an indication that the tactics and process the coaching staff has in place for even-strength play isn’t working. The results are suffering because of it, and it has to be addressed as soon as possible.
.
There are two issues to consider when trying to understand why these numbers are falling off.
The first is that the team’s goaltending has been a weak spot for the team for a long time now, and hasn’t at any point this season been at or above league average levels. Because of this weakness in net, the team seems to be playing a little too safe now and not pushing for offence as frequently. Instead of taking chances and really leveraging the offensive talent they have up front, there are a few too many conservative plays happening, especially in this recent stretch of games.
The switch to playing more conservatively at even-strength is reflected in the team’s declining rate of generating shot attempts. Before the tournament break, the Oilers were generating 62.6 shot attempts per hour — one of the highest in the league. In the last ten games, that rate has dropped by 8.8 percent to 57.04 shot attempts per hour — which is slightly below league average. Worth mentioning that the team’s rate of shot attempts against has remained steady all season.
.
And as I wrote about a month ago, the team has also been getting a lot more shots from their defencemen, which isn’t ideal considering the probability of scoring drops off the further you’re away from the net. There appears to be more hesitancy to make plays and take some risks to get the puck moving into high danger scoring areas. Instead, the team is taking shot attempts from distance, and hoping the best for rebounds. This is a weird tactical issue that various coaching staffs have tried in Edmonton, and it just doesn’t work well.
Considering the team’s championship aspirations, and the importance of home-ice, it’s critical that the Oilers coaching staff recognize the issues and make the necessary adjustments. The chase for a division title is slowly slipping away, but there is still time to make some ground.
The Edmonton Oilers are sacrificing offensive opportunities to prevent rush chances against, and it’s costing them wins.
The current lack of creativity and freedom is likely in response to their goaltending being below league average all year. Details:https://t.co/xlTAuw7hte
With the NHL regular season to re-start this weekend and with the trade deadline coming up, I wanted to take a quick look at the Oilers roster to see where the weaknesses are and what should be addressed by the management group. The reality of operating in a cap system is that you have to pick and choose where you want your strengths and weaknesses to be, and managers have to try to mitigate their risks as much as possible.
My approach is to take a look at each individual player’s actual results (their on-ice goal-share) as well as their underlying number such as their on-ice shot differentials and expected goals differentials. Combining this with their on-ice shooting and save percentage, you can start to gauge whose results are sustainable or not. And which players are more likely to have success.
Below are two tables showing the players on-ice numbers at even-strength (5v5) so far this season, with a basic heat map applied to show each player compares with their cohort. Tables are sorted by each player’s total ice time.
.
Thanks to Draisaitl and McDavid, the Oilers continue to have one of the best top-six forward groups in the league. The issue remains with the bottom six group. While they play an important role on the penalty kill, they tend to spend a lot of time without the puck and get out-chanced regularly at even-strength. What really stands out is how poorly McDavid’s on-ice goal differential has been. Despite posting some excellent on-ice shot differentials, he’s sitting at only +5 – and it’s largely driven by his on-ice save percentage. The Oilers team save percentage currently ranks 19th in the league.
On the defensive side, there’s definitely room for improvement, especially with the group’s depth. Not sure how confident I’d be if guys like Emberson, Stecher or Klingberg have to play more minutes as they haven’t done so well in their minutes.
I’d also be concerned about Nurse and ensuring that he has a partner who can make up for his deficiencies. Nurse is a player who needs to on the ice with top end players as his on-ice numbers often take a hit when he’s not with one of the glimmer twins. Interesting to note that when McDavid has been with Nurse on the ice (and away from Draisaitl), his goal differential is -4 at even-strength (4 goals for, 8 goals against). And that’s partially driven by the fact that the Oilers tend to get outshot and outchanced with Nurse on the ice. Even McDavid isn’t immune from Nurse’s impact.
The Edmonton Oilers are in a great spot right now, sitting first in the Pacific with 72 points in 55 games, and two points ahead of Vegas. They rank third in the league with a 0.667 points percentage, only behind Washington and Winnipeg.
A big reason for that is their overall results at even-strength (5v5), where they’ve outscored opponents 120 to 106 and have a goals-for percentage of 53.10 percent that ranks eighth in the league. What’s been especially encouraging is their strong underlying numbers, like their Corsi For percentage and Expected Goals-For Percentage – both of which are around 55 percent and indicate that their results at even strength are real and sustainable.
What’s interesting is that while the team is getting excellent results at five-on-five, the team’s shooting percentage of 8.26 percent is one of the worst in the league. They currently rank 26th and only ahead of Anaheim, Pittsburgh, Detroit, Calgary, Ottawa, and Nashville – none of which are considered cup contenders like Edmonton. Last season the Oilers shooting percentage ranked 15th in the league and the year before it ranked eighth.
Put another way, if the Oilers had a league-average shooting percentage this season (which is around 8.75 percent), they would have scored 125 goals this season instead of 119. That’s another win in the standings and a larger gap between the competition in the Pacific. Natural Stat Trick’s expected goals model also has the Oilers at scoring 132 goals, which again is higher than their actual count. Using that model, the Oilers should have two extra wins in the standings.
Any way you look at it, the Oilers would be higher up in the standings if they could just finish their chances even marginally better. Goal-scoring has been gradually increasing year-over-year league wide, making it even more critical that Edmonton keeps pace to help solidify their ranking and secure home-ice for the playoffs.
There are of course plenty of factors why the Oilers might be underperforming when it comes to goal-scoring. Players can always slump over the course of a year. Maybe teams are just playing the Oilers harder as they went to the final last season and are considered one of the legit Cup contenders. Hard to pinpoint the exact issue.
But one factor that could be driving down the team’s shooting percentage is the high number of shots and the proportion of shots that are coming off the sticks of their defencemen. Ideal scoring chances are from in close and when the goalie is in motion – which is more likely to happen when forwards are getting those opportunities. Shots from the blueline can create rebounds and chaos, but a lot of times a team is just giving up puck possession when they’re shooting from distance.
On average, teams get about 30 percent of their total even-strength shots from their defencemen. This season, the Oilers getting 35 percent of their total shots from their defencemen, which is the third highest proportion in the league. In the previous two seasons, the Oilers were at around 31 percent and closer to league-average levels. Worth noting that the two teams that get a higher proportion of shots from their defencemen are also cup contenders who are struggling with finishing their chances. Carolina currently ranks 19th in the league in terms of shooting percentage while Colorado ranks 22nd.
Back to Edmonton and their rate of shots from defencemen. Among the 252 defencemen who have played at least 100 even-strength minutes this season, Darnell Nurse ranks third highest with 7.20 shots per hour and Evan Bouchard ranks seventh with 6.82 shots per hour. Ekholm isn’t too far behind, ranking 18th with 6.13 shots per hour. No other team has three defencemen in the top twenty.
For additional context, below is a shot-location map from Hockey Viz comparing the Oilers’ chances last season compared to this season. Red indicates a higher volume relative to league average levels. What stands out here is the growth in chances coming from the blueline on the right side. And fewer shots from in close, which the Oilers excelled at last season.
.
Ideally, the shots are coming from the forwards up front, especially from the top-end players. It’s worth noting too that McDavid’s rate of shots are down this season, which is a little baffling considering his talent level and above-average shooting percentage. His current individual rate of 7.51 shots per hour is down 22.1 percent when compared to his rate over the last three seasons (9.17 shots per hour). Unclear if it’s because the defencemen are taking more of the shots or if he’s dealing with something else.
.
As the regular season winds down, there’s going to be a home-ice advantage on the line. And it’ll be critical that the Oilers keep up with the growing scoring pace across the league – especially at even-strength. The team is doing a lot of things right in terms of controlling the flow of play and out-chancing opponents. But unless the coaching staff makes some tactical adjustments and generate more offence from their star players up front, the shooting percentage may not improve to where it should be.
Below are the even-strength (5v5) numbers for each team in the western conference (sorted by points percentage), including goal-share results as well as the shot-share metrics that give us a sense of which teams have the right processes in place and if the results are sustainable or not. At the end of the table are each team’s shooting percentage and save percentage. I’ve also applied a basic heat map to each metric to show which teams are doing well or struggling relative to their conference foes (i.e., green is good, red is bad). You can also find a description of each metric at the end of this article. Please note that the shot-share metrics are score and venue adjusted based on Natural Stat Trick’s methodology.
.
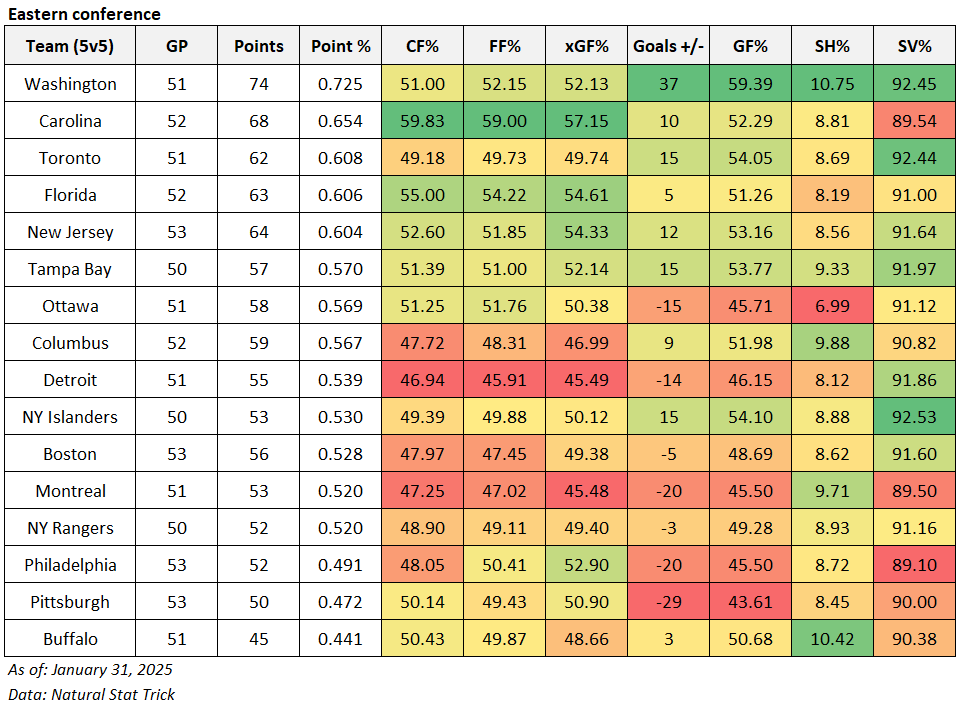
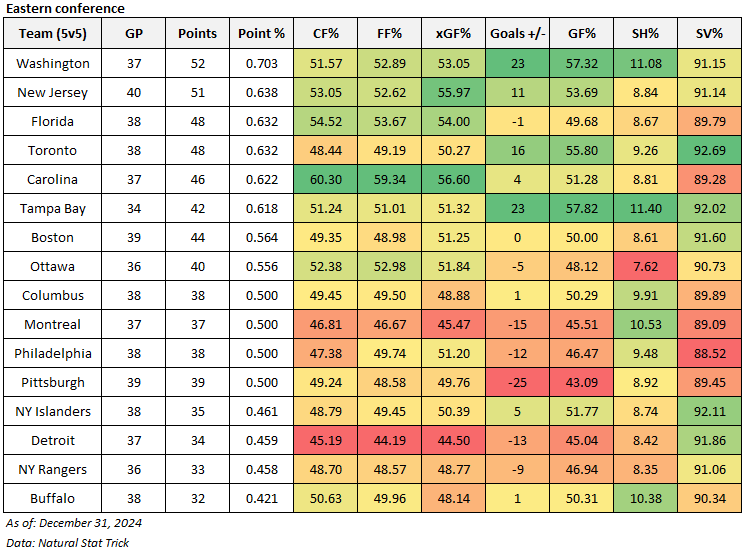
And here’s how things are looking in the eastern conference.
Quick summary of how the Edmonton Oilers compare with the rest of the western conference. And a little bit about the east.
Below are the even-strength (5v5) numbers for each team in the western conference (sorted by points percentage), including goal-share results as well as the shot-share metrics that give us a sense of which teams have the right processes in place and if the results are sustainable or not. At the end of the table are each team’s shooting percentage and save percentage. I’ve also applied a basic heat map to each metric to show which teams are doing well or struggling relative to their conference foes (i.e., green is good, red is bad). You can also find a description of each metric at the end of this article. Please note that the shot-share metrics are score and venue adjusted based on Natural Stat Trick’s methodology.
.
All is well and good for Edmonton in the western conference as they’re sitting at a point percentage of 0.653. The concern is that their goaltending and team shooting percentage is below average, but it should gradually improve. I did notice that the good teams are separating themselves from the poor ones, and I doubt there will be little movement from the bottom-feeders. I’m expecting Vancouver to slide down a little more. And it’s worth monitoring Vegas, Winnipeg and Minnesota to see if they eventually slide. Edmonton should be able to move up further – but again it really depends on their goaltending and depth scoring.
I was also curious about how the contenders in the east are doing, and if there’s anything worth noting.
.
The one team that stands out is Toronto as their shot-share numbers haven’t been great, but they’re getting bailed out by their goaltending. Tampa is another team hanging in there, and could move up. Same with Ottawa, but their having a lot of trouble finishing their chances. Carolina looks really good, and should eventually move up. Their issue, similar to Edmonton and Colorado, is goaltending.