Upswing

The last time I looked at the Oilers penalty kill, it was twenty-five games into the season, and the situation was pretty dire. They  were having all sorts of issues defensively, allowing some of the highest rates of shots and scoring chances against, resulting in the fourth highest rate of goals against in the league. What was especially troubling was that the penalty kill was basically giving back all of the goals that the Oilers powerplay had generated. Despite having the best powerplay in the league, the special teams as a whole gave the team nothing.

  • Related: Dispirit – The SuperFan (2022, December 4)

Since that point, and after I published my article (!), things appear to have turned around for the Oilers penalty kill.

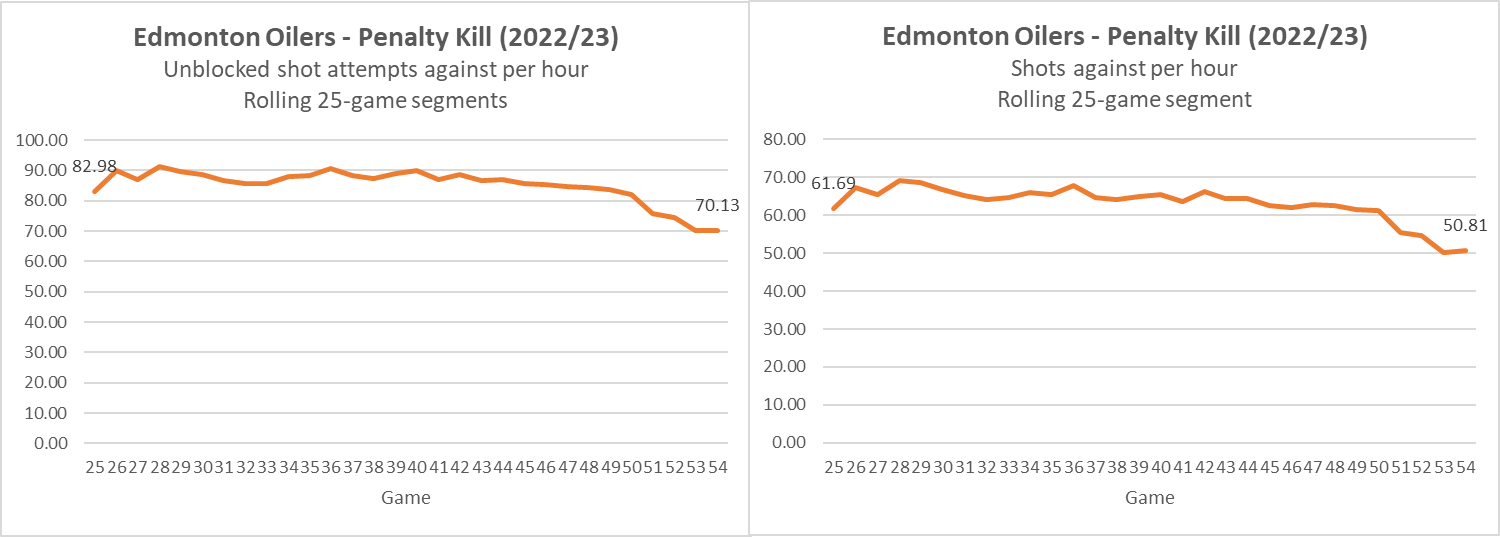
When it comes to the team’s penalty kill performance, the Oilers have gradually improved at limiting unblocked shot attempts (a proxy for scoring chances) and shots on goal. In the first twenty-five games, they were allowing the ninth highest rate of unblocked shot attempts (82.98) and the sixth highest rate of shots against (61.69). In the most recent twenty five game stretch, they’ve seen their rate of unblocked shot attempts drop by 15.5% to 70.13 (tenth lowest in the league) and their rate of shots against drop by 17.6% to 50.81.

This improved performance has translated into better results, as the Oilers have allowed a significantly lower rate of goals against. In the first twenty five games of the season the Oilers allowed 26 cumulative goals (3 GF. 29 GA) – a rate of 12.60 goals against per hour, which was fourth highest in the league. In the most recent stretch of twenty five games, the Oilers have allowed 10 cumulative goals (5 GF, 15 GA) – a rate of 6.30 goals against, which ranks 13th in the league. They’ve basically cut their goals against in half.

The other factor to consider is the team’s goaltending on the penalty kill, which has also improved. After the first 25 games, the Oilers team save percentage ranked 29th in the league with 78.90%. Among 42 goalies who had played at least 45 minutes on the penalty kill, Campbell ranked 39th with a 78.90% save percentage and a -4.73 goals saved above average. Skinner wasn’t faring much better at the time, as he ranked 36th in the same pool of goalies with a 80.30% save percentage and 37th when it came to goals saved above average with -3.21.

Thankfully both netminders have improved over the course of the season, especially Campbell. Over the last twenty five games, the team save percentage has ranked 15th in the league, with 87.60%. Campbell’s save percentage of 89.50% ranks 13th among 42 goalies who have played at least 45 minutes on the penalty kill. Skinner’s numbers, while still modest, are an improvement as well and rank closer to league average levels.

The coaching staff clearly made the penalty kill a priority and made tactical adjustments, which has helped drive their overall results and kept them competitive in a tight playoff race. At the twenty-five game mark this season, the Oilers special teams had a net goal differential of -1. Since then the powerplay has continued to excel, and so to has the penalty kill, which has helped the special teams differential improve to +17. That’s worth about three wins in the standings, or six points. Had the penalty kill performance and results stayed the same as it did earlier in the season, the Oilers would likely be outside of a playoff spot.

It’ll be interesting to see how this could impact the Oilers approach at the upcoming trade deadline. There’s been plenty of speculation about management targeting defencemen, especially those that can help the Oilers in their own zone and potentially on the penalty kill. Names like Joel Edmundson and Vladislav Gavrikov were floated, among others, when the Oilers were struggling. And now that the team has gradually improved, we’re hearing the names of more offensive-style defencemen like Erik Karlsson landing in Edmonton. Could go either way at the trade deadline with this management group.

One other observation. The Oilers penalty kill percentage, the way the NHL tracks penalty kill success, currently ranks 19th in the league. But when you look at the rate of goals against per hour on the penalty kill, which factors in how much time it takes to score against the penalty kill (which is in my opinion the better metric to evaluate a penalty kill’s success), the Oilers rank 26th. I think what that tells us is that while the Oilers are okay at killing penalties, when they do allow a goal, it happens early on in their penalty kill. Which is when the first penalty kill unit is on the ice. Might be worth looking into how the first unit compares with the second unit, and how they compare league-wide.

Data: Natural Stat Trick

Appendix: Ice time and on-ice numbers for the Oiler forwards

The SuperFan Podcast – Episode 50 – Talking Oilers and prospects with Bruce Curlock (@bcurlock)

Joined by Bruce Curlock (@bcurlock) from OilersNation on the show to talk about the Oilers success heading into the All-star break, the key drivers and how the Oilers have performed differently. Bruce shared his thoughts on the youngsters on the team and in Bakersfield, the key prospects in the system and how he’d like the Oilers to approach the NHL trade deadline.

Full segment below:

Related links:

Podcast channels:

Music: Anitek. “Show me.” Anitek Instrumentals Vol. 4, 2010. Jamendo.com

Tracking the Western conference – As of January 31, 2023

Since the Oilers are going to be in a competitive playoff race following the all-star break, I’m switching over from a monthly division review to a western conference review. The Oilers are currently sitting in fourth place in the Pacific with 60 points, trailing Seattle, Vegas and Los Angeles. And they’re holding on to the first wild card spot in the west, three points ahead of Colorado. The Oilers have made significant progress recently, which has helped them get out of the hole they had themselves in earlier in the season.

Below is a summary of the western conference, sorted by each team’s points percentage. Included in the table is each team’s even-strength performance numbers (i.e., shot-share metrics that measure how well a team controls the flow of play and the total chances) as well as each team’s goal-share and goal-differential. I’ve also included each team’s shooting percentage and save percentage to get a sense of what might be driving their overall results. And I’ve applied a simple heat map to each metric to show how each club compares to the rest of the conference.

The Oilers currently have the third best points percentage in their division and sixth highest in the conference. Based on how well they’ve been performing since mid/late November, they should be able to maintain their position and compete for a top-three finish in their division. They’ve had a fairly healthy roster, and their goaltending has been steady – both are going to be factors over the last thirty-two games of the season.

From an Edmonton perspective, there’s a few teams to keep an eye on.

Calgary, whose points percentage ranks ninth in the west and fifth in the Pacific, continues to perform well at even-strength, controlling the flow of play, out-shooting and out-chancing opponents. But because of some pretty shoddy goaltending, which ranks 27th in the league, and a forward group that has struggled to score, they’re tied in points with Colorado for the second wild card spot in the west.  The other issue, as we’ll see below, is their powerplay which ranks 25th in the league in terms of goals per hour.

Los Angeles is the other interesting club. They’re performing well at even-strength, but appear to have the same issues they’ve had in the past, which is converting their chances into actual goals. Their goaltending has been poor as well, which has to be frustrating considering the Kings (similar to Calgary) are one of the best teams in the league at suppressing shots and scoring chances.

The rest of the western conference isn’t very impressive. Dallas is the one club that looks legit. Colorado is getting healthy again up front, so their shooting percentage and overall results should gradually improve. Vegas is dealing with injury issues now and are having trouble outscoring opponents. Winnipeg is going to be relying on it’s goaltending to have any success. Seattle is doing well, but they can be brought down by the own goaltending and special teams. Even Minnesota who was having success earlier in the year has come back down to earth, and is having trouble scoring goals. Will be interesting to see if any of these clubs can separate themselves from the rest of the group, similar to what some of the top end teams in the east have already done.

With the western conference feeling so wide open, and the success the Oilers have had in their last month or so, I think the club should have some confidence in their ability to move up in the standings and have some success in the playoffs. The trade deadline and the gossip around the Oilers will give us an indication of what management’s confidence level is like.

For additional context, I’ve also put together a quick summary of each team’s powerplay and penalty kill numbers. Sorted by each team’s points percentage again, I’ve included the rate of unblocked shot attempts (i.e., Fenwick for, FF/60) on the powerplay as well as the actual rate of goals per hour (GF/60). And the rate of unblocked shot attempts and goals against on the penalty kill. Again, I’ve applied a simple heat map to each metric to see how each club compares in the conference.

Lastly, below is how each team has performed at 5v5 over their last twenty five games heading into the all-star break. We know Edmonton has done well in terms of shot-share numbers, but so has Dallas, Colorado, Calgary and San Jose. Vegas looks like they’re slipping, and while teams like St. Louis are fading out of the playoff race quickly.

Data: Natural Stat Trick

Oilers player deployment and on-ice numbers over the course of the season

Couple other items I’ve been tracking is how players are being deployed over the course of the season and what their on-ice performance numbers have been like at even-strength (5v5). Reason being, the Oilers had a fairly poor start to the season, so it’ll be good to know which players have been part of the turnaround and which ones have been less influential.

Quick summary below, separating out forwards from defencemen, comparing games 1-25 with games 26-50. Tables are sorted by average time on ice (TOI/GP) and include each players on-ice Corsi For percentage (CF%) – i.e., the team’s share of shot attempts, for and against, which serves as a proxy for a team’s puck possession capabilities. I’ve also included the changes in average ice time per game and Corsi For percentage, and applied a simple heat map to show how players are doing relative to their teammates.

As I wrote about in my last post, the Oilers on-ice performance numbers have significantly improved over the course of the season with most players seeing a bump in their on-ice Corsi For percentages. Couple players stand out when doing this exercise including Mattias Janmark who continues to post poor on-ice shot-share numbers even when the team as a whole is improving. And Klim Kostin who is the only player whose on-ice numbers declined in the last twenty five games. I’m not sure these two are quite ready for tougher minutes, and are likely better suited as depth, replacement-level options.

On the flip side, Puljujarvi has seen his ice-time gradually diminish. But as he plays more and more against lesser competition, his on-ice numbers have seen a nice bump. Not sure if they’re letting him play more of his game and less concerned with how many hits he throws when in the top six. But it’s clear he should be playing higher up in the rotation. Holloway is the other bright spot among the forwards – he should be playing more regularly with the high end forwards. The team needs to know what they have in this player as soon as possible to start planning out their roster decisions for next season and beyond.

On the back end, we know Broberg has been gradually improving, and he has some nice on-ice numbers over the last twenty five games. It’s important to note though that his minutes have been against lesser competition, with a lot of on-the-fly shifts when the play is going towards the opponents end, so we’ll have to temper our expectations. Similar to Holloway, the Oilers need to determine what Broberg’s ceiling is as soon as possible to start making big-picture roster decisions. If the coaching staff and management is confident he can be a top four defencemen starting this year, great. But if there’s some hesitation, they have to cut ties before other teams figure it out. Being a high draft pick will be appealing, and if you can upgrade him to a defencemen who can help the team win in the next couple years you have to consider it. For now, he’s a great story and showing improvements in his game. Let’s see if the coaching staff thinks he’s ready for tougher assignments.

Speaking of assignments, below is a quick snapshot of how the Oilers coaching staff has been deploying their defencemen, comparing the first twenty give games of the season, to the most recent twenty five games (Source: Puck IQ).

Games 1-25 (up until December 4, 2022)

Games 26-50 (after December 4, 2022)

Nurse and Ceci were regularly getting the bulk of the tougher minutes earlier this season, but the coaching staff has scaled them back slightly which has benefited them and the team. Kulak, who struggled early on in the season, appears to be back in form and has seen a slightly higher share of the tougher defensive assignments. The rest of the roster, including Broberg and Desharnais, continue to play against lesser competition, which is understandable considering their lack of experience and the urgency to win games.

Data: Natural Stat Trick, Puck IQ

CBC Radio Active: Oilers emergency back up gets in the game

I joined Jessica Ng and Min Dhariwal on CBC Radio Active to talk Oilers and the different storylines around the club. Full segment is here: CBC Radio Active (2023, January 30).

Topics we covered:

  • The Oilers playing Matt Berlin, their emergency back up goalie, against Chicago on Hockey Night in Canada and the general excitement around EBUG’s.
  • What makes EBUG’s so unique and compelling, and some of the recent examples of them getting into NHL games.
  • The team’s recent success, and the key drivers. Touched on some of the key items from my recent article.

Thanks as always to the team at CBC for putting it all together.

Night and day

The Oilers are posting some excellent results as of late, coming at a critical time where they’re trying to recover from their poor results early on in the season and now holding on to a playoff spot. After 50 games, the Oilers rank fourth in the Pacific division with 60 points (third with a 0.600 points percentage), and holding on to the first wild card spot in the western conference.

It’s really been at even-strength (5v5) where they’ve turned things around, as they’ve gone from a 47% goals for percentage at the Christmas break (a -8 goal differential, after 35 games) to the 52% goal share they have now (a +8 goal differential, after 50 games). Digging through the underlying performance numbers (i.e. shot-share numbers) which help drive results, it’s become evident that the Oilers have gradually been improving for a while now, well before their loss to the Los Angeles on January 9th (game 42) at home, after which the Oilers won seven of their next eight.

To get a sense of their performance numbers this season, below is the team’s Corsi For percentage over 25-game rolling segments. Early on in the season, the Oilers were having issues controlling the flow of play, spending more time without the puck and posting a Corsi For percentage of 49.2% at the Christmas break (first 35 games of the season), which ranked 19th in the league. And it was part of the reason why at that point they only posted a 47% goal-share (a -8 goal differential) and were struggling to hold on to a wild card spot in the west.

The club’s performance gradually improved with the team posting a 54.68% Corsi For percentage in their last 25 games, which ranks 4th highest in the league and closer to what the Oilers posted under Woodcroft last season. There’s likely been some tactical changes, but it’s also been driven by some key players performing much, much better – especially on the defensive side of things.

It’s hard to pin down exactly when the Oilers decided to change their overall approach. But if I had to guess, it was after their 5-2 loss in New Jersey on November 21st, the 19th game of the season. The Devils dominated the Oilers, controlling 60% of the shot attempts and scoring chances, outscoring the Oilers 4-1 at even-strength – a pretty embarrassing beat down. Perhaps it was seeing first-hand how one of the top teams in the league finds success. Or maybe the fact that after the game, the Oilers were 18th in the league in terms of points percentage that gave them a wake-up call. At that point, they had allowed the sixth highest rate of shots against at even-strength in the league, the third highest rate of scoring chances and the seventh highest rate of goals against. After that game and up until the Christmas break (between games 20 and 35), the Oilers posted a 53% Corsi For percentage, but only a +2 goal differential at even-strength.

Now for simplicity and to see how the Oilers improved over the course of the season, I’ve split the season into two segments – games 1-25 and games 26-50. In the table below, I’ve listed out their various performance metrics (i.e., shot-attempts, expected goals) to get a sense of how well the Oilers controlled the flow of play and scoring chances. I’ve also included the actual results – record, points percentage and goal-share.

Oilers (5v5) First 25 Second 25 Percent Change
Record 14-11-0 14-7-4  
Point % 0.560 0.640 14.3%
CF/60 54.43 61.36 12.7%
CA/60 58.24 50.85 -12.7%
CF% 48.31 54.68 13.2%
SF/60 29.03 34.33 18.3%
SA/60 32.42 27.78 -14.3%
SF% 47.24 55.27 17.0%
xGF/60 2.65 3.11 17.4%
xGA/60 2.85 2.38 -16.5%
xGF% 48.24 56.59 17.3%
GF/60 2.35 3.12 32.8%
GA/60 2.81 2.28 -18.9%
GF% 45.54 57.80 26.9%
SH% 8.05 9.23  
SV% 91.30 91.87  
PDO 0.994 1.011  

The Oilers have made a significant recovery from earlier in the season, at one point posting a 43% goal-share in late November, and have moved up in the standings. The big reason for their success is the improved defensive play as the team has allowed 12.7% fewer shot attempts per hour and 16.5% fewer expected goals per hour compared to the first twenty five games. The rate of shots against in the last 25 games (27.78 per hour) is the eighth lowest in the league – a major improvement from when they were allowing the sixth highest rate in the league after the first 25 games of the season. The team’s performance over the last twenty-five games does indicate that the actual results are sustainable, as long as the roster can maintain league average shooting and save percentages. Barring any injuries to key players, it’s safe to assume that the player-driven metrics will be around the same range they’ve been at for the rest of the season.

Couple other things to note.

The Oilers are currently performing really well without their two star players, who the coaching staff is playing together a lot more now compared to the first half of the season (and significantly more than last season after Woodcroft took over). In the first 25 games, the duo played 142 minutes together, or approximately 12% of the team’s total even-strength time. In the last 25 games, that’s moved up to 18% (199 minutes) of the team’s total even-strength time. Without the duo, the Oilers have performed well over the year, controlling 52.09% of the shot attempts, and out-scoring opponents 42-36 (a 53.85% goal share). Suspect a big reason why the coaching staff has played their two stars together more often is because of Draisaitl’s struggles at even-strength this season, especially on the defensive side of things. His on-ice shot-share numbers were one of the worst on the team early on in the year, but that’s significantly improved in the last 25 games. Instead of allowing over 35 shots against per hour with Draisaitl on the ice, the Oilers are now allowing just under 30, and much closer to league average levels. It’s unfortunate that Draisaitl can’t be deployed regularly on another line to help spread the offence, but the Oilers are doing fine without the two stars, probably giving the coaching staff some comfort.

I’d be curious to know from the coaching staff about the tactical and deployment changes and what they think the key drivers have been. As mentioned above, the team did start to turn things around much earlier than the Christmas break as they were posting solid shot share numbers between late November and late December, so I’m not convinced that the Christmas break is when changes were implemented. And as great as the success has been, you have to question why it took so long for the team to figure things out. Better late than never, but the Oilers have had to go on quite the run just to hang on to a wildcard spot in the west – something that could have been avoided had the team, and some key players, not played so poorly defensively. Fortunately with the Pacific division being as weak as it is, the Oilers are in a better spot now compared to a month ago.

Data: Natural Stat Trick

The SuperFan Podcast – Episode 49 – Talking about the Oilers recent success with Zach Laing from OilersNation

Joined by Zach Laing (@zjlaing), news director for OilersNation and the Nation Network, to talk about the Edmonton Oilers recent success, the key drivers and the players who have made positive contributions. We talked about the Oilers youngsters who have made some progress, how the defence core could shake out, and the issues to watch for heading into the NHL trade deadline.

Full segment below:

Podcast channels:

Music: Anitek. “Show me.” Anitek Instrumentals Vol. 4, 2010. Jamendo.com

Protecting leads with more offence

Quick follow-up to something I’ve been tracking this season, which has been around how aggresively the Edmonton Oilers play when protecting a lead. In my opinion, if you have the offensive talent the Oilers do, but a roster built by management that has defensive deficiencies, it’d be more efficient and conducive to winning if you protect your leads by possessing the puck more often and forcing your opponent to play defence.

Using Corsi For percentage as a proxy for puck possession, we can see in the graph below how when the game is tied, team’s on average (between 2019/20 and 2021/22) control about 50% of the total shot attempts for and against. When trailing in a game and looking for the next goal, we see that the league average Corsi For% jumps to 54%. And when teams are leading in a game, they tend to take their foot off the gas, less likely to take risks that could cause scoring chances against – and we see the league average Corsi For% drop to around 46%. In the graph below, these league-average levels are indicated by the orange line. And for context, I also added the league-high (blue line) and league-low (grey line) Corsi For% for each game-state to show the range.

Last year, I found that when Todd McLellan, Ken Hitchock or Dave Tippett were coaching, the Oilers followed the usual league-wide trends. They would push for offence at a league average rate only when trailing in a game, and saw a significant drop in their puck possession numbers when leading in a game. Hitchcock especially had the Oilers pretty much playing in a defensive shell posting some of the lowest possession numbers in the league when the score was tied or when the Oilers were leading in a game.

That all seemed to change when Jay Woodcroft was hired as head coach at the end of the 2021/22 season. The team posted much stronger shot-share numbers overall, but what stood out to me was the team’s Corsi For percentage of 51.72% when protecting a lead. That was the third highest percentage in the league, and well above the league average share of 46.12%. They were clearly using their offensive talent to control the flow of play and more aggressively protect their leads.

Considering the excellent results over the final 38 games last season, I assumed that going forward the Oilers would continue to play an aggressive style to protect a lead. But that wasn’t the case as after the first 16 games of the 2022/23 season, the Oilers were only posting a league average Corsi For percentage playing with the lead – 45.60%, ranking 18th in the league.

Looking at the numbers since that point in time (November 14, 2022), it appears the coaching staff has made adjustments (or perhaps the players have been more on-board), as the Oilers have posted a 49.40% Corsi For percentage protecting the lead, which is sixth highest in the league and only behind Carolina, Calgary, Boston, New Jersey and Dallas.

Their aggressive play also stood out in their recent win at home against Seattle – who have posted decent puck possession numbers at even-strength this season and have had a lot of success, especially on the road. The Oilers held the lead for most of the game, but didn’t seem to let up at all at even-strength (5v5), maintaining the puck well and continuing to push for offence.

Playing more aggressively when protecting a lead really goes against the norm, and is definitely driven by coaching tactics and philosophy. So I’d be curious to know what the issues were earlier on in the season from Woodcroft’s perspective and why the team is now playing more like they were at the end of last season.

Data: Natural Stat Trick

The SuperFan Podcast – Episode 48 – Checking in on the Edmonton Oilers with Dennis King (@dkingbh)

Joined by Dennis King (@dkingbh) on the show to discuss the Edmonton Oilers, Woodcroft’s performance managing the roster, the various drivers for their results and individual players who are standing out.

Full segment below:

Podcast channels:

Music: Anitek. “Show me.” Anitek Instrumentals Vol. 4, 2010. Jamendo.com

Vanity project

The Edmonton Oilers are a team in the National Hockey League. They currently rank fifth in the Pacific division and 20th in the league.

Despite having the best player in the world on their team for eight seasons now, and currently on a value contract for three more, the Edmonton Oilers will spend the second half of the 2022/23 regular season fighting for a playoff spot. A lot will need to go right for them to qualify for the post-season and for the Oilers to compete for a championship.

Of course there will be plenty of solutions the Oilers can pursue to improve their on-ice performance and improve their chances of winning games. You can make changes to the roster depending on what you think the team needs, whether it be on defence or up front on the wings. You can call for different tactics at even-strength and the penalty kill, where the Oilers performance and results have been poor this season. Maybe you go as far as replacing the manager who constructed this roster and has lost so much value for the team across numerous transactions. Or maybe you even replace the individual who hired this manager and had hired the previous manager who failed so spectacularly trying to build a competitive roster.

Identifying the problems, which are numerous, and looking through the team’s performance numbers and all of the decisions made that have led to this situation, I’m constantly reminded that the Edmonton Oilers do not operate as a proper business. This hockey club, to put it simply, is a vanity project for the owner. So a lot of the decisions made throughout the organization aren’t always geared towards winning.

The people, the internal processes and (hopefully) technology the Oilers have in place today – it’s not working. The decision-making processes they use when setting up their operations, hiring the right staff, finding the right players and constructing their roster – all in the hopes of winning hockey games – it’s not helping them progress towards being a contender. There’s clearly a flaw in how the owner is running things, and it’s hard to have faith considering the direction this hockey club is going. It’s embarrassing considering the progress other NHL clubs have made over the years, and how teams, including those outside of hockey, are finding success.

It’s a stark reality that the billionaires who own professional sports teams, including the Oilers, do so for fun and to build their reputations among their friends and the public. For some like Daryl Katz, just owning the team and getting to be associated with the legacy of former players and the dynasty years is good enough. But having a plan from the very top of the organization, building out the proper business operations, implementing sound decision-making processes to achieve big things – that all takes courage. That drive, that willingness, that creativity – it’s lacking at the ownership level. So it should be no surprise that it’s lacking across the executive, management and coaching levels as well.

We know the situation the Oilers are in and the expectations when you have the best player in the world on your team. And there’s plenty of changes that should be made throughout the organization to get things on track. But before making any decisions on the roster, the coaching staff or the front office, the owner needs to decide if owning the Oilers is a business or if it’s going to be operated as the vanity project that it is today.