I joined Jessica Ng on CBC Radio Active to talk about the Edmonton Oilers, their poor start, some of the key underlying issues and the path forward. Full segment is here: CBC Radio Active (2023, November 6)
Topics we covered:
The Oilers current situation, how far they’ve fallen in the division and the uphill climb from here to even compete for a playoff spot.
The goaltending, and how poorly they’ve performed this season.
Jay Woodcroft’s chances of being let go, and if that would accomplish anything.
Rushing Connor McDavid back from injury to play in the Heritage Classic. Suspect he was also hurt in training camp based on his numbers and shooting percentage.
What roster changes are even possible to get the Oilers back on track.
The role Ken Holland has had in these results and his poor management abilities.
Thanks again to the team at CBC Edmonton for putting it all together!
The Oilers are currently taking the tenth highest rate of penalties.
Among 58 goalies who have played 150 minutes (about 3-4 games), Campbell ranks 50th with a save percentage of 87.3%. Skinner ranks 55th with an 86.1% save percentage.
McDavid’s shooting percentage this season has been 8.70%, all situations. His career shooting percentage is 15.5%. He’s not 100% healthy, and I think he was hurt before the game against Winnipeg.
The Oilers penalty kill is allowing a league-average rate of shots against, but has one of the worst team save percentages – so they’re allowing the sixth highest rate of goals against.
Depth scoring at even-strength is bad, scoring only once without one of the top-six forwards on the ice; their shooting percentage is around 1%. In the first ten games last season, the Oilers depth scored four goals; shooting percentage around 7%.
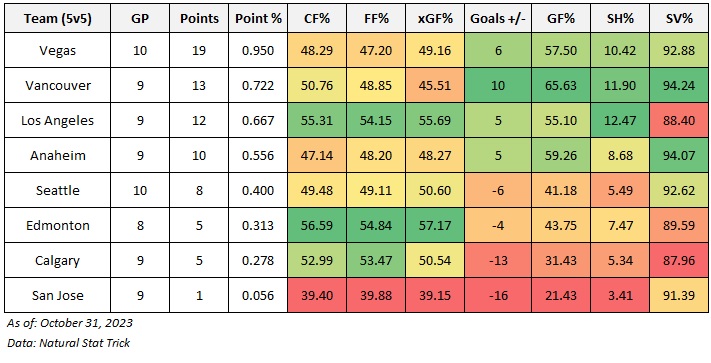
It was a rough start to the 2023/24 regular season for the Edmonton Oilers, who currently rank sixth in the Pacific division with a 0.313 points percentage and 30th in the league – only ahead of Calgary and San Jose. And with Seattle sitting 27th, four of the bottom six teams in the league are currently from the Pacific. On the other end of the standings, Vegas, Vancouver, and Los Angeles have had good starts to their seasons, banking points early and often.
There are still plenty of games to play, so it’s worth assessing how teams have done in terms of results measured by goal-differential and goal-share. And also evaluating how the team has played using shot-share metrics like corsi for percentage, which is used as a proxy for puck possession, and expected goals for percentage that factor in shot quality and tells us how well the team has done at out-chancing opponents.
Below are the even-strength (5v5) numbers for each team in the Pacific division (sorted by points percentage), including goal-share results as well as the shot-share metrics that give us a sense of which teams have the right processes in place and if the results are sustainable or not. At the end of the table are each team’s shooting percentage and save percentage. I’ve also applied a basic heat map to each metric to show which teams are doing well or struggling relative to their division foes (i.e., green is good, red is bad). You can also find a description of each metric at the end of this article. Please note that the shot-share metrics are score and venue adjusted based on Natural Stat Trick’sTrick’s methodology.
From an Edmonton perspective, it’s frustrating to see the team struggle to convert on their offensive chances, not get decent goaltending and post a paltry -4 goal differential at even-strength. But it is encouraging to see that they have done a good job controlling the flow of play and out-shoot and out-chance opponents over the course of these eight games. Their corsi for percentage and expected goals for percentage are near the top of the league and in the same group as some of the cup contenders this season, including Colorado, Dallas, New Jersey, and Carolina. I’ll note again that these shot-share numbers are score-adjusted, which takes into account the fact that the Oilers have trailed in a lot of games this season. It’s worth noting, too, that the team is doing well when it comes to shot-share numbers with and without their best players. Without McDavid or Draisaitl on the ice this season, the team has posted a corsi for percentage of 54 percent and an expected goals for rate of 52 percent. If the bottom six forward group can get an ounce of finishing talent, either from their existing roster or from Bakersfield, this team could make some considerable progress, which leads me to my next point.
The Oilers’ even-strength shooting percentage of 7.47 percent currently ranks 19th in the league, while their team save percentage of 89.59 percent ranks 29th. Had the team’s shooting percentage been just league average, which has been 8.47 percent over the last three seasons league-wide, the Oilers would have scored 16 goals this season instead of 14. And had their team save percentage been league average, which has been 91.6 percent over the last three seasons, the Oilers would have allowed 14 goals instead of 18. An extra six goals would have given them at least another win in October and a couple of places higher in the Pacific with a +2 goal differential.
Based on my recent review of the Oilers’ individual players and their on-ice shooting percentage and save percentage, I would expect a few players to start scoring pretty soon here. For example, the Oilers have posted good shot-differentials with Brown on the ice, but he has zero even-strength (5v5) points to show. So, I expect him to start producing soon. It’s the same with Holloway, who has posted some decent shot differentials further down the line-up but has yet to be on the ice for a goal. I’m also expecting McLeod to have better on-ice results, as he has a good history now of being a dependable bottom-six player. It’s likely the injury he dealt with in training camp that’s slowing him down, so hopefully, he can get into form soon and help improve the team’s overall shooting percentage. It might also help to have a shooter like Raphael Lavoie on a line with McLeod where they can play against lesser competition and get Lavoie acclimated to the national league.
As for the rest of the Pacific, I’m expecting Vancouver to gradually drop down to the middle of the pack as the club is doing well but posting an Expected Goals for percentage of 45.51 percent – one of the lowest in the league. While their goaltending is pretty solid, I don’t think they’ll be able to sustain a shooting percentage of almost 12 percent. Vegas is another team I’m skeptical about. They obviously have the talent to make up for their poor underlying numbers, but they’re still likely to regress. Their shot-share numbers weren’t anything special last season either, so their progress will be something worth monitoring. Los Angeles is the other interesting team as, once again, they’re doing everything right to improve their odds of out-scoring teams at even strength. But they still need to solve their goaltending issue.
It’s going to be an interesting race for the top spots in the Pacific. And the Oilers have their work cut out for them. We’ll do another check-in at the end of November.
Points-percentage (Point%) – The total points accumulated divided by the points that were available, including extra time.
Corsi for percentage (CF%) – The proportion of all the shot attempts the team generated and allowed that the team generated (i.e., corsi for/(corsi for + corsi against). This is used as a proxy for possession and is the best at predicting a team’steam’s future share of goals (GF%). (Source: Hockey Great Tapes – Draglikepull)
Fenwick for percentage (FF%) – The proportion of all the unblocked shot attempts the team generated and allowed that the team generated (i.e., Fenwick for/(Fenwick for + aenwick against). This is used as a proxy for shot quality and considers shot blocking a repeatable skill.
Expected goals for percentage (xGF%) – This is a weighting placed on every unblocked shot based on the probability of the shot becoming a goal. This depends on the type of shot, location and uses historical shot and goals data to come up with the probability for each unblocked shot.
Goals for percentage (GF%) – The proportion of all the goals that the team scored and allowed that the team generated (i.e., Goals for/(Goals for + goals against).
Shooting percentage (SH%) – The percentage of the team’steam’s shots on goal that became goals (i.e., total goals divided by the total shots on goal).
Save percentage (SV%) – The percentage of the team’steam’s shots on goal against that were saved (i.e., 1-(totals goals allowed divided by the total shots on goal against)).
Over at Oilersnation, I wrote a piece on the Edmonton Oilers disturbingly low PDO rate at even-strength (5v5), and if they ever reached these levels last season. I also looked at each individual players PDO, and which players we can expect better production from going forward. There’s definitely reasons for optimism, but things will need to turn around pretty soon here if the team wants to be a top-end club.
Between November 8 and November 23 last season (games 14-20), the Oilers went 3-4 over seven games and were outscored 7-18. Their PDO was at 0.949 – their lowest point of the season. They came close to that again a few more times over the season, but for the most part were well above that and finished the 2022/23 regular season at 100.6. A team’s shooting percentage and save percentage is going to fluctuate throughout the season – that’s the random nature of hockey. And I doubt the Oilers current rate of scoring and saving goals is going to continue, especially when they have some decent talent on their roster.
The other positive for the Oilers is that they’re underlying shot-share numbers at even-strength, which predicts future results (i.e., goal-share), have been very solid this season. Their Corsi For percentage (a proxy for puck possession) is at 56 percent and their share of Expected Goals (which measures shot quality) sits at 54 percent. Their current goal-share of 35 percent (10 goals for, 18 goals against) should not last long if they can continue out-chancing opponents. But it’s anyone’s guess as to when that will happen.
In my latest post for Oilersnation, I looked into Evander Kane’s declining on-ice numbers at even-strength (5v5), and why his poor start to this season shouldn’t be surprising. Playing further down the line-up could benefit him and the Edmonton Oilers.
I found that Evander Kane was especially at risk as his on-ice shot-share numbers, which can be used to predict future results (i.e., goal-share), had gradually declined over the past few seasons. Starting in his last two seasons with the San Jose Sharks, his numbers indicated that his team was often performing worse with him than without him at even strength – a major red flag for someone who consistently played top six minutes with the top players on his team. His worst numbers came last season in Edmonton. Despite playing often with McDavid and Draisaitl, Kane posted some of the lowest shot-share numbers on the team, with the Oilers doing much better at controlling the flow of play and out-chancing opponents without him on the ice than with him. Injuries were obviously a factor last season, but it appears that his decline in even-strength performance started much earlier than that. And that shouldn’t be surprising based on what we know about player aging curves.
I joined Nancy Carlson on CBC Radio Active to talk Oilers, the poor early-season results and what’s needed to turn things around. Full segment is here: CBC Radio Active (2023, October 17)
Topics we covered:
The expectations heading into the season, and why the poor start has become a hot topic.
The Oilers goaltending, and what we can expect from Skinner and Campbell.
The key underlying issues at even-strength, but why there’s also reasons for optimism.
Expectations for the next few games with stops in Nashville and Philadelphia, before hosting Winnipeg on Saturday night.
Thanks as always to the team at CBC for putting it all together.
In my latest post for Oilersnation, I looked into who the individual drivers were on the Oilers penalty kill from last year, and what the potential deployment could be like this upcoming season.
The next issue worth exploring before the start of the regular season is the player deployment from last season – and which skaters helped improve the odds of the penalty kill being successful. To do this, I looked at the on-ice numbers for each Oilers player who played at least 10 minutes on the penalty kill last season. Specifically, I wanted to know how well the team did at suppressing shots (shots against per hour, SA/60) and chances (unblocked shot attempts against per hour, FA/60) with different players on the ice. These are numbers that skaters can help influence, as they are trying to block shots, cut off passing lanes, and force the puck into low-probability scoring areas. For context, I also included in the tables each skater’s on-ice rate of goals against (i.e., actual results, GA/60), which skaters tend to have less of an influence on as goaltending plays a larger factor.
In my latest post for Oilersnation, I looked into the Oilers penalty kill from last season, and some of the gradual progress it had made over the course of the year.
Heading into an important year, it’s critical that the Oilers penalty kill doesn’t cost them any wins like it did in the first twenty-five games of last season. The second-half results were driven by better tactics and defensive play by the skaters, and the team should be able to replicate those numbers. The only question mark should be around goaltending, which we can’t always predict. But if Skinner and Campbell can perform even at league-average levels, the Oilers penalty kill should be in a better spot.
In my latest post for Oilersnation, I looked into how many goals we can reasonably expect from Leon Draisaitl this upcoming season. I factored in his games played, rate of shots and shooting percentage in different games states. I also looked into what might be holding him back from reaching the 60-goal mark.
So taking a conservative approach and using his average rate of shots and his individual shooting percentage from the last four seasons at even-strength and on special teams, I think we can expect Draisaitl to score at least 51 total goals in the 2023/24 regular season (25 on even-strength, 25 on the powerplay and one shorthanded). This of course is assuming Draisaitl remains healthy, he continues to play with good players at even-strength. And the Oilers powerplay continues to have the same talent and tactical approach as it’s had the last few seasons with Glen Gulutzan running things.
Now to get anywhere near 60 goals and join that elite club, a few things will need to go right.
Draisaitl would need to match his career-best shooting percentages at even-strength (20.53% in 2018/19) and the powerplay (30.48% in 2022/23). Doing that and even generating the same rate of shots per game from the last four seasons (1.87 shots per game at even-strength and 1.21 shots per game on the powerplay) and he could potentially reach 61 goals – 31 at even-strength, 29 on the powerplay and 1 shorthanded.
My first post for Oilersnation is up! I looked at the first 20 games of last regular season and what some of the drivers were for the Oilers poor results.
After the first 20 games of last season (up until November 24th), the Oilers had ten wins and ten losses – a points percentage of 0.500 that ranked 22nd in the league. This was only better than Arizona, Vancouver, San Jose and Anaheim in the Western Conference. The team performed poorly at even-strength (5v5), which needed to be much better as the special teams was pretty much a non-factor due to the terrible penalty kill. The powerplay was a bright spot, generating the third-highest rate of goals in the league during this period. But all of their net goals (+19) were completely negated by the penalty kill that allowed the fourth-highest rate of goals against in the league.
In these first twenty games at even-strength, the Oilers had a -11 goal differential (33 goals for, 44 goals against) – a 42.85% goal-share that ranked 28th in the league. The team’s below average shooting percentage and save percentage were obvious factors. But there’s a few more underlying issues.
Happy to announce that I’ll be joining Oilersnation as a contributor for the upcoming season!
I’ve been a long-time reader of the website, even remember the very, very early days and some of the great writers that have written there in the past. It’s been a staple for Oiler fans and continues to be at the top in terms of hockey coverage. I’m happy to be joining such a talented group of people.
Special thanks to Oilersnation news director Zach Laing who reached out. One of the best in the Oilers fan community, a real professional who I’ve had the pleasure of hosting on my podcast a fewtimes.
I’ll still be using this website as a centralized repository for all of my work and will post links to my articles at Oilersnation and any radio segments for CBC Edmonton.
Appreciate the support I’ve received over these 14+ years writing here and elsewhere. Looking forward to what comes next.