Confidence levels

The Edmonton Oilers currently rank 16th in the league with a 0.545 points percentage, and have been pretty mid at even-strength (5v5). Their goal differential has been steadily improving, but they’re currently at -3 (43 goals for, 46 goals against). They’re only shooting at 7.05 percent (26th in the league) and have a team save percentage of 90.25 percent (23rd in the league). Note that the league average shooting percentage over the last three seasons has been 8.55 percent and the save percentage has been 91.47 percent. More on that in a second.

The Oilers are currently posting some excellent shot-share numbers, near the top of the league when it comes to critical metrics like Corsi For percentage and Expected Goals For percentage. So in a perfect world, their current goal-share of 48.31 percent eventually reaches somewhere around 53 to 55 percent, which is around where they were last season and the prior three seasons. Getting there is going to require the team and save percentage bouncing back. But how much confidence should we have in one or both of those things happening?

Based just on what I’ve seen from the Oilers, I have a lot more confidence in the team’s shooting percentage turning around. They have the top end talent, they have some depth pieces who have a good track record of scoring goals. And they’ve been relatively healthy, but we’ll wait to see what the long-term prognosis is for Hyman and Arviddson. The goaltending on the other hand has been pretty suspect for a while now, and there’s been enough mediocre stretches to indicate that goaltending is never going to be truly elite. But are there numbers to back this up?

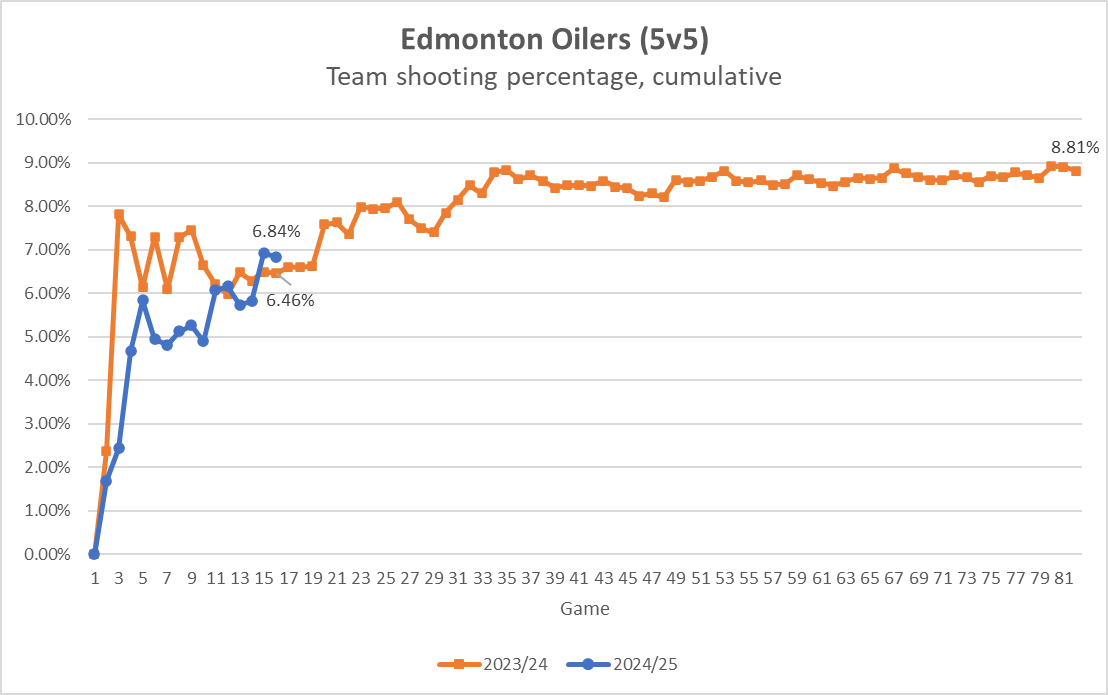
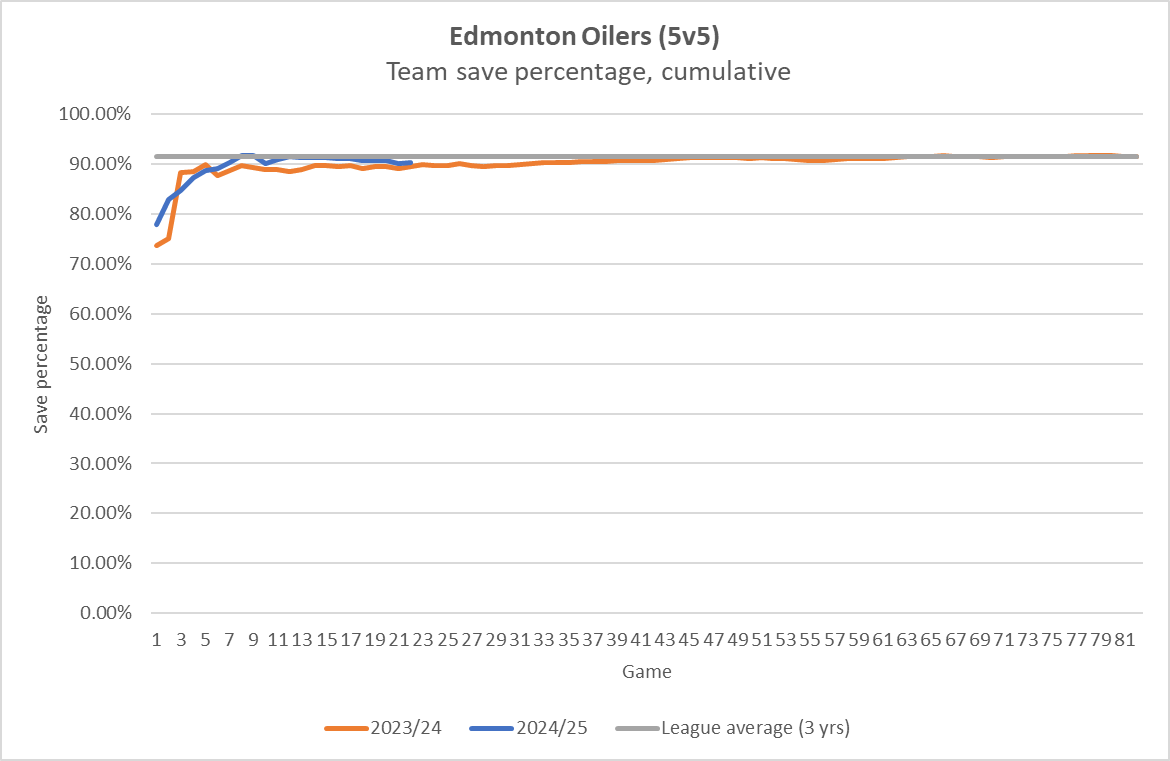
First, here’s a look at the Oilers cumulative team shooting percentage at even-strength this season and last season (2023/24). The gray line across represents the league average shooting percentage from the previous three seasons (2021-2024). What stands out here is that while the Oilers didn’t do a great job converting their chances early on last season, they eventually improved and were above league average rates for the most part. Not sure if the Oilers can replicate that this season, but with the talent up front, and a decent supporting cast, it’s more than likely.

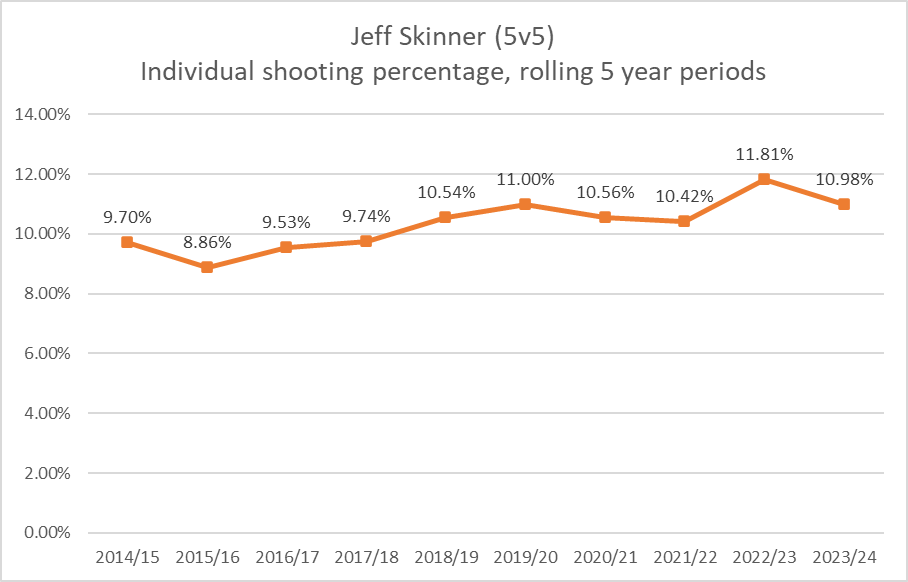
Goaltending on the other hand had some issues last season, and the best they could ever reach was league average. Not a lot of times was the goaltending one of the league’s best last season, so it’s hard to expect them to steal games this year or go on a long stretch of high-end goaltending. Especially since it’s the same two goalies as last season. The most we can reasonably expect from Skinner and Pickard is league-average, and a lot has to break right even for that.

I do wonder what the Oilers front office is thinking and what they have more confidence in bouncing back: the team save percentage or the team shooting percentage? It’s clear both areas have cost them wins this season and there’s a sense that it’s the offensive side of things that have management more concerned. My thought is that the goaltending is what needs an upgrade, and hopefully soon considering the high expectations for the team.

Data: Natural Stat Trick

Here’s what’s behind Jeff Skinner’s early-season struggles

It’s been a tough start to the season for Edmonton Oilers forward Jeff Skinner.

In his first seventeen games since signing a one-year, $3 million deal with the Oilers in the summer, Skinner has scored three goals and made three assists, all at even-strength. His on-ice goal-differential at even-strength is currently -5 (6 goals for, 11 goals against), which translates to a 35 percent goals-for percentage that currently ranks second last among Edmonton’s forwards. Considering he’s played the sixth most minutes on the team (217) and ranks sixth in average ice time per game at even-strength (12.79), his results are a problem that’s hard to ignore.

Over the last few games, the coaching staff has started to sit Skinner more often at even-strength. In the last two games, Skinner has averaged less than nine minutes, which is about 17 percent of the Oilers total even-strength time.  That’s well below the previous fifteen games where he’s averaged about 13 minutes a game, and 26 percent of the Oilers total even-strength time. The table below shows Skinner’s proportion of ice time per game in blue and the actual ice time per game in orange.

A graph showing how Jeff Skinner's ice time and proportion of ice as an Edmonton Oiler has been gradually declining at even-strength.

.

There are a couple of major issues with Skinner that have likely played a role in his decreased ice time.

One, Skinner just isn’t producing at the level and consistency that management was probably expecting from him. He’s scored three times on 44 shots so far – which is a shooting percentage of 6.82 percent. That’s well below the 10.98 shooting percentage he’s posted over his previous five regular seasons, and the 10.65 percent he’s posted over his fourteen-year career.  The Oilers are currently near the bottom of the league in terms of team shooting percentage (6.68 percent) and are relying on Skinner to help turn those even-strength results around.

.

The other issue is that Skinner’s on-ice numbers at even-strength, relative to his team’s numbers, have been poor so far. Corsi (or shot attempts) and Expected Goals help us understand how well the team does at controlling the flow of play and out-chancing opponents with specific players on the ice. And it helps us uncover who could be helping drive play and opportunities for a team, and who might be dragging the team down.

Skinner would currently fall under this latter category as the team is posting an Expected Goals For percentage of 52.45 percent with him on the ice, which isn’t bad. But his team’s share of Expected Goals jumps to 57.98 percent when he’s on the bench. Below is a table with all of the Oilers’ forwards on-ice relative to team numbers, sorted by average ice time per game. A basic heat map is applied to each metric (green is good, red is bad) to give a sense of how each player compares to their teammates.

A table showing each Edmonton Oilers forward's relative to team numbers at even-strength this season.

.

One issue with Skinner is that the team allows a significantly higher number of shots and chances against whenever he’s on the ice. For instance, without him on the ice, the Oilers allow about 23 shots against per hour. But when Skinner is on the ice, this rate jumps by about 25% to 30 shots against per hour. He’s one of the worst defensive forwards on the team, which isn’t overly surprising considering his previous teams have often allowed more shots when he’s on the ice. The difference in prior seasons was that he would help drive more offence and generate chances. But since he’s not having the same impact and the fact that his shooting percentage is down, he’s not providing a whole lot of value for the Oilers.

Worth noting that Ryan Nugent-Hopkins is also posting similar on-ice numbers as Skinner at even-strength, as the team tends to see a lot of chances against when he’s deployed. And it should probably be addressed by the coaching staff, considering he gets a lot of time in the top six with the star players. But because Nugent-Hopkins is on the first powerplay and kills penalties and has a +1 goal differential at even-strength, his underlying issues are likely going to be overlooked. At least for now.

As for Skinner, it’s understandable why the coaching staff has recently cut his minutes. His defensive play this season has been an ongoing issue, and it’s not just a couple of bad plays here and there that have led to this situation. Hopefully, there’s a plan in place to squeeze as much value out of Skinner as possible. But there’s also the harsh reality that Skinner’s defensive play has been a long-term issue over his previous seasons. And considering his age and the fact that he’s played over 1,000 NHL games, it’s hard to expect his defensive numbers to improve anytime soon.

Data: Natural Stat Trick

Also posted at Oilersnation.

Bouncing back

Scoring at even-strength (5v5) has been a major problem for the Edmonton Oilers this season. After 16 games, or about 20% of the regular season, the Oilers rank 28th in the league with a 6.84 percent team shooting percentage. That’s only ahead of San Jose, Detroit, Anaheim and Nashville.

Last regular season, the Oilers finished the year right around league average with a team shooting percentage of 8.81 percent, good for 15th in the league. They started the 2023/24 season just as poorly, posting an almost identical shooting percentage after their first sixteen games – only converting on 6.46 percent of their shots.

Below is a graph showing the Oilers cumulative shooting percentage over the course of last season (orange line). It took them a while to get going, but they finished the regular season well. And the shorter blue line represents the Oilers cumulative shooting percentage for the current regular season.

.

With the talent level they have and the team’s dominance when it comes to controlling the flow of play and scoring chances at even-strength, it’s likely that the Oilers team shooting percentage gradually improves and stops costing them games. But there’s a couple issues that they’ll need to address to improve their odds of scoring more frequently at even-strength.

First, the team needs to reduce the amount of low-danger shot attempts and shots. There’s been a few too many games where it’s felt like the opposing goalie is putting on an all-star performance. But it’s largely due to the Oilers rate of low-danger shot attempts (38.93 per hour) and low-danger shots on goal (13.91), both of which are close to highest in the league (based on Natural Stat Trick’s methodology). The Oilers are definitely a high-volume shot team, as they’re also good at generating higher danger chances. But when they do get those high danger chances, it’s like the opposing goalie is warmed up from all of the lower danger ones that they already faced and is making key saves.

The second issue for the Oilers to address is getting more shots from the forwards instead of the defencemen. So far this season, over 40 percent of their shot attempts and over 35 percent of their shots on goal are from their blueline, which is much higher than league average levels and the level they were at last year (refer to the table below). The team is about 5% higher than where they should be.

Proportion from defencemen (5v5) Shot attempts Unblocked shot attempts Shots on goal
League average (3 seasons) 34.3% 30.3% 29.6%
2023/24, Oilers 35.5% 31.0% 31.2%
2024/25, Oilers 40.1% 35.4% 35.3%

.

Considering how much bigger and more skilled the goalies are, and how much tighter teams are playing defence, it doesn’t make sense to create shots from low-percentage scoring areas. We’re seeing a trend in shooters taking fewer shots, and making more east-west plays to create higher quality chances and improve their odds of scoring. Maybe it’s the lack of passing talent on the Oilers blue line causing this, or just the team getting used to one another after so many roster changes. But it’ll need to be addressed if the team wants to improve their shooting percentage – and start climbing back up the standings.

Data: Natural Stat Trick

Related:

The Edmonton Oilers special teams are off the rails

One of the biggest reasons the Edmonton Oilers currently rank fifth in the Pacific and tenth in the western conference with a 0.464 points percentage is because of the terrible results on the power play and the penalty kill.

The powerplay was expected to continue being one of the best in the league, a status it’s maintained for a few years now thanks to their offensive talent and the fact that they’ve been together for so long. But in the first fourteen games of the season, the Oilers have only scored five times in 62 powerplay minutes, a rate of 4.82 goals per hour. That’s one of the worst in the league (just behind Anaheim) and well below the 9.69 goals per hour they had last season and the 13.21 they posted the year before.

The Oilers abysmal output rate on the powerplay is a level they never reached last season. The graph below shows the Oilers rate of goals per hour last season in fourteen-game rolling periods, with the blue line across representing their rate from the first fourteen games this season (4.82).

.

What’s especially alarming is that the Oilers rate of shots on the powerplay are also well below where it’s usually been. Again, they typically lead the league in generating chances, doing a good job getting shots through and retrieving rebounds to set up another ad hoc play. But it just hasn’t been happening as teams appear to have figured them out. Their current rate of 37.58 shots per hour is the second lowest in the league, and again well below what they posted over any fourteen-game rolling period last season. This indicates that the results on the power play might not turn around as quickly as expected, and that tactical and deployment changes are needed to get their rate of shots and chances up to where it should be.

The other interesting find here is that the Oilers rate of shots last season were gradually declining, which somewhat confirms what I was suspecting. Other teams may be figuring out the Oilers powerplay and have been using different tactics to slow them down.

.

Switching to the penalty kill, the Oilers are also far-off from their rate of goals against from last season. They currently rank dead last in the league allowing 16.27 goals per hour (represented by the blue line in the graph below). Last season, they were closer to league average with 7.55 goals against per hour, and at no point did they allow this high of a rate of goals against.

.

The good news is that the Oilers penalty kill is allowing an average rate of shots against (53.13) and closer in line to what they were posting last season (49.27). That’s a good indicator that the team has the right tactics and skaters, despite all of the roster changes in the off-season. The issue is that their goaltending isn’t pulling their weight and posting a save percentage of 69.39 percent (!) – the worst in the league. Skinner has a history now of struggling for stretches on the penalty kill despite his team limiting shots and chances against. So it’s difficult to have confidence in his abilities going forward.

.

One last note. The Oilers special teams, based on their shots and expected goals for and against, and average shooting and save percentages, should have a goal differential of +1.85. Their powerplay is struggling to create chances, otherwise this number would be better. But because of that, and how badly the goaltending has faltered on the penalty kill, the Oilers combined special teams goal-differential is actually -10. That’s a difference of almost 12 goals, which translates to a couple wins in the standings. The Oilers should be sitting in the top three in the Pacific, but are instead sitting tenth in the west.

Data: Natural Stat Trick

Tracking the Western conference – As of October 31, 2024

In past seasons, I’ve done Pacific-division reviews for the first few months and then switched to the western conference reviews as the playoff races started to pick up. This season, I’ll be just getting straight into the western conference. The Oilers are pushing for banners and championships, so I’m more interested in how they stack up with the rest of the conference. Especially the central division which has a couple legit contenders.

The Oilers are off to a slow start, which isn’t overly surprising considering all of the new players who need time to adjust, the loss of speed and talent in the off-season, the holes on defence and the goaltending. The good news is that overall, the team is playing well and controlling the flow of play and scoring chances. They just can’t capitalize on their opportunities or get a save. Plus their special teams have been a mess.

Below are the even-strength (5v5) numbers for each team in the western conference (sorted by points percentage), including goal-share results as well as the shot-share metrics that give us a sense of which teams have the right processes in place and if the results are sustainable or not. At the end of the table are each team’s shooting percentage and save percentage. I’ve also applied a basic heat map to each metric to show which teams are doing well or struggling relative to their conference foes (i.e., green is good, red is bad). You can also find a description of each metric at the end of this article. Please note that the shot-share metrics are score and venue adjusted based on Natural Stat Trick’s methodology.

.

After 11 games, the Oilers are sitting 10th in the western conference with a 0.500 points percentage. That’s tied with Anaheim and Seattle, neither of which are contending for much this season. What stands out is that the Oilers have posted some of the best shot-share numbers in the league. Yes, they have trailed a lot in games which skews the numbers as teams with the lead play less aggresively. But even when the scores have been close (within one goal) or tied, the Oilers shot-share numbers have been excellent. The issue is that their team shooting percentage is one of the worst in the league and their goaltending has been below average. If they can even be average at scoring and saving goals, they should move up the standings quickly.

I’d expect teams like Anaheim, San Jose, Seattle, Calgary and St. Louis to gradually drop in the standings. And it’ll be interesting to see where Vegas lands, as they have the talent but don’t appear to have sustainable results. They’re currently posting some poor shot-share numbers, and their results appear to be driven by a higher than normal shooting percentage.

The one other thing I’m interested in tracking is the volume of low-danger shots the OIlers generate this season. There was an interesting piece by Justin Bourne on Sportsnet about how teams that generate a lot of low danger shots are not doing themselves any favors, and are actually helping the opposing goalie get into the game more.

This all brings me to a detail from a more recent Valiquette interview, where he noted the data from his company, Clear Sight Analytics, shows a connection to low danger shots and losing. Teams have the highest winning percentage when they get seven or more high danger shots, while at the same time taking 12 or fewer low danger shots.

While it’s certainly not a solution on its own, the data showed teams that take just 0-9 low danger shots in a game win 60 per cent of the time, while teams that get up around 23-25 win just 33 per cent of the time. You end up keeping the opposing goalie warm and engaged, and essentially create turnovers via bad shots. You go from having solid possession to a whistle, or possibly to the other team having the puck.

Right now the Oilers are generating the third highest rate of low-danger shot attempts and the fifth highest rate of low-danger shots on goal at even-strength, which could explain why they’re having trouble scoring despite having the puck a lot.

Data: Natural Stat Trick

Glossary:

  • Points-percentage (Point%) – The total points accumulated divided by the points that were available, including extra time.
  • Corsi for percentage (CF%) – The proportion of all the shot attempts the team generated and allowed that the team generated (i.e., corsi for/(corsi for + corsi against). This is used as a proxy for possession and is the best at predicting a team’steam’s future share of goals (GF%). (Source: Hockey Great Tapes – Draglikepull)
  • Fenwick for percentage (FF%) – The proportion of all the unblocked shot attempts the team generated and allowed that the team generated (i.e., Fenwick for/(Fenwick for + aenwick against). This is used as a proxy for shot quality and considers shot blocking a repeatable skill.
  • Expected goals for percentage (xGF%) – This is a weighting placed on every unblocked shot based on the probability of the shot becoming a goal. This depends on the type of shot, location and uses historical shot and goals data to come up with the probability for each unblocked shot.
  • Goals for percentage (GF%) – The proportion of all the goals that the team scored and allowed that the team generated (i.e., Goals for/(Goals for + goals against).
  • Shooting percentage (SH%) – The percentage of the team’steam’s shots on goal that became goals (i.e., total goals divided by the total shots on goal).
  • Save percentage (SV%) – The percentage of the team’steam’s shots on goal against that were saved (i.e., 1-(totals goals allowed divided by the total shots on goal against)).