Buying low and managing expectations

NHL: Washington Capitals at Nashville Predators

The Oilers made a sensible deal last week acquiring forward James Neal from the Calgary Flames in exchange for Milan Lucic. For a minor fee, the Oilers were able to bring on a forward that has a better chance of bouncing back, considering the drop in his shooting percentage last season compared to his career average, and they also gained some much needed cap flexibility in the future if they need to buy-out the remaining years of the contract. The Flames slightly reduced their cap-hit and also shed some real dollars, but I still can’t understand why they were so desperate to move Neal that they would take on a heavy, burdensome contract like Lucic’s.

Below are Neal’s even-strength (5v5) stats since 2008/09, including his total goals, assists, points, shots, shots per hour and individual shooting percentage.

Season Team GP TOI G-A-P Shots Shots/60 Sh%
2008/09 DAL 77 949.37 15-11-26 126 7.96 11.90
2009/10 DAL 78 1064.82 22-19-41 148 8.34 14.86
2010/11 DAL/PIT 79 1119.63 16-18-34 157 8.41 10.19
2011/12 PIT 80 1134.65 22-26-48 208 11.00 10.58
2012/13 PIT 40 514.70 11-7-18 93 10.84 11.83
2013/14 PIT 59 802.70 14-17-31 153 11.44 9.15
2014/15 NSH 67 950.97 16-13-29 170 10.73 9.41
2015/16 NSH 82 1248.35 24-13-37 197 9.47 12.18
2016/17 NSH 70 978.22 15-9-24 148 9.08 10.14
2017/18 VGK 71 992.12 17-12-29 156 9.43 10.90
2018/19 CGY 63 784.55 5-8-13 108 8.26 4.63

What we know about Neal is that his point production has gradually declined, with his most recent season being his absolute worst. What especially stands out is his individual shooting percentage of 4.63% last season, an anomaly over the course of his career and well below his career average prior to the 2018/19 season (11.11%). Knowing that individual shooting percentages typically regress towards the mean over time, there’s a decent chance Neal’s bounces back next season. How much of a bounce-back depends of course on the player’s aging, as well as the situations (i.e., teammates, competition, zone starts, etc) that the player will be in.

Neal - Shooting percentage.jpg

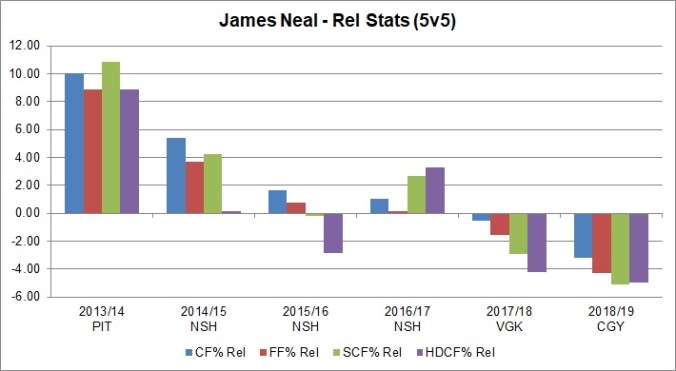
While the Oilers hope that Neal’s 2018/19 season was an anomaly, it’s worth noting that his overall play has gradually declined even prior to his arrival in Calgary. Looking at his relative-to-team stats over the last five years, we see that his more recent teams have done better without him at even-strength than with him. The graph below includes relative to team Corsi For% (CF% – proportion of shot attempts, a proxy for possession), Fenwick For% (FF% – proportion of unblocked shot attempts, a proxy for scoring chances), Scoring Chances For% (SCF% – as defined by Natural Stat Trick), and High Danger Scoring Chances For% (HDCF% – as defined by Natural Stat Trick).

For instance, in his single season in Vegas in 2017/18, the Golden Knights posted a 50.51% Corsi For percentage at even-strength with Neal on the ice, but a slightly better proportion of shot attempts without him. Relative to the team, Neal was a -0.51 Corsi-rel, which must have been a little disappointing for the Vegas coaching staff considering he received top-six minutes (finished fourth on the team among forwards in ice time per game with 13:58) and he always posted solid numbers with and without star players in Pittsburgh and Nashville. Vegas also did better without Neal when it came to scoring chances, a trend that continued and got worse in Calgary.

Neal - Rel Stats

What’s interesting about Neal’s stint in Calgary is that he finished seventh on the team among forwards in ice time per game (12:27), most often playing in the bottom six with Mark Jankowski and Sam Bennett. His reduced playing time might have to do with the fact that against elite players, his on-ice numbers had been in decline. (Data: Puck IQ)

Season Team TOI TOI% CF% (Rel) DFF% GF%
20142015 NSH 335.98 35.42 53.6 (+5.40) 51.9 (+0.90) 57.10
20152016 NSH 470.25 37.74 55.8 (+8.00) 60.2 (+9.50) 71.40
20162017 NSH 315.08 32.34 48.4 (-1.60) 48.1 (-2.50) 39.10
20172018 VGK 378.37 38.05 44.9 (-6.40) 43.4 (-12.70) 41.70
20182019 CGY 223.90 28.54 52.4 (-0.60) 47.9 (-5.10) 50.00

The table above includes Neal’s numbers against elite talent, as defined by Puck IQ. Included is Neal’s on-ice Corsi For percentage and relative to team mates number, as well as Dangerous Fenwick (DFF%), which is a “weighted shot metric using shot distance location and type of shot to give each shot a danger value”, and goals-for percentage (GF%).

In Nashville, and prior to that, Neal was playing often against the other team’s top end players, spending over 35% of his ice time at even-strength in these situations and faring quite well relative to his teammates. In 2016/17 however, while playing 32.3% of his time against top end talent and finishing second on the team among forwards in ice time per game, he posted a 48.40% Corsi For percentage in these situations, which was a drop relative to his teammates (-3.73). When he was left unprotected by the Predators in the expansion draft and went to Vegas, things got even worse as he again played often against elite talent but posted a very poor 44.90% Corsi For percentage, or a -6.40 relative to his teammates. The Flames coaching staff may have been aware of his declining performance against high end talent and his poor goal-share as they deployed him far less frequently against elites (28.5% of his even-strength ice time spent against them) and did see him post a very solid 52.40% Corsi For percentage (-0.60 relative to teammates) and a 50.0% goal-share. Unfortunately, this reduced playing time meant less time with skilled forwards, which may have played a role in his 4.63% individual shooting percentage.

It will interesting to see how the Oilers manage Neal, who because of the lack of scoring talent will likely get plenty of opportunities playing with McDavid, Draisaitl or Nugent-Hopkins. Hopefully the Oilers are aware of Neal’s declining on-ice numbers and how poorly he’s fared against elite talent when he was getting top six minutes. It would be in the Oilers coaching staff’s best interests to have a deployment plan in place to mitigate any risks Neal’s acquisition brings to the team and get as much offence as they can from the player.

Data: Natural Stat Trick, Puck IQ

Related:

Also posted at The Copper & Blue.

Background check

Vancouver+Canucks+v+Edmonton+Oilers+GMeVxxCCiATx

Following the Oilers signing of Markus Granlund to a one-year, $1.3 million contract, we were immediately informed of his experience and success on the penalty kill in Vancouver. And that it was a reason why the Oilers signed him.

The Oilers were 30th on the PK at 74.8 per cent with Chicago 31st at 72.7 per cent last year. Granlund did his best work on a shutdown line with fourth-line centre Jay Beagle and helped the Canucks 11th overall penalty kill with centre Brandon Sutter. (Source: Edmonton Journal)

When you get information like this – that’s obviously being distributed by the management group that just invested in a player, and probably the player’s agent as well – it’s always a good exercise to suss out just how much of an impact an individual player had on the overall success of the team.

In this case, we know that the Canucks had a decent penalty kill last season, finishing 13th in the league allowing 6.86 goals against per hour. This was due in large part to their ability limiting shots-on-goals against, ranking 9th in the league allowing 48.3 per hour. Had their goaltending been league average (their team save percentage ranked 21st in the league with 85.80%), their penalty kill very likely would have finished in the top ten. And we also know that Granlund led all Canucks skaters in total ice time on the penalty kill, and was fourth among forwards when it came to average ice time per game. So naturally, one could connect the information and assume that since Granlund played significant minutes on the penalty kill, he must have had a positive impact.

But when you dig into Granlund’s on-ice numbers, you realize that that’s not the case at all.

In the team-leading 183 penalty kill minutes that Granlund was on the ice, the Canucks allowed a rate of 9.16 goals against per hour. To put things into perspective, the Oilers penalty kill allowed a rate of 9.21 goals against per hour, good for 30th in the league. In the 236 penalty-killing minutes that Granlund wasn’t on the ice, the Canucks allowed a rate of 5.07 goals against per hour, which is right around the rate the Lightning and Coyotes posted as top penalty kill units last season.

Now the rate of goals against are heavily influenced by the goaltenders performance, which as mentioned above was below league average, so you can’t put everything on Granlund. Having said that, the rate of shots against – which players do influence as it’s part of their job – also saw a jump when Granlund was on the ice compared to when he was on the bench. Last season with Granlund on the ice, the Canucks allowed 54.31 shots-on-goals against per hour; without him that number dropped significantly to 43.63. What’s alarming is that even the season prior (2017/18), Granlund’s penalty kill numbers were just as poor. The team allowed the second lowest rate of shots against (49.8) in the league; with Granlund on the ice they allowed 60.71 shots per hour and without him they allowed 45.29. For someone being touted as a penalty kill option, it’s strange that his former team had so much better success limiting shots without him on the ice.

It’s also worth looking into the impact Granlund had on his teammates, specifically the defencemen, to see if someone else was potentially driving up his on-ice rate of shots against. Below is a graph showing what the rate of shots-on-goal against were when Granlund was deployed with the various Canucks defencemen last season, and how those defencemen did away from Granlund. Included is the team’s overall rate of shots-on-goal against (grey line across). Again, I focused on shots as it’s something that the players can influence, while the rate of goals against are more reliant on the goaltender’s performance.

Granlund PK WOWY.jpg

Across the board, the most commonly deployed Canucks defencemen saw their own on-ice rate of shots-on-goals against drop on the penalty kill when they didn’t have Granlund on the ice with them. For whatever reason, each defencemen’s numbers would jump when Granlund was deployed with them, making you wonder why that would happen and how the Oilers think they’ll mitigate the issue. This of course is assuming they know about Granlund’s past penalty kill numbers – they did just sign him to a  contract and penciled him in as a penalty kill option.

Considering how poorly the Oilers performed on the penalty kill last season, and the massive impact it’s had on their overall goal-differential, you would hope that the Oilers have identified their needs and have a plan in place to bring in the right personnel and tactics. So far, it doesn’t appear to be the case.

Related: Penalty Kill Expectations – The SuperFan (2019, May 30)

Data: Natural Stat Trick

Also posted at The Copper & Blue.

UPDATE: 2019, July 5 (11:50 PM)

Couple important points I want to add based on some of the feedback I received.

First, we can assume Granlund was on Vancouver’s first penalty kill unit based on his total ice time. However, as I mentioned in the article, his average ice time per game was third among forwards last season, meaning when the roster was healthy and Brandon Sutter was available, Granlund was moved down to the second powerplay unit where he’s probably better suited.

Another question I received was how Granlund’s on-ice numbers compared to the top penalty killing forwards on other rosters. Below is a list of 31 forwards (one from each team) and their on-ice rate of shots and goals against relative to their teams.

granlund vs peers

One thing that stands out is that because this group of players likely played against the other team’s top powerplay unit, their on-ice rate of shots against were higher relative to their team – the average among the group is +5.45 shots against per hour. So it should be no surprise that Granlund’s numbers were poor. Having said that, compared to his peers, Granlund’s on-ice rate of shots against (+9.36), as well as goals against (+4.04) relative to his team were one of the worst.

Thoughts on the Oilers off-season activity + CBC Radio Active segment

cbc edmonton logoIn case you missed it, I joined Adrienne Pan on CBC Radio Active in Edmonton on Tuesday afternoon to talk Oilers. Segment is here: CBC Radio Active (2019, July 2)

Couple thoughts on the Oilers off-season and their activity around free agency.

Mike Smith

  • The Oilers were already in a precarious situation with Koskinen as one of the netminders under contract for the 2019/20 season. Last season, he posted a 0.906 save percentage (all situations). good for 41st out of 60 netminders who played at least 1,000 minutes (approximately 20 games). And he ranked 49th among the same group when it came to goals saved above average (GSAA) with -6.21. More on GSAA can be found at In Goal Magazine.
  • That’s what makes the Mike Smith signing even more puzzling. By adding a 37 year old goalie who has been on the decline for a few years now, the Oilers have taken on even more, unnecessary risk at such a critical position. Last season, among the same group of 60 goalies, Mike Smith ranked 53rd with a 0.898 save percentage, and 53rd in GSAA with -12.65. The good news is that it’s only a one-year term.
  • Smith might be the team’s solution for the short-term, but the long-term issue remains: the Oilers don’t have a young starter-in-waiting, and are a few years away from one of their prospects to emerge as a legitimate option.

Markus Granlund

  • Thought this was a good signing as it creates competition for guys like Tyler Benson and Kailer Yamamoto, and at a reasonable price point.
  • One thing to note. It’s easy to pencil Granlund in as penalty kill option since he led the Canucks in total ice time last season among forwards, and had the third highest rate of minutes per game. But it’s worth noting that while the Canucks penalty kill was right around league average (in terms of goals against), they allowed the second highest rate of shots on goal against and the third highest rate of goals against with Granlund on the ice. Some ugly numbers over his three full seasons in Vancouver shorthanded, so it’d be wise to temper expectations. Noting this as an example of management potentially making a poor assumption based solely on a players ice-time and the team’s overall results.

Tomas Jurco

  • Good, low-risk signing for a productive forward who has shown progress from his injuries.
  • Worth noting that between 2013/14 and 2015/16, his full three seasons in Detroit, Jurco posted a 54.58% Corsi For pecentage – good for fourth among forwards who played at least 250 minutes (approximately 20 games). He ranked third when it came to on-ice unblocked shot attempts (Fenwick) against. If he can get back into form, the Oilers may increase their odds of out-scoring the other teams’ bottom six.
  • Good article from 2016 on Jurco, his productivity and lack of opportunity in Detroit from Iyer Prashanth. Appears at the time the Red Wings favored their over-priced veterans over their young emerging talent – but still applied their over-ripening policy even when the youngsters were showing well. Duly noted.

Gaetan Haas

  • Using an NHL equivalency calculator, the 192 points in 392 games in the Swiss league translates into about 17 points at the NHL level – more or less a replacement level player that can compete with the likes of Joseph Gambardella and Cooper Marody for more of the bottom six minutes.
  • Bruce McCurdy had a great write-up at The Cult of Hockey.

Alex Chiasson

  • This was clearly plan-C (heh) for the Oilers once they lost out on the Brett Connolly and Gustav Nyquist group. And it only makes sense if the Oilers add a legitimate winger to their top six before training camp. In his limited time in the top six, Chiasson wasn’t very good, dragging down the team’s possession numbers at even-strength even when paired with McDavid and Draisaitl (48.7 CF%, 48.8 FF% when all three were on the ice). Keeping my expectations low, but will be thrilled if he can score 20 goals again.
  • Chiasson was effective on the powerplay last season, posting 4.71 points per hour (fourth among regular forwards) and an on-ice goals-for rate of 9.72 (first among forwards). Depth players who can chip in on special teams is not a luxury, it’s a necessity.

Jujhar Khaira

Miscellaneous

  • We’re starting to see what Holland’s approach will be like going forward, as he’s made some nice low-risk signings but also made a couple moves (Smith signing, Sekera buyout, Playfair hiring) that appear to be based on limited information.
  • The Oilers have to be moving towards more progressive management practices, and need to implement evidence-based decision making processes. It’s obviously still early, but the Oilers need to enhance their front-office to become real championship contenders.
  • The Oilers obviously have to add skill up front, but there should be some concern about the blue-line as they’ve downgraded their puck moving ability. It’d be great if one of the young defencemen in the system can emerge and fill Sekera’s spot, but there has to be a contingency plan in place. Re-signing someone like Gravel would have been a start, as he was fine as a depth option and was productive on special teams. But they’ll need to bring in someone with more NHL experience and offensive ability.
  • As it stands, the Oilers are taking on a lot of risk, hoping for a number of players to have bounce-back seasons – which makes me wonder if they’re more focused on 2020/21 being the season they compete. It might not be the worst idea considering how much more flexibility they’ll have next summer and how many players should/will be turning pro.

Data: Natural Stat Trick