The Edmonton Oilers 2025/26 regular season was a disappointing one as they finished with only 93 points – a 0.567 points percentage that ranked 14th in the league. Considering the previous five straight seasons of having a points percentage above 0.600, including four (kinda five) straight 100-pont seasons – this is definitely a drop off. But thanks to a weak conference, and especially a weak Pacific division where all five Pacific division playoff teams were below 0.600 and ranked 13th or lower in the league, the Oilers still managed to secure home ice advantage in the playoffs. Wild.
The Oilers lack of success was largely driven by their mediocre play at even-strength (5v5). Their -14 goal-differential and 48 percent goal-share ranked 20th in the league, which wasn’t surprising considering their Corsi For percentage barely broke even. Their share of scoring chances was a little better, and ranked in the top ten league-wide, but there was a noticeable drop off from previous seasons when they would be near the top of the league when it came to expected goal metrics.
That’s probably what’s the most troubling part about the Oilers regular season. Last year, they also had a negative goal differential at 5v5, but they were at least posting exceptional shot-share numbers, which meant the positive results were eventually going to come. This year however, it’s hard to have that same level of confidence, especially when you consider the team’s shot-share metrics are all around the 47 percent mark when McDavid or Draisaitl weren’t on the ice. The results have been just ghastly with the team posting a -31 goal differential when one of the glimmer twins aren’t deployed.
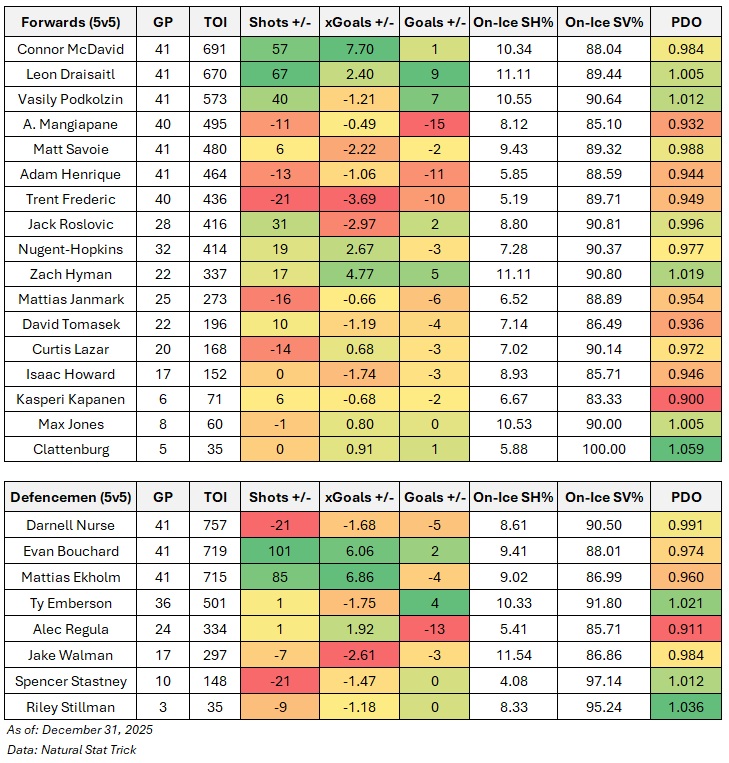
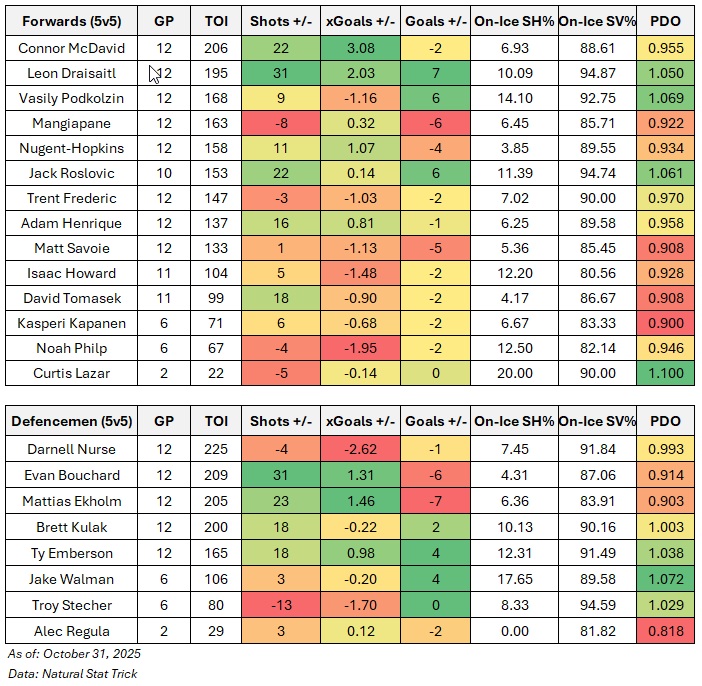
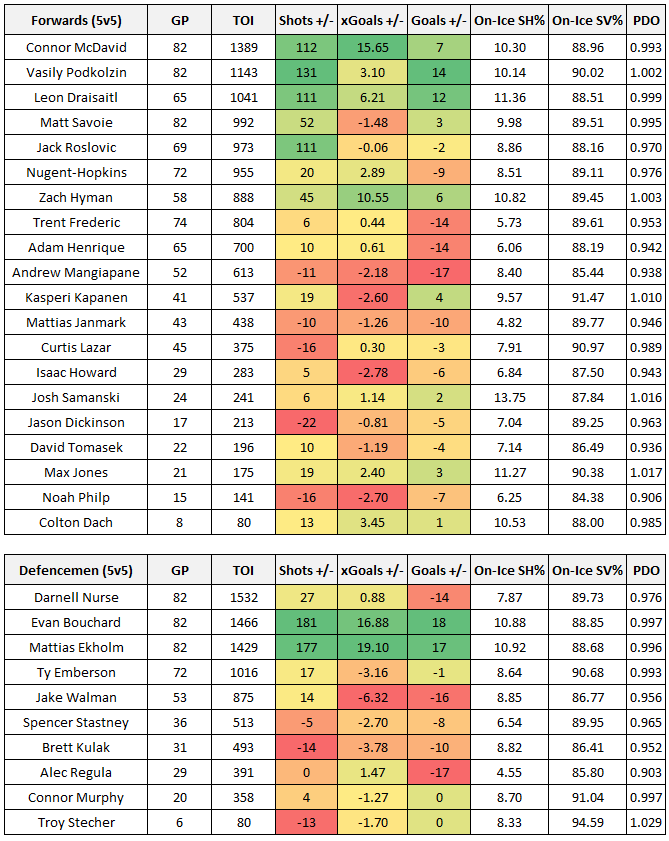
Here’s a quick look at the Oilers’ skaters, and their on-ice numbers sorted by ice time. Included is each player’s on-ice shot differential, expected goal differential and actual goal-differential. And for additional context, each player’s on-ice PDO is captured. A basic heat map is applied to show how players compare within their cohort. The key takeaway here is that the Oilers top six group is pretty good, and the rest are a bunch of blots ready to be exploited. Dickinson hasn’t been the solution for the bottom six group, and it’s hard to tell who can step up in the playoffs. The defence group has one solid pairing and the rest is a spot of bother.
The other factor to consider is the just-barely-average goaltending the Oilers are heading into the playoffs with – with Ingram taking the starter role. This is definitely an upgrade from previous seasons and bodes well for the team. But it’s a little concerning that the teams 5v5 save percentage was 88.84 percent (dead last in the league) over the course of the full season, and around the same mark over the final twenty-five games. Ingram just needs to be average, and Jarry should hopefully not see much ice time.
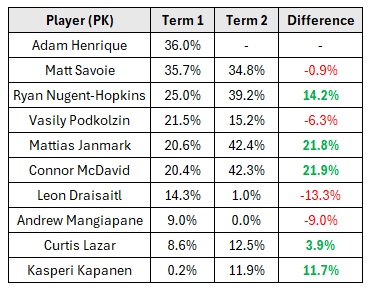
Quick notes on special teams. The Oilers powerplay finished the season as the league’s best, which is no surprise, scoring 11.88 goals per hour. This was largely driven by their high rate of shots and chances, which all ranked at the top. The penalty kill is where things are a little sketchy. The team finished 21st overall, allowing 8.16 goals against per hour. The team had trouble preventing shots and chances (all ranking in the bottom third of the league) and the goaltending was around league average levels. What’s interesting is that the team did do a better job at preventing shots at even-strength over the final stretch of the season, so it’s a little odd that this focus on defensive play didn’t translate to special teams.
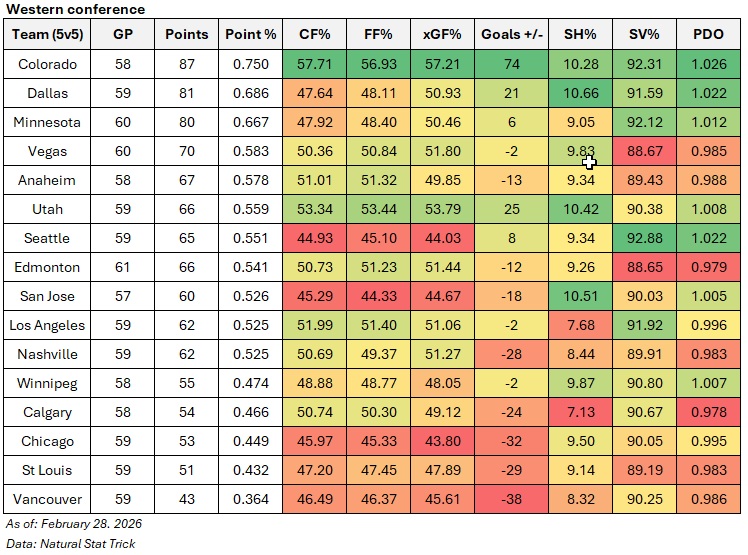
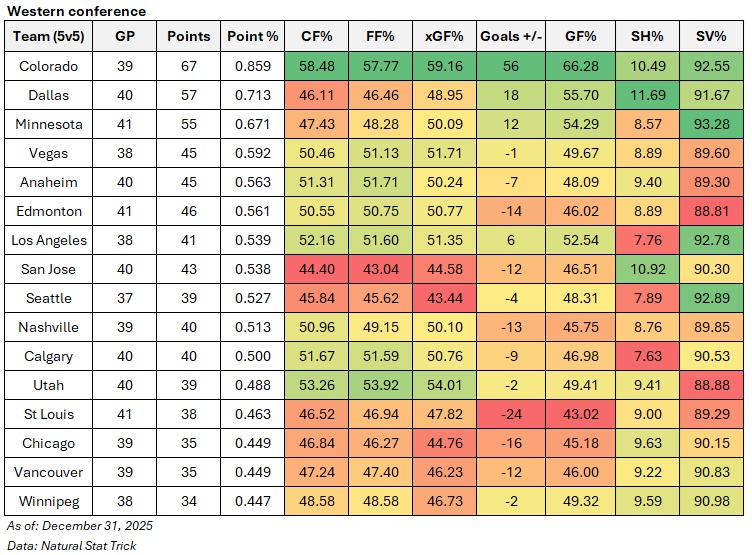
Below are the final even-strength (5v5) numbers for each team in the western conference (sorted by points percentage), including goal-differential results as well as the shot-share metrics that give us a sense of which teams have the right processes in place and if the results are sustainable or not. At the end of the table are each team’s shooting percentage and save percentage. I’ve also applied a basic heat map to each metric to show which teams are doing well or struggling relative to their conference foes (i.e., green is good, red is bad). You can also find a description of each metric at the end of this article. Please note that the shot-share metrics are score and venue adjusted based on Natural Stat Trick’s methodology.
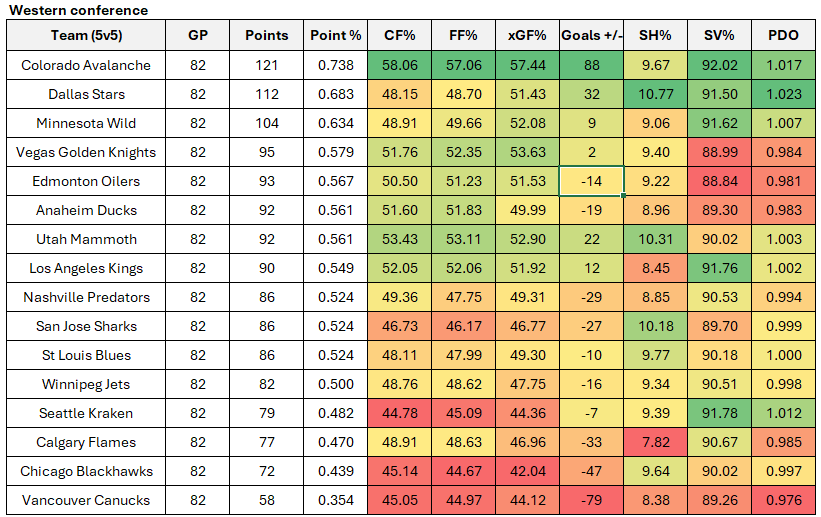
Again, it was a giant, chaotic joke of a Pacific division/western conference/NHL. All five Pacific teams that made the playoffs had a lower points percentage than the Washington, who had the 12th best points percentage in the league (0.579), but still missed the playoffs. Los Angeles ranked 20th in the league with 0.549 and made it. Detroit, Long Island and Columbus all had better points percentages than Los Angeles and all missed the playoffs.
Vegas, Edmonton and Anaheim all had issues in net, so the results should probably have been better considering their ability to control the flow of play. What’s interesting is that over the course of the season, there wasn’t a lot of movement among the teams, and we had a good sense of who would make it pretty early on. The teams that did catch fire and media attention often fizzled out as their underling numbers were often poor. So there really wasn’t much excitement, especially with the Pacific being so, so bad.
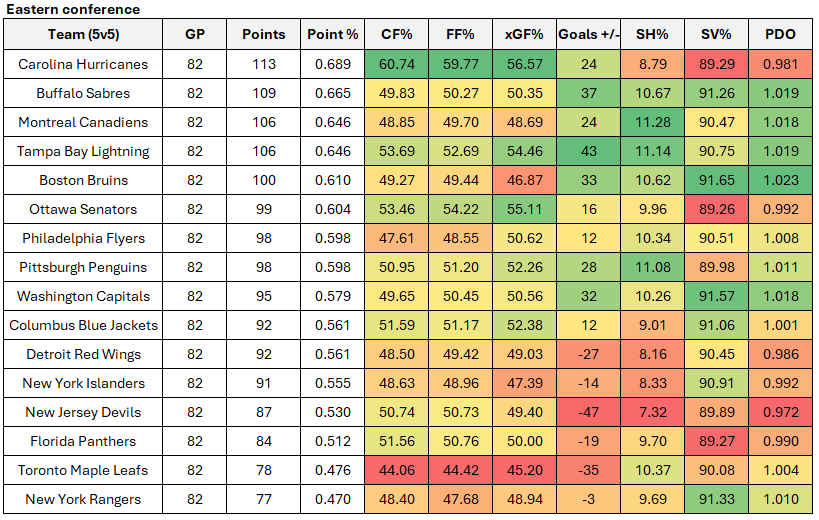
For reference, I’ve also put the table together for the eastern conference. Carolina, Tampa Bay and Ottawa all posted strong shot-share numbers, but it appears they’ve also had some goaltending issues. Buffalo obviously did well, but I do wonder if we see them struggle considering their shot-share numbers weren’t great and they rode the PDO pony a bit. Same with Montreal. Boston appears a little fraudulent, as does Philadelphia, so I don’t think they’ll get very far.
Obviously pulling for Edmonton because of the smart cats they have in the front office, but I’m thinking it’ll be Colorado coming out of the west and likely Carolina and Uncle Dennis representing the east.
Data: Natural Stat Trick